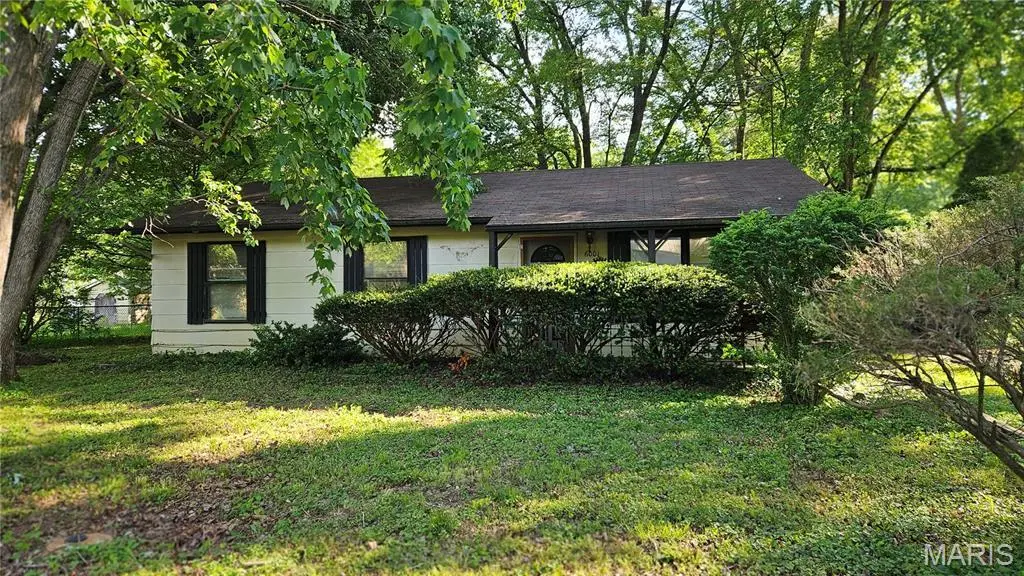
6001 Country Creek Dr · Byrnes Mill, MO
Flood risk 7/10 · Major
- FEMA flood zone
- AE
- Chance of flooding over 30 yrs
- 0.98%
- Est. flood insurance / yr
- $1,737 – $8,500
Fire risk 3/10 · Minor
- Est. fire insurance / yr
- $1,054 – $1,958
Heat risk 5/10 · Moderate
- Hot days now (above 105°F)
- 7 days/yr
- Hot days in 30 yrs
- 20 days/yr
Wind risk 2/10 · Minimal
- Chance of severe wind over 30 yrs
- 1.0%
Air-quality risk 3/10 · Minor
- Unhealthy air days now
- 1 days/yr
- Unhealthy air days in 30 yrs
- 4 days/yr
Risk factors via First Street. Map © Google.
Why this score? — see what drove the B grade
The composite is a weighted blend of 9 inputs, each scored 0–100. Each bar is that input's sub-score; the figure is the points it added to the 100-point composite (weight × sub-score).
- Cash flow +30.0/30.0
- 1% rule +10.0/10.0
- DSCR +10.0/10.0
- ARV discount +9.8/15.0
- Schools +3.5/10.0
- Livability +2.9/5.0
- Rent growth +2.5/5.0
- Condition / age +2.5/5.0
- Appreciation +0.0/10.0
$105,000
🖨 Deal sheet (PDF) 📄 Offer letter ✓ Due diligence
Listing remarks
Home is being sold as is and is priced accordingly. Home is being sold as Probate sale.
Key facts
- 0.36 acre lot
- Built 1980
- Listed 12 days
Property features AI
Finance
- Financial info: Lease not considered
Exterior
- Parking: Driveway
- Utilities: Public water; Septic tank sewer; Electric service by Ameren
- Home design: Single-family house; One level
- Construction: Frame construction; Shingle roof
- Exterior features: Back yard; Chain-link fencing; Shed(s); Level lot with some trees
Interior
- Kitchen: Kitchen
- Bedrooms: 3 bedrooms (all on the main level)
- Bathrooms: 1 full bathroom (on the main level)
- Heating & cooling: Electric heating; Central air conditioning
- Interior features: 7 total rooms; Living room
- Laundry & utility: Laundry located in the kitchen
Neighborhood map
What this means for you Summary
Snapshot
- This is a 3-bed/1.0-bath other listed at $105k.
Deal economics
- At list price, monthly cash flow is $137 ($2k/yr) — positive.
- The deal already cash-flows at list — no discount required.
- Meets the 1% rule at list price ($2k rent vs $105k).
- Cap rate 12.7% vs local median 3.8% in Byrnes Mill — top-decile yield for the area; either an underpriced asset or a hidden risk that comps aren't pricing in. Stress-test before assuming the spread holds.
Location & tenants
- Location reads 58/100 on livability (#591 in MO) — a working-class tenant base; expect higher turnover. Strengths: employment A+, housing A+, cost of living A-; Watch: crime C-, amenities F, commute F.
- Northwest R-I (suburban): math 37% / reading 43% proficiency, ranked #128 of 324 in MO (top 40%) — families likely to look elsewhere, expect single-tenant / working-renter base with shorter leases.
- Zoned schools: House Springs Elem. (math 35% / reading 38%, grade F, #656 of 1,115 statewide, top 59%, 481 students, 44% FRL); Northwest High (math 26% / reading 56%, grade F, #236 of 521 statewide, top 45%, 1,841 students, 27% FRL) — zoned schools at 36% FRL track the district average.
- Market conditions: 115 active listings in the ZIP; 807 units permitted in Jefferson County in 2024 (104 in 5+ unit buildings).
Forward outlook
- Local home prices are declining (-3.0%/yr); year-one equity from $726 of loan paydown is wiped out by about $3k of value loss. Plan a longer hold.
Negotiation context
- Only 12 days on market — expect competitive offers; lowballing is unlikely to land.
Risks & watch-outs
- Watch-outs: flood insurance adds $427/mo.
- Climate carrying-cost: in FEMA flood zone AE (mandatory federal flood insurance); extreme-heat days projected 7→20/yr by 2055 (HVAC capex compounding) — expect insurance premiums to compound above CPI over the hold.
Questions for the listing agent
- What's the actual annual flood-insurance premium (NFIP or private), and is the property in a SFHA with mandatory coverage?
- Is there a deadline driving the sale (1031 exchange, divorce, estate, relocation)? That informs how much negotiation room exists.
- Schools are F-rated, which usually means shorter tenancies and higher turnover. Who's the typical renter profile here, and what's been the actual vacancy rate?
- What's the average days-on-market for RENTAL listings here right now (not sales)? A rising rental-DOM trend means longer vacancies and softer asking-rent achievability than the comps imply.
- What's the recent tenant-quality profile in this submarket — average credit score on applications, eviction rate, late-payment / NSF rate, and stable-employment percentage? A property-management company in the area should have these aggregated.
- How much new for-sale + rental construction is in the pipeline within 1–3 miles? Heavy new supply typically softens prices + rents 12–24 months out; constrained supply supports both.
Investment metrics
- 1% rule
- 1.50% ✓
- Cap rate
- 12.74%
- Cash-on-cash
- 23.01%
- DSCR
- 2.02
- GRM
- 5.6
CMA / ARV
- ARV (median comp)
- $110,757
- List price
- $105,000
- Delta
- -5.20%
- Verdict
- FAIR
- Comps
- 8 within 1.0 mi
Projected returns pro-forma
-3.0% appreciation · 3.0% rent growth · sell at horizon
- IRR
- -7.4%
- Equity multiple
- 0.73×
- Total profit
- $-8,022
- Equity at exit
- $15,656
- IRR
- 2.5%
- Equity multiple
- 1.18×
- Total profit
- $5,308
- Equity at exit
- $9,078
Cash invested: $29,400 (down + closing). Projections, not guarantees.
Landlord ↔ Tenant lean methodology
- Overall (STATE)
- 81 Strongly Landlord-Friendly
- State Missouri
- 81 Strongly Landlord-Friendly · R+10
- County
- — inherits STATE
- City
- — inherits STATE
ZIP-level market 63051
- Active inventory
- 115
- Price-to-rent
- 5.6×
Monthly cashflow live
- Estimated rent
- $1,573 medium interval (Pro) →
- Mortgage (P&I)
- −$551
- Tax from tax record
- −$85 /mo · $1,014/yr
- Insurance
- −$44
- Flood insurance flood zone
- −$427 /mo · $5,118/yr
- HOA
- −$0
- Vacancy / Maint / Mgmt
- −$330
- Net cashflow
- $137
Break-even live
Sensitivity live
| Price | -10% $197 | -5% $167 | +0% $137 | +5% $107 | +10% $78 |
|---|---|---|---|---|---|
| Rent | -10% $13 | -5% $75 | +0% $137 | +5% $199 | +10% $261 |
| Rate | -1.0pp $190 | -0.5pp $164 | base $137 | +0.5pp $110 | +1.0pp $82 |
UW: 25.0% down · 7.5% · 30yr · 1.5% tax · 5.0% vac · 8.0% maint · 8.0% mgmt
Financing live
Cash to close
- Down payment
- $26,250
- Closing costs
- $3,150
- Reserves months
- —
- Total cash needed
- —
Loan-product check · same deal, 3 products live
Conventional
25% down · 7.5% · 30yr
- Down + closing
- —
- Monthly P&I
- —
- Monthly cashflow
- —
- DSCR
- —
- Eligible?
- —
Personal DTI + credit; lowest rate.
DSCR
20% down · 8.5% · 30yr
- Down + closing
- —
- Monthly P&I
- —
- Monthly cashflow
- —
- DSCR
- —
- Eligible?
- —
No personal income docs; deal must DSCR.
Hard money
10% down · 12.0% · 12mo
- Down + closing
- —
- Monthly P&I
- —
- Monthly cashflow
- —
- DSCR
- —
- Eligible?
- —
Short-term bridge; refi at stabilization.
Listing history 3 events
-
2026-05-16status Pending 87-char remark
-
2026-05-05$105,000 Active 87-char remark
-
2026-05-03historical $105,000 87-char remark
ⓘ Source: listings_history table (triggers on properties + properties_extension) + one-shot
backfill from property_details.listing_events for pre-trigger history.
Tax reassessment forecast MO · Resets to sale price
- Current annual tax
- $1,014 · $85/mo
- Projected year-2 tax
- $1,018 · $85/mo
- Expected delta
- +$4/yr ($0/mo · 0.4%)
ⓘ Screening estimate from a state-policy table — verify with the county assessor before closing.
Climate risk First Street
- Flood 7/10 Severe FEMA zone AE · 98% chance over 30 yrs
- Wildfire 3/10 Moderate
- Heat 5/10 Major 7 d/yr ≥105°F today · 20 d/yr by 30 yrs out
- Wind 2/10 Low 100% chance of damaging wind over 30 yrs
- Air quality 3/10 Moderate 1 unhealthy d/yr today · 4 by 30 yrs out
Nearby sold comps map
Loading sold comps map…
Walkable amenities ~0.75 mi
Loading nearby amenities…
Taxation est. · year 1
- Rental income
- $18,875
- − Mortgage interest
- −$5,882
- − Property taxes
- −$1,014
- − Insurance
- −$5,644
- − Repairs & maintenance
- −$1,510
- − Management
- −$1,510
- − Depreciation
- −$3,055
- Taxable income
- $261
- Est. tax owed @ 24.0%
- −$63
- After-tax cash flow
- $1,583/yr
For passive investors: Depreciation is non-cash, so a rental often shows a tax loss while cash-flowing — sheltering income. Rental losses are passive: they offset passive income freely, and up to $25,000/yr can offset ordinary (W-2) income if you actively participate and your MAGI is under $100k (phasing out to $0 by $150k); unused losses carry forward. On sale, claimed depreciation is recaptured at up to 25%, and gains may owe capital-gains tax (a 1031 exchange can defer both). Figures are a year-1 estimate at your 24.0% rate — not tax advice; consult a CPA.
Schools (NCES district)
- District
- Northwest R-I
- NCES district ID
- 2922890
- Math proficiency
- 37% ▼ -9.00%
- Reading proficiency
- 43% ▼ -9.00%
- Median HH income
- $55,998
- Composite
- 35.05/100
- National rank
- #5034
- State rank
- #128 of 324 in MO
Livability — Byrnes Mill
- Score
- 58/100
- State rank
- #591
- US rank
- #20943
Category grades
Schools grade is shown separately in the Schools card above.
Census & demographics
- Population (ZIP)
- 12,589
Population outlook (Jefferson County) Hauer SSP2
- Today (2025)
- 235,088 people
- By 2030
- 238,365 · +1.4%
- By 2040
- 240,156 · +2.2%
- By 2050
- 234,651 · -0.2%
- By 2075
- 214,569 · -8.7%
- By 2100
- 179,697 · -23.6%
Race, ethnicity, and origin ACS 2023
- Neighborhood character
- Predominantly White (88%)
- Race & ethnicity
- White 88% Two or more races 10% Hispanic / Latino 3%
- Common ancestry
- Lithuanian 5% Italian 3% Portuguese 2%
- Foreign-born
- 1% · Canada
- Languages at home
- 98% English-only · Spanish 1%
Political lean MEDSL · Jefferson
- 2024 margin
- Solid R (+36.7) · D 31.0% · R 67.7% · Other 1.3%
- 2008→2024 swing
- -39.3pp toward R · 2008: 2.5pp · 2024: -36.7pp
- All cycles
- 2024: R+36.7 2020: R+33.9 2016: R+35.3 2012: R+12.7 2008: D+2.5
Not yet ingested
- Civics
- —
Market trends
- HPI YoY
- ▼ -189.81%
- Current HPI
- 209.5904
- Rent YoY
- —
- Metro
- —
- State GDP YoY
- ▲ 1.84%
- F500 in state
- 20
Industry mix (Fortune 500 HQ in MO)
| Industry | F500 HQs | Revenue |
|---|---|---|
| Healthcare | 1 | $163B |
|
||
| Insurance | 1 | $21B |
|
||
| Industrial Technology | 1 | $17B |
|
||
| Retail | 1 | $16B |
|
||
| Industrial Distribution | 1 | $10B |
|
||
| Utilities | 1 | $9B |
|
||
Price history
+0.0% since first listed3 events — show timeline
- 2026-05-16 Pending — MARIS as Distributed by MLS Grid
- 2026-05-05 Listed $105,000 MARIS as Distributed by MLS Grid
- 2026-05-03 Coming Soon $105,000 MARIS as Distributed by MLS Grid
Property tax history
+3.2%/yrLatest (2025): $1,014 · +6.1% YoY. Source: county tax records.
Cash-flow waterfall
monthlySold comps — $/sqft
last 12 mo · ≤1 miLoading sold comps…