573 Grand St Unit D802 · New York, NY
Flood risk 5/10 · Moderate
- FEMA flood zone
- X (unshaded)
- Chance of flooding over 30 yrs
- 0.49%
- Est. flood insurance / yr
- $507 – $1,088
Fire risk 1/10 · Minimal
- Est. fire insurance / yr
- $691 – $1,283
Heat risk 7/10 · Major
- Hot days now (above 99°F)
- 7 days/yr
- Hot days in 30 yrs
- 15 days/yr
Wind risk 6/10 · Moderate
- Chance of severe wind over 30 yrs
- 27.0%
Air-quality risk 4/10 · Minor
- Unhealthy air days now
- 5 days/yr
- Unhealthy air days in 30 yrs
- 7 days/yr
Risk factors via First Street. Map © Google.
Why this score? — see what drove the F grade
The composite is a weighted blend of 9 inputs, each scored 0–100. Each bar is that input's sub-score; the figure is the points it added to the 100-point composite (weight × sub-score).
- ARV discount +7.5/15.0
- Appreciation +6.8/10.0
- Schools +5.0/10.0
- Rent growth +4.4/5.0
- Livability +3.8/5.0
- Cash flow +2.9/30.0
- Condition / age +2.5/5.0
- 1% rule +2.1/10.0
- DSCR +0.0/10.0
$629,000
🖨 Deal sheet 📄 Offer letter ✓ Due diligence
Listing remarks MLS
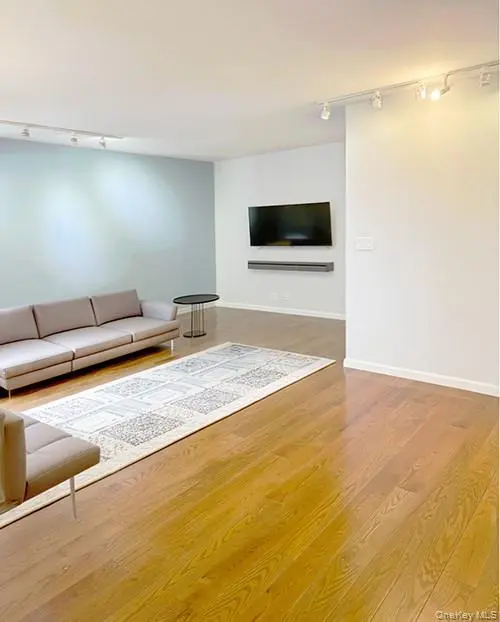
First Showing at Open House - Sunday Nov 15th. Spacious one bedroom with open views toward the Williamsburg Bridge. The bedroom has two exposures and both the kitchen and bath are windowed. The kitchen is large enough to eat-in. 5 closets. This home would benefit from updating. Very Low Maintenance. East River Coop includes parking(additional fee), state of the art fitness center, 24/7 attended lobby, 24/7 laundry, childrens play room, private outdoor playgrounds, bike room, community room for parties, storage and several acres of beautiful gardens. Public transportation includes easy access to M14A, M14D, M21 and M22 buses and F, J, M, and Z subways. Neighborhood includes the trendy new LES shops, cafes, eateries and art scene. Sorry, No dogs
Key facts
- Open views
- Quartz countertops
- Stainless appliances
Tags
Property features AI
Finance
- HOA & community: Association: East River coop
Exterior
- Parking: Has garage; No carport; No additional parking features listed
- Utilities: Public sewer; Natural gas available
- Home design: Stock cooperative; Updated/remodeled condition; Entry level: 8
- Construction: Brick construction
- Exterior features: Brick construction; Not waterfront
Interior
- Kitchen: Gas oven; Refrigerator; Stainless steel appliances
- Bedrooms: Includes a first-floor bedroom
- Flooring: Hardwood; Tile
- Bathrooms: 1 full bathroom
- Heating & cooling: Natural gas heating; Wall/window air conditioning units
- Interior features: First-floor bedroom; Eat-in kitchen; Elevator access; Entrance foyer; Kitchen island; Open floor plan; Primary bathroom; Walk-in closets; Finished basement with storage space; Total of 4 rooms
- Laundry & utility: No pets allowed
Neighborhood map
What this means for you Summary
Snapshot
- This is a 1-bed/1.0-bath condo listed at $629k.
Deal economics
- At list price, monthly cash flow is $-2k ($-25k/yr) — negative.
- To cash-flow at today's rent, offer at most $508k (19.3% below list).
- To meet the 1% rule (rent ≥ 1% of price), the offer needs to be $444k (29.4% below list).
- Recommended offer: $444k (29.4% below list) — sets the bar for 1% rule.
Location & tenants
- Location reads 75/100 on livability (#268 in NY, #4,188 nationally) — a middle-class / working-renter tenant base. Strengths: amenities A+, commute A+, health & safety A; Watch: crime F, cost of living F.
- Market conditions: Rents rising fast (+7.5%/yr); 207 active listings in the ZIP; 33 comparable units currently listed for rent nearby; rentals leasing fast (median 5d on market — plan ~1-2 weeks tenant-placement turnaround); 4,467 units permitted in New York County in 2024 (4,463 in 5+ unit buildings).
- At $4,442/mo this rent would consume 110% of the median local household income ($48k/yr) (locally 7758% of renters already pay >50% of income on rent) — very limited rent-growth headroom before tenants either downsize or default.
Forward outlook
- In year one you build about $27k of equity ($4k loan paydown + $23k appreciation (3.6% local appreciation)).
- New York County population projected at +21% by 2050 — long-run rental-demand tailwind backs the buy-and-hold thesis.
- By year 2, paydown + projected appreciation supports a ~$44k cash-out refi (75% LTV) — recoverable capital for the next deal without selling this one.
Negotiation context
- It's been on market 16 days — a 2% lower offer ($620k) is reasonable based on typical stale-listing flexibility.
- 3 sale attempts since 11y ago with the ask held roughly flat each time — persistent listings suggest the price (not the market) is what's stuck; bring a comps-based counter.
- Current owner paid $520k; 21% above their basis — modest negotiation headroom, anchor on the comps not their cost.
Risks & watch-outs
- Watch-outs: HOA is 27% of rent; built in 1955 — expect roof / HVAC / electrical / plumbing capex.
- Climate carrying-cost: moderate flood risk; major wind risk, 27% chance of damaging wind over 30y; extreme-heat days projected 7→15/yr by 2055 (HVAC capex compounding) — expect insurance premiums to compound above CPI over the hold.
Questions for the listing agent
- What do current leases actually rent for vs. the listed asking? Can we see a recent rent roll and the last 12 months of T-12 income?
- Built in 1955 — when were the roof, HVAC, electrical panel, plumbing, and water heater last replaced?
- What does the HOA fee cover, when was the last increase, and are there any pending special assessments or reserve-fund shortfalls?
- Any open or pending special assessments — roof, HVAC, plumbing, elevator, façade? What's the per-unit balance and payoff schedule, and is the seller paying it off at close or rolling it to the buyer?
- Is there a deadline driving the sale (1031 exchange, divorce, estate, relocation)? That informs how much negotiation room exists.
- Schools are B-rated — typically a magnet for longer-tenancy family renters. What's the average tenant stay here, and is there a school-zone premium baked into asking?
- Crime grade is F in this area — have there been break-ins, vandalism, or insurance claims at this property in the last 3 years? What carrier currently insures it and at what premium?
- The area grade is low — what's the realistic commute time and amenity access for the typical tenant pool here? Any planned neighborhood developments (good or bad) we should know about?
- What's the average days-on-market for RENTAL listings here right now (not sales)? A rising rental-DOM trend means longer vacancies and softer asking-rent achievability than the comps imply.
- What's the recent tenant-quality profile in this submarket — average credit score on applications, eviction rate, late-payment / NSF rate, and stable-employment percentage? A property-management company in the area should have these aggregated.
- How much new apartment / multifamily construction is in the pipeline within 1–3 miles? Heavy new supply (>2% of stock underway) typically softens rents 12–24 months out; light construction supports rent growth.
Investment metrics
- 1% rule
- 0.71% ✗
- Cap rate
- 2.37%
- Cash-on-cash
- -14.01%
- DSCR
- 0.38
- GRM
- 11.8
CMA / ARV
No comps found within radius.
Projected returns pro-forma
3.62% appreciation · 7.55% rent growth · sell at horizon
- IRR
- -1.1%
- Equity multiple
- 0.93×
- Total profit
- $-12,348
- Equity at exit
- $304,882
- IRR
- 5.0%
- Equity multiple
- 1.88×
- Total profit
- $154,443
- Equity at exit
- $487,780
Cash invested: $176,120 (down + closing). Projections, not guarantees.
Landlord ↔ Tenant lean methodology
- Overall (CITY)
- 0 Strongly Tenant-Friendly
- State New York
- 15 Strongly Tenant-Friendly · D+10
- County
- — inherits STATE
- City New York
- 0 Strongly Tenant-Friendly · D+34
ZIP-level market 10002
- Home prices YoY
- 1.2%
- Rents YoY
- 7.5%
- Active inventory
- 207
- Price-to-rent
- 11.8×
Monthly cashflow live
- Estimated rent
- $4,442 medium interval (Pro) →
- Mortgage (P&I)
- −$3,299
- Tax est. 1.5%
- −$786 /mo · $9,435/yr
- Insurance
- −$262
- HOA est. from 11 same-building comps
- −$1,218
- Vacancy / Maint / Mgmt
- −$933
- Net cashflow
- $-2,056
Break-even live
UW: 25.0% down · 7.5% · 30yr · 1.5% tax · 5.0% vac · 8.0% maint · 8.0% mgmt
Financing live
Cash to close
- Down payment
- $157,250
- Closing costs
- $18,870
- Reserves months
- —
- Total cash needed
- —
Loan-product check · same deal, 3 products live
Conventional
25% down · 7.5% · 30yr
- Down + closing
- —
- Monthly P&I
- —
- Monthly cashflow
- —
- DSCR
- —
- Eligible?
- —
Personal DTI + credit; lowest rate.
DSCR
20% down · 8.5% · 30yr
- Down + closing
- —
- Monthly P&I
- —
- Monthly cashflow
- —
- DSCR
- —
- Eligible?
- —
No personal income docs; deal must DSCR.
Hard money
10% down · 12.0% · 12mo
- Down + closing
- —
- Monthly P&I
- —
- Monthly cashflow
- —
- DSCR
- —
- Eligible?
- —
Short-term bridge; refi at stabilization.
Rent comps 33 comps
| Address | Beds | Baths | Sqft | Rent | $/sqft | DOM | Units | Dist |
|---|---|---|---|---|---|---|---|---|
| 180 Broome St #1521 New York, NY | 1.0–2.0 | 1.0–2.0 | 850 | $7,970 | $9.38 | 1d | 2 | 0.48mi |
| 125 Delancey St #1523 New York, NY | 1.0–2.0 | 1.0–2.0 | 850 | $7,860 | $9.25 | 1d | 2 | 0.59mi |
| 68 Gold St New York, NY | 1.0–2.0 | 1.0 | 700 | $3,610 | $5.16 | 24d | 2 | 0.62mi |
| 11 Wharf Way Brooklyn, NY | 1.0 | 1.0 | 610 | $4,870 | $7.98 | 1d | 2 | 0.64mi |
| 478 Kent Ave Brooklyn, NY | 2.0 | 1.0–2.0 | 775 | $5,920 | $7.64 | 2d | 3 | 0.65mi |
| 482 Kent Ave Brooklyn, NY | 2.0 | 1.0–2.0 | 750 | $6,545 | $8.73 | 2d | 3 | 0.65mi |
| 252 South St Unit 74B New York, NY | 2.0 | 2.0 | 1034 | $8,995 | $8.70 | 17d | 1 | 0.65mi |
| 171 Suffolk St #1265 New York, NY | 1.0–2.0 | 1.0 | 650 | $6,950 | $10.69 | 7d | 2 | 0.66mi |
| 184 Kent Ave Brooklyn, NY | 1.0 | 1.0 | 753 | $5,800 | $7.70 | 24d | 1 | 0.86mi |
| 160 Front St Brooklyn, NY | 1.0 | 1.0 | 597 | $5,191 | $8.70 | 2d | 2 | 0.86mi |
| 100 Jay St Unit 6B Brooklyn, NY | 1.0 | 1.0 | 800 | $4,600 | $5.75 | 24d | 1 | 0.87mi |
| 229 Chrystie St New York, NY | 1.0–2.0 | 1.0–2.0 | 810 | $6,120 | $7.56 | 4d | 3 | 0.97mi |
| 16 Spring St Unit GROUND New York, NY | — | 1.0 | 850 | $20,000 | $23.53 | 24d | 1 | 1.01mi |
| 11 E 1st St New York, NY | 2.0 | 1.0–2.0 | 1060 | $8,078 | $7.62 | 1d | 1 | 1.03mi |
| 120 Mulberry St Unit 1257050P New York, NY | 2.0 | 1.0 | 645 | $12,372 | $19.18 | 24d | 1 | 1.05mi |
| 209 1st Ave Unit 1370708P New York, NY | 1.0 | 1.0 | 602 | $12,000 | $19.93 | 24d | 1 | 1.23mi |
| 166 2nd Ave Unit 9KK New York, NY | 2.0 | 1.5 | 950 | $8,100 | $8.53 | 7d | 1 | 1.23mi |
| 107 Columbia Hts #1757 Brooklyn, NY | 1.0–2.0 | 1.0–2.0 | 708 | $5,710 | $8.06 | 1d | 2 | 1.27mi |
| 112 E 10th St Unit 1021937P New York, NY | 1.0–3.0 | 1.0–2.5 | 1296 | $5,772 | $4.45 | 3d | 2 | 1.29mi |
| 211 Front St Unit 1255364P New York, NY | 1.0 | 1.0 | 990 | $11,206 | $11.32 | 24d | 1 | 1.30mi |
| 111 Worth St New York, NY | 1.0–2.0 | 1.0–2.0 | 747 | $6,077 | $8.14 | 7d | 7 | 1.30mi |
| 343 Gold St Brooklyn, NY | 3.0 | 1.0–2.0 | 903 | $5,053 | $5.59 | 4d | 1 | 1.32mi |
| 101 E 10th St #1153 New York, NY | 1.0–2.0 | 1.0–2.0 | 575 | $6,740 | $11.72 | 1d | 2 | 1.33mi |
| 88 Leonard St New York, NY | 1.0 | 1.0 | 598 | $7,966 | $13.32 | 7d | 13 | 1.38mi |
| 105 Duane St #183 New York, NY | 2.0 | 1.0–2.0 | 821 | $9,000 | $10.96 | 1d | 3 | 1.43mi |
| 111 Lawrence St Brooklyn, NY | 3.0 | 1.0–2.0 | 950 | $4,356 | $4.58 | 1d | 24 | 1.43mi |
| 346 E 18th St Unit 1254596P New York, NY | 2.0 | 2.0 | 699 | $12,979 | $18.57 | 22d | 1 | 1.45mi |
| 180 Water St #537 New York, NY | 1.0–2.0 | 1.0–2.0 | 728 | $8,040 | $11.04 | 2d | 2 | 1.45mi |
| 196 Willoughby St Brooklyn, NY | 2.0 | 1.0–2.0 | 717 | $6,064 | $8.46 | 1d | 8 | 1.47mi |
| 200 Montague St #1516 Brooklyn, NY | 1.0 | 1.0 | 600 | $7,500 | $12.50 | 20d | 1 | 1.48mi |
| 180 Montague St Brooklyn, NY | 3.0 | 1.0–2.0 | 901 | $5,327 | $5.91 | 1d | 13 | 1.48mi |
| 100 Willoughby St Brooklyn, NY | 3.0 | 1.0–2.0 | 892 | $5,232 | $5.87 | 7d | 1 | 1.48mi |
| 214 Duffield St Brooklyn, NY | 3.0 | 1.0–2.0 | 956 | $4,347 | $4.55 | 2d | 1 | 1.49mi |
HOA detail condo
- Monthly dues
- $0 · $0/yr
- Likely covers
- landscapinggym
- Assessments
- None detected in remarks — confirm with the listing agent.
Listing history 11 events
-
2026-06-18days on market $629,000 Active 16 DOM
-
2026-06-17days on market $629,000 Active 15 DOM
-
2026-06-16days on market $629,000 Active 14 DOM
-
2026-06-15days on market $629,000 Active 13 DOM
-
2026-06-13days on market $629,000 Active 11 DOM
-
2026-06-09days on market $629,000 Active 7 DOM
-
2026-06-08days on market $629,000 Active 6 DOM
-
2026-06-08days on market $629,000 Active 5 DOM
-
2026-06-04days on market $629,000 Active 2 DOM
-
2026-06-03remarks 699-char remark
-
2026-06-03$629,000 Active 1 DOM
ⓘ Source: listings_history table (triggers on properties + properties_extension) + one-shot
backfill from property_details.listing_events for pre-trigger history.
Climate risk First Street
- Flood 5/10 Major FEMA zone X (unshaded) · 49% chance over 30 yrs
- Wildfire 1/10 Low
- Heat 7/10 Severe 7 d/yr ≥99°F today · 15 d/yr by 30 yrs out
- Wind 6/10 Major 27% chance of damaging wind over 30 yrs
- Air quality 4/10 Moderate 5 unhealthy d/yr today · 7 by 30 yrs out
Nearby sold comps map
Loading sold comps map…
Walkable amenities ~0.75 mi
Loading nearby amenities…
Taxation est. · year 1
- Rental income
- $53,302
- − Mortgage interest
- −$35,234
- − Property taxes
- −$9,435
- − Insurance
- −$3,145
- − Repairs & maintenance
- −$4,264
- − Management
- −$4,264
- − HOA
- −$14,616
- − Depreciation
- −$18,298
- Taxable loss
- −$35,954
- Est. tax savings @ 24.0%
- +$8,629
- After-tax cash flow
- $-16,041/yr
For passive investors: Depreciation is non-cash, so a rental often shows a tax loss while cash-flowing — sheltering income. Rental losses are passive: they offset passive income freely, and up to $25,000/yr can offset ordinary (W-2) income if you actively participate and your MAGI is under $100k (phasing out to $0 by $150k); unused losses carry forward. On sale, claimed depreciation is recaptured at up to 25%, and gains may owe capital-gains tax (a 1031 exchange can defer both). Figures are a year-1 estimate at your 24.0% rate — not tax advice; consult a CPA.
Schools (NCES district)
No district data.
Livability — New York
- Score
- 75/100
- State rank
- #268
- US rank
- #4188
Category grades
Schools grade is shown separately in the Schools card above.
Census & demographics
- Census place
- New York, NY
- County
- New York County · 1,599,927 people
- City population
- 7,731,280
- Metro
- New York-Newark-Jersey City, NY-NJ-PA
- Population (ZIP)
- 76,873
- Household income
- $48,386
- Rent vs Own
- Severe rent burden
- 7758.0
Population outlook (New York County) Hauer SSP2
- Today (2025)
- 1,825,725 people
- By 2030
- 1,904,611 · +4.3%
- By 2040
- 2,052,719 · +12.4%
- By 2050
- 2,206,601 · +20.9%
- By 2075
- 2,509,427 · +37.4%
- By 2100
- 2,702,933 · +48.0%
Race, ethnicity, and origin ACS 2023
- Neighborhood character
- Highly diverse neighborhood (Simpson 0.73)
- Race & ethnicity
- Asian 37% White 26% Hispanic / Latino 25% Two or more races 10% Black 9%
- Hispanic origin (detail)
- Mexican 1% Puerto Rican 15% Dominican 6%
- Common ancestry
- Scotch-Irish 2% Romanian 1% Italian 1%
- Foreign-born
- 38% · China, Canada, Vietnam
- Languages at home
- 48% English-only · Chinese 29% Spanish 16% Other Indo-European 1%
Political lean MEDSL · New York
- 2024 margin
- Solid D (+64.8) · D 82.4% · R 17.6%
- 2008→2024 swing
- -7.4pp toward R · 2008: 72.2pp · 2024: 64.8pp
- All cycles
- 2024: D+64.8 2020: D+74.5 2016: D+77.2 2012: D+69.6 2008: D+72.2
Not yet ingested
- Civics
- —
Market trends
- HPI YoY
- ▲ 3.62%
- Current HPI
- 302.3293
- Rent YoY
- ▲ 7.55%
- Metro
- New York-Newark-Jersey City, NY-NJ-PA
- State GDP YoY
- ▲ 2.60%
- F500 in state
- 92
Industry mix (Fortune 500 HQ in NY)
| Industry | F500 HQs | Revenue |
|---|---|---|
| Financial Services | 10 | $950B |
|
||
| Consumer Goods | 9 | $162B |
|
||
| Insurance | 4 | $225B |
|
||
| Telecommunications | 2 | $144B |
|
||
| Pharmaceuticals | 2 | $112B |
|
||
| Media / Entertainment | 2 | $69B |
|
||
Price history
+14.6% since first listed4 events — show timeline
- 2026-06-02 Listed $629,000 OneKey® MLS as Distributed by MLS Grid
- 2016-04-07 Sold (MLS) $520,000 RLS at REBNY
- 2015-11-02 Listed $520,000 RLS at REBNY
- 2015-11-02 Listed $549,000 RLS at REBNY
Cash-flow waterfall
monthlySold comps — $/sqft
last 12 mo · ≤1 miLoading sold comps…