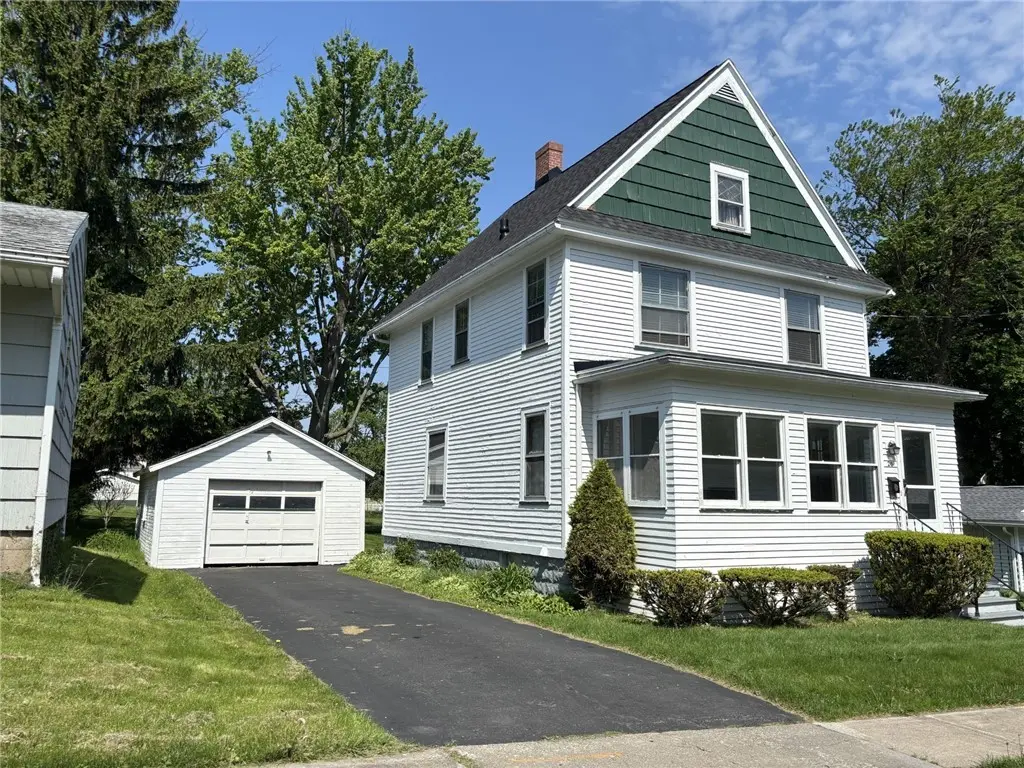
20 Oxford St · Brockport, NY
Flood risk No data
- FEMA flood zone
- —
- Chance of flooding over 30 yrs
- —
- Est. flood insurance / yr
- —
Fire risk No data
- Est. fire insurance / yr
- —
Heat risk No data
- Hot days now (above threshold)
- —
- Hot days in 30 yrs
- —
Wind risk No data
- Chance of severe wind over 30 yrs
- —
Air-quality risk No data
- Unhealthy air days now
- —
- Unhealthy air days in 30 yrs
- —
Risk factors via First Street. Map © Google.
Why this score? — see what drove the B- grade
The composite is a weighted blend of 9 inputs, each scored 0–100. Each bar is that input's sub-score; the figure is the points it added to the 100-point composite (weight × sub-score).
- Cash flow +22.5/30.0
- ARV discount +15.0/15.0
- 1% rule +7.2/10.0
- DSCR +7.2/10.0
- Schools +4.3/10.0
- Livability +3.7/5.0
- Rent growth +3.2/5.0
- Condition / age +2.5/5.0
- Appreciation +0.0/10.0
$158,900
🖨 Deal sheet 📄 Offer letter ✓ Due diligence
Listing remarks
The property features four bedrooms and one and a half bathrooms. It has a newly installed roof with a warranty, and the hot water tank is two years old. The location is desirable, offering easy access to the village and proximity to the canal, situated on a tranquil side street. Nice size backyard and access to basement from outside. Easy access is vacant. New tear off roof ust installed. DELAYED NEGOTIATIONS 5/27/2026 1 PM
Key facts
- Hot water tank
- Nice size backyard
- Proximity to canal
Tags
Property features AI
Exterior
- Parking: Detached garage with storage; Driveway; One garage space
- Utilities: Public water connected; Sewer connected; Circuit breaker electrical service; Cable available; High-speed internet available
- Home design: Two-story house; Existing (previously built) condition; Rectangular residential lot; City street frontage; Lot dimensions approximately 62 x 132
- Construction: Wood siding; Copper plumbing; Architectural shingle roof; Block foundation
- Exterior features: Blacktop driveway; Deck; Enclosed porch; Open porch; Covered porch
Interior
- Kitchen: Dishwasher; Electric oven; Electric range; Disposal; Refrigerator
- Flooring: Carpet; Hardwood; Vinyl; Varied flooring
- Bathrooms: One full bathroom; One half bathroom; One main-level bathroom
- Heating & cooling: Forced air heating; Oil heating
- Interior features: Separate/formal dining room; Separate/formal living room; Natural woodwork; Window treatments; Drapes; Storm windows; Wood window frames
- Laundry & utility: Washer; Laundry located in the basement; Electric water heater
Neighborhood map
What this means for you Summary
Snapshot
- This is a 4-bed/1.5-bath single-family listed at $159k.
Deal economics
- At list price, monthly cash flow is $269 ($3k/yr) — positive.
- The deal already cash-flows at list — no discount required.
- Meets the 1% rule at list price ($2k rent vs $159k).
- Cap rate 8.3% vs local median 5.1% in Brockport — top-decile yield for the area; either an underpriced asset or a hidden risk that comps aren't pricing in. Stress-test before assuming the spread holds.
Location & tenants
- Location reads 73/100 on livability (#313 in NY) — a middle-class / working-renter tenant base. Strengths: health & safety A+, cost of living A, housing A; Watch: employment D+, crime F, amenities F.
- Brockport Central School District (town): math 45% / reading 55% proficiency, ranked #369 of 590 in NY (top 62%) — acceptable for families but not a draw, mixed tenant base, ~2y average lease.
- Market conditions: Rents rising (+2.7%/yr); 79 active listings in the ZIP; 3 comparable units currently listed for rent nearby; rentals leasing fast (median 3d on market — plan ~1-2 weeks tenant-placement turnaround); solid renter incomes; 1,169 units permitted in Monroe County in 2024 (591 in 5+ unit buildings).
- This rent runs 31% of the median local income ($76k/yr) — at the standard rent-burdened threshold; future hikes will face affordability resistance.
Forward outlook
- Local home prices are declining (-3.0%/yr); year-one equity from $1k of loan paydown is wiped out by about $5k of value loss. Plan a longer hold.
- Monroe County population projected to shrink 6% by 2050 — rents likely to lag national; underwrite the cash flow, not the appreciation.
Negotiation context
- Only 9 days on market — expect competitive offers; lowballing is unlikely to land.
Risks & watch-outs
- Watch-outs: property tax is 2.8% of price; built in 1876 — expect roof / HVAC / electrical / plumbing capex.
Questions for the listing agent
- Built in 1876 — when were the roof, HVAC, electrical panel, plumbing, and water heater last replaced?
- Property tax is high relative to price — has the assessment been appealed recently, and will the sale trigger a re-assessment?
- Is there a deadline driving the sale (1031 exchange, divorce, estate, relocation)? That informs how much negotiation room exists.
- Schools are A-rated — typically a magnet for longer-tenancy family renters. What's the average tenant stay here, and is there a school-zone premium baked into asking?
- Crime grade is F in this area — have there been break-ins, vandalism, or insurance claims at this property in the last 3 years? What carrier currently insures it and at what premium?
- What's the average days-on-market for RENTAL listings here right now (not sales)? A rising rental-DOM trend means longer vacancies and softer asking-rent achievability than the comps imply.
- What's the recent tenant-quality profile in this submarket — average credit score on applications, eviction rate, late-payment / NSF rate, and stable-employment percentage? A property-management company in the area should have these aggregated.
- How much new for-sale + rental construction is in the pipeline within 1–3 miles? Heavy new supply typically softens prices + rents 12–24 months out; constrained supply supports both.
Investment metrics
- 1% rule
- 1.22% ✓
- Cap rate
- 8.32%
- Cash-on-cash
- 7.26%
- DSCR
- 1.32
- GRM
- 6.8
CMA / ARV
- ARV (on-the-fly)
- $224,048
- Comps found
- 12
Show comp detail 12 sales within ~0.75 mi
| Address | Dist | Beds/Ba | Sqft | Sold | Price | $/sf | Match |
|---|---|---|---|---|---|---|---|
| 57 High St | 0.15mi | 3/1.5 (-1) | 1,544 (+5%) | 1mo | $199,000 | $129 | 80 |
| 185 Lyman St | 0.36mi | 3/1.0 (-1) | 1,406 (-5%) | 4mo | $205,000 | $146 | 66 |
| 77 Barry St | 0.28mi | 3/2.0 (-1) | 1,376 (-7%) | 7mo | $210,000 | $153 | 63 |
| 38 Spring St | 0.14mi | 3/2.0 (-1) | 1,320 (-10%) | 10mo | $220,000 | $167 | 61 |
| 41 Liberty St | 0.41mi | 3/2.0 (-1) | 1,436 (-3%) | 12mo | $150,000 | $104 | 59 |
| 180 Park Ave | 0.42mi | 3/1.0 (-1) | 1,415 (-4%) | 16mo | $150,000 | $106 | 54 |
| 31 Lyman St | 0.22mi | 3/2.0 (-1) | 1,292 (-12%) | 12mo | $250,000 | $193 | 52 |
| 62 Monroe Ave | 0.51mi | 4/2.0 | 1,616 (+10%) | 9mo | $225,000 | $139 | 51 |
| 41 Clark St | 0.51mi | 4/2.0 | 1,680 (+14%) | 13mo | $133,000 | $79 | 40 |
| 26 Cloverwood Dr | 0.65mi | 3/2.0 (-1) | 1,360 (-8%) | 16mo | $230,000 | $169 | 36 |
| 11 Old Elm Dr | 0.67mi | 3/1.5 (-1) | 1,256 (-15%) | 9mo | $249,900 | $199 | 32 |
| 11 Timber Trl | 0.68mi | 3/2.0 (-1) | 1,670 (+13%) | 16mo | $254,000 | $152 | 25 |
Match score weights: distance 35% · size 25% · config 20% · recency 20%. Top-matched comps best support the ARV.
Projected returns pro-forma
-3.0% appreciation · 2.72% rent growth · sell at horizon
- IRR
- -5.5%
- Equity multiple
- 0.80×
- Total profit
- $-9,030
- Equity at exit
- $23,693
- IRR
- 3.9%
- Equity multiple
- 1.28×
- Total profit
- $12,507
- Equity at exit
- $13,739
Cash invested: $44,492 (down + closing). Projections, not guarantees.
Landlord ↔ Tenant lean methodology
- Overall (STATE)
- 15 Strongly Tenant-Friendly
- State New York
- 15 Strongly Tenant-Friendly · D+10
- County
- — inherits STATE
- City
- — inherits STATE
ZIP-level market 14420
- Home prices YoY
- -10.6%
- Rents YoY
- 2.7%
- Active inventory
- 79
- Price-to-rent
- 6.8×
Monthly cashflow live
- Estimated rent
- $1,942 medium interval (Pro) →
- Mortgage (P&I)
- −$833
- Tax from tax record
- −$365 /mo · $4,384/yr
- Insurance
- −$66
- HOA
- −$0
- Vacancy / Maint / Mgmt
- −$408
- Net cashflow
- $269
Break-even live
UW: 25.0% down · 7.5% · 30yr · 1.5% tax · 5.0% vac · 8.0% maint · 8.0% mgmt
Financing live
Cash to close
- Down payment
- $39,725
- Closing costs
- $4,767
- Reserves months
- —
- Total cash needed
- —
Loan-product check · same deal, 3 products live
Conventional
25% down · 7.5% · 30yr
- Down + closing
- —
- Monthly P&I
- —
- Monthly cashflow
- —
- DSCR
- —
- Eligible?
- —
Personal DTI + credit; lowest rate.
DSCR
20% down · 8.5% · 30yr
- Down + closing
- —
- Monthly P&I
- —
- Monthly cashflow
- —
- DSCR
- —
- Eligible?
- —
No personal income docs; deal must DSCR.
Hard money
10% down · 12.0% · 12mo
- Down + closing
- —
- Monthly P&I
- —
- Monthly cashflow
- —
- DSCR
- —
- Eligible?
- —
Short-term bridge; refi at stabilization.
Rent comps 3 comps
| Address | Beds | Baths | Sqft | Rent | $/sqft | DOM | Units | Dist |
|---|---|---|---|---|---|---|---|---|
| 138 Woodlands Way Unit 138 Brockport, NY | 3.0 | 1.5 | 1100 | $1,700 | $1.55 | 11d | 1 | 0.71mi |
| 10 Ellis Dr Brockport, NY | 3.0 | 1.0–1.5 | 756 | $1,930 | $2.55 | 2d | 1 | 0.95mi |
| 419l Holley St Brockport, NY | 1.0–3.0 | 1.0–2.5 | 850 | $1,715 | $2.02 | 1d | 15 | 1.33mi |
Listing history 1 events
-
2026-05-18$158,900 Active
ⓘ Source: listings_history table (triggers on properties + properties_extension) + one-shot
backfill from property_details.listing_events for pre-trigger history.
Tax reassessment forecast NY · Partial reset (capped growth)
- Current annual tax
- $4,384 · $365/mo
- Projected year-2 tax
- $4,384 · $365/mo
- Expected delta
- $0/yr ($0/mo · 0.0%)
ⓘ Screening estimate from a state-policy table — verify with the county assessor before closing.
Nearby sold comps map
Loading sold comps map…
Walkable amenities ~0.75 mi
Loading nearby amenities…
Taxation est. · year 1
- Rental income
- $23,298
- − Mortgage interest
- −$8,901
- − Property taxes
- −$4,384
- − Insurance
- −$794
- − Repairs & maintenance
- −$1,864
- − Management
- −$1,864
- − Depreciation
- −$4,623
- Taxable income
- $869
- Est. tax owed @ 24.0%
- −$209
- After-tax cash flow
- $3,019/yr
For passive investors: Depreciation is non-cash, so a rental often shows a tax loss while cash-flowing — sheltering income. Rental losses are passive: they offset passive income freely, and up to $25,000/yr can offset ordinary (W-2) income if you actively participate and your MAGI is under $100k (phasing out to $0 by $150k); unused losses carry forward. On sale, claimed depreciation is recaptured at up to 25%, and gains may owe capital-gains tax (a 1031 exchange can defer both). Figures are a year-1 estimate at your 24.0% rate — not tax advice; consult a CPA.
Schools (NCES district)
- District
- Brockport Central School District
- NCES district ID
- 3605580
- Math proficiency
- 45% ▼ -14.00%
- Reading proficiency
- 55% ▲ 1.00%
- Median HH income
- $55,571
- Composite
- 43.28/100
- National rank
- #3044
- State rank
- #369 of 590 in NY
Livability — Brockport
- Score
- 73/100
- State rank
- #313
- US rank
- #5216
Category grades
Schools grade is shown separately in the Schools card above.
Census & demographics
- Census place
- Brockport, NY
- County
- Monroe County · 674,131 people
- City population
- 20,375
- Metro
- Rochester, NY
- Population (ZIP)
- 20,375
- Household income
- $75,577
- Rent vs Own
- Severe rent burden
- 472.0
Population outlook (Monroe County) Hauer SSP2
- Today (2025)
- 759,460 people
- By 2030
- 757,154 · -0.3%
- By 2040
- 740,644 · -2.5%
- By 2050
- 714,443 · -5.9%
- By 2075
- 645,883 · -15.0%
- By 2100
- 547,084 · -28.0%
Race, ethnicity, and origin ACS 2023
- Neighborhood character
- Predominantly White (81%)
- Race & ethnicity
- White 81% Hispanic / Latino 7% Black 5% Two or more races 5% Asian 2%
- Hispanic origin (detail)
- Puerto Rican 3%
- Common ancestry
- Romanian 5% Lithuanian 2% Italian 2%
- Foreign-born
- 5% · Canada, China, South Korea
- Languages at home
- 90% English-only · Spanish 5% Other Indo-European 1% French/Haitian/Cajun 1%
Political lean MEDSL · Monroe
- 2024 margin
- D (+19.1) · D 59.5% · R 40.5%
- 2008→2024 swing
- +1.4pp toward D · 2008: 17.7pp · 2024: 19.1pp
- All cycles
- 2024: D+19.1 2020: D+21.0 2016: D+14.1 2012: D+17.4 2008: D+17.7
Not yet ingested
- Civics
- —
Market trends
- HPI YoY
- ▼ -31.08%
- Current HPI
- 261.3695
- Rent YoY
- ▲ 2.72%
- Metro
- Rochester, NY
- State GDP YoY
- ▲ 2.60%
- F500 in state
- 92
Industry mix (Fortune 500 HQ in NY)
| Industry | F500 HQs | Revenue |
|---|---|---|
| Financial Services | 10 | $950B |
|
||
| Consumer Goods | 9 | $162B |
|
||
| Insurance | 4 | $225B |
|
||
| Telecommunications | 2 | $144B |
|
||
| Pharmaceuticals | 2 | $112B |
|
||
| Media / Entertainment | 2 | $69B |
|
||
Price history
1 event — show timeline
- 2026-05-18 Listed $158,900 UNYREIS
Property tax history
+2.4%/yrLatest (2025): $4,384 · +98.0% YoY. Source: county tax records.
Cash-flow waterfall
monthlySold comps — $/sqft
last 12 mo · ≤1 miLoading sold comps…