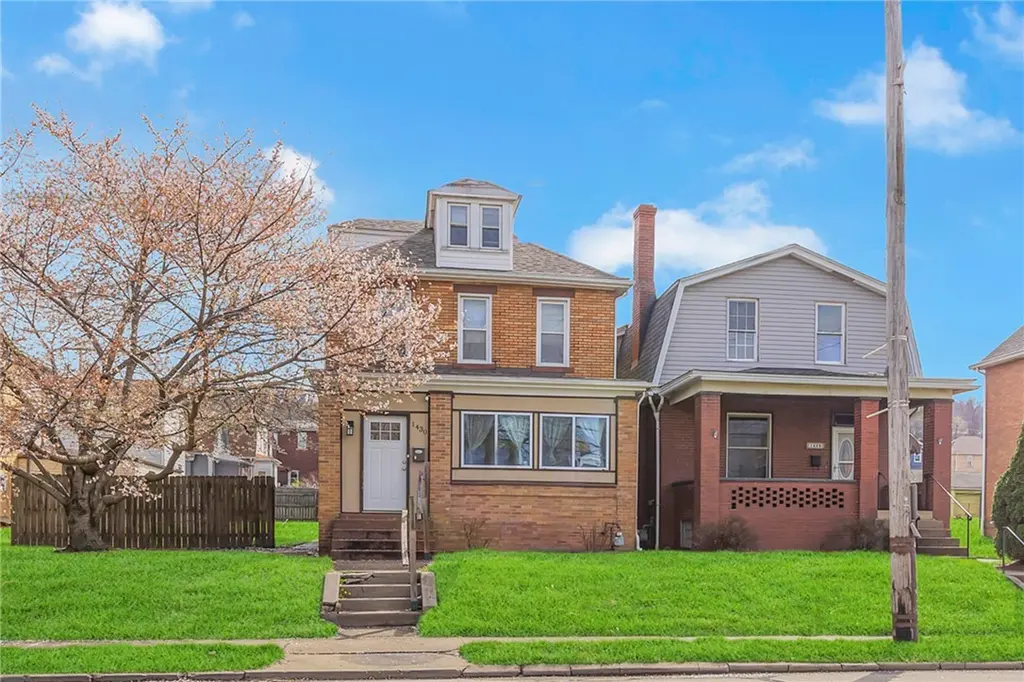
1430 Duss Ave · Ambridge, PA
Flood risk 1/10 · Minimal
- FEMA flood zone
- X (unshaded)
- Chance of flooding over 30 yrs
- 0.0%
- Est. flood insurance / yr
- $473 – $860
Fire risk 1/10 · Minimal
- Est. fire insurance / yr
- $511 – $949
Heat risk 4/10 · Minor
- Hot days now (above 97°F)
- 7 days/yr
- Hot days in 30 yrs
- 18 days/yr
Wind risk 2/10 · Minimal
- Chance of severe wind over 30 yrs
- —
Air-quality risk 3/10 · Minor
- Unhealthy air days now
- 2 days/yr
- Unhealthy air days in 30 yrs
- 3 days/yr
Risk factors via First Street. Map © Google.
Why this score? — see what drove the D grade
The composite is a weighted blend of 9 inputs, each scored 0–100. Each bar is that input's sub-score; the figure is the points it added to the 100-point composite (weight × sub-score).
- Cash flow +14.6/30.0
- ARV discount +8.6/15.0
- DSCR +4.5/10.0
- 1% rule +4.0/10.0
- Livability +3.9/5.0
- Schools +3.1/10.0
- Rent growth +2.5/5.0
- Condition / age +2.5/5.0
- Appreciation +0.0/10.0
$150,000
🖨 Deal sheet 📄 Offer letter ✓ Due diligence
Listing remarks MLS
NIce 3 bedroom, 1 bath house plus an extra room for an office or closet. Plenty of yard space and off street parking. Roof is three years old.
Key facts
- Large back porch
- Updated kitchen
- Electric fireplace
Tags
Property features AI
Finance
- HOA & community: Public transportation access
Exterior
- Parking: Off-street parking with 3 total spaces
- Utilities: Public water; Public sewer
- Home design: Brick construction; 3 stories; Resale property; Asphalt roof
- Construction: Brick exterior; Asphalt roof
- Exterior features: Off-street parking (3 spaces)
Interior
- Kitchen: Dishwasher; Microwave; Refrigerator; Stove
- Flooring: Hardwood; Tile; Vinyl
- Bathrooms: 1 full bathroom
- Heating & cooling: Gas heating; Central air conditioning
- Interior features: Walk-out basement; Fireplace
- Laundry & utility: Washer; Dryer; Some electric appliances
Neighborhood map
What this means for you Summary
Snapshot
- This is a 3-bed/1.0-bath single-family listed at $150k.
Deal economics
- At list price, monthly cash flow is $36 ($435/yr) — positive.
- The deal already cash-flows at list — no discount required.
- To meet the 1% rule (rent ≥ 1% of price), the offer needs to be $135k (9.9% below list).
- Recommended offer: $135k (9.9% below list) — sets the bar for 1% rule.
Location & tenants
- Location reads 78/100 on livability (#293 in PA, #2,594 nationally) — a middle-class / working-renter tenant base. Strengths: commute A+, cost of living A+, housing A+; Watch: schools D+, employment D+, crime F.
- Ambridge Area SD (suburban): math 23% / reading 48% proficiency, ranked #408 of 539 in PA (top 76%) — families likely to look elsewhere, expect single-tenant / working-renter base with shorter leases.
- Market conditions: 58 active listings in the ZIP; 3 comparable units currently listed for rent nearby; rentals at typical pace (median 15d on market — plan ~3-4 weeks tenant-placement turnaround); 272 units permitted in Beaver County in 2024 (80 in 5+ unit buildings).
Forward outlook
- Local home prices are declining (-3.0%/yr); year-one equity from $1k of loan paydown is wiped out by about $4k of value loss. Plan a longer hold.
- Beaver County population projected at -14% by 2050 — secular population decline; favor cash flow + early exit over multi-decade hold.
Negotiation context
- It's been on market 31 days — a 3% lower offer ($146k) is reasonable based on typical stale-listing flexibility.
- 5 sale attempts since 26y ago with the ask held roughly flat each time — persistent listings suggest the price (not the market) is what's stuck; bring a comps-based counter.
- Current owner paid $112k; 34% above their basis — modest negotiation headroom, anchor on the comps not their cost.
Risks & watch-outs
- Watch-outs: built in 1910 — expect roof / HVAC / electrical / plumbing capex.
Questions for the listing agent
- It's been on market 31 days. Have you received any prior offers? Is the seller open to a 10% concession, seller financing, or rate buy-down credit?
- Built in 1910 — when were the roof, HVAC, electrical panel, plumbing, and water heater last replaced?
- Is there a deadline driving the sale (1031 exchange, divorce, estate, relocation)? That informs how much negotiation room exists.
- Schools are D-rated, which usually means shorter tenancies and higher turnover. Who's the typical renter profile here, and what's been the actual vacancy rate?
- Crime grade is F in this area — have there been break-ins, vandalism, or insurance claims at this property in the last 3 years? What carrier currently insures it and at what premium?
- The area grade is low — what's the realistic commute time and amenity access for the typical tenant pool here? Any planned neighborhood developments (good or bad) we should know about?
- What's the average days-on-market for RENTAL listings here right now (not sales)? A rising rental-DOM trend means longer vacancies and softer asking-rent achievability than the comps imply.
- What's the recent tenant-quality profile in this submarket — average credit score on applications, eviction rate, late-payment / NSF rate, and stable-employment percentage? A property-management company in the area should have these aggregated.
- How much new for-sale + rental construction is in the pipeline within 1–3 miles? Heavy new supply typically softens prices + rents 12–24 months out; constrained supply supports both.
Investment metrics
- 1% rule
- 0.90% ✗
- Cap rate
- 6.58%
- Cash-on-cash
- 1.04%
- DSCR
- 1.05
- GRM
- 9.3
CMA / ARV
- ARV (on-the-fly)
- $153,712
- Comps found
- 12
Show comp detail 12 sales within ~0.75 mi
| Address | Dist | Beds/Ba | Sqft | Sold | Price | $/sf | Match |
|---|---|---|---|---|---|---|---|
| 1430 Duss Ave | 0.00mi | 3/1.0 | 1,478 (0%) | 1mo | $158,150 | $107 | 99 |
| 1705 N Walnut St | 0.23mi | 3/2.0 | 1,498 (+1%) | 3mo | $96,900 | $65 | 81 |
| 281 Wagner | 0.34mi | 3/1.0 | 1,424 (-4%) | 6mo | $149,900 | $105 | 73 |
| 321 12th St | 0.28mi | 3/2.0 | 1,552 (+5%) | 3mo | $132,900 | $86 | 72 |
| 279 Boyleston St | 0.29mi | 2/2.0 (-1) | 1,392 (-6%) | 4mo | $145,000 | $104 | 65 |
| 1204 Church St | 0.37mi | 3/1.5 | 1,350 (-9%) | 2mo | $229,000 | $170 | 64 |
| 836 Duss Ave | 0.49mi | 3/1.0 | 1,384 (-6%) | 3mo | $55,000 | $40 | 64 |
| 825 14th St | 0.12mi | 3/1.5 | 1,261 (-15%) | 5mo | $75,000 | $59 | 64 |
| 827 Beaver Rd | 0.51mi | 4/2.0 (+1) | 1,438 (-3%) | 10mo | $117,500 | $82 | 54 |
| 1106 Highland Ave | 0.70mi | 3/3.5 | 1,520 (+3%) | 1mo | $380,000 | $250 | 52 |
| 551 Glenwood Ave | 0.75mi | 4/1.0 (+1) | 1,490 (+1%) | 11mo | $94,000 | $63 | 50 |
| 832 Maplewood Ave | 0.58mi | 3/1.5 | 1,266 (-14%) | 4mo | $145,000 | $115 | 44 |
Match score weights: distance 35% · size 25% · config 20% · recency 20%. Top-matched comps best support the ARV.
Projected returns pro-forma
-3.0% appreciation · 3.0% rent growth · sell at horizon
- IRR
- -14.6%
- Equity multiple
- 0.48×
- Total profit
- $-21,982
- Equity at exit
- $22,365
- IRR
- -5.9%
- Equity multiple
- 0.62×
- Total profit
- $-16,101
- Equity at exit
- $12,969
Cash invested: $42,000 (down + closing). Projections, not guarantees.
Landlord ↔ Tenant lean methodology
- Overall (STATE)
- 62 Landlord-Friendly
- State Pennsylvania
- 62 Landlord-Friendly · EVEN
- County
- — inherits STATE
- City
- — inherits STATE
ZIP-level market 15003
- Home prices YoY
- -15.7%
- Active inventory
- 58
- Price-to-rent
- 9.3×
Monthly cashflow live
- Estimated rent
- $1,351 medium interval (Pro) →
- Mortgage (P&I)
- −$787
- Tax from tax record
- −$182 /mo · $2,182/yr
- Insurance
- −$62
- HOA
- −$0
- Vacancy / Maint / Mgmt
- −$284
- Net cashflow
- $36
Break-even live
UW: 25.0% down · 7.5% · 30yr · 1.5% tax · 5.0% vac · 8.0% maint · 8.0% mgmt
Financing live
Cash to close
- Down payment
- $37,500
- Closing costs
- $4,500
- Reserves months
- —
- Total cash needed
- —
Loan-product check · same deal, 3 products live
Conventional
25% down · 7.5% · 30yr
- Down + closing
- —
- Monthly P&I
- —
- Monthly cashflow
- —
- DSCR
- —
- Eligible?
- —
Personal DTI + credit; lowest rate.
DSCR
20% down · 8.5% · 30yr
- Down + closing
- —
- Monthly P&I
- —
- Monthly cashflow
- —
- DSCR
- —
- Eligible?
- —
No personal income docs; deal must DSCR.
Hard money
10% down · 12.0% · 12mo
- Down + closing
- —
- Monthly P&I
- —
- Monthly cashflow
- —
- DSCR
- —
- Eligible?
- —
Short-term bridge; refi at stabilization.
Rent comps 3 comps
| Address | Beds | Baths | Sqft | Rent | $/sqft | DOM | Units | Dist |
|---|---|---|---|---|---|---|---|---|
| 1700 Beaver Rd Ambridge, PA | 3.0 | 1.0 | 1099 | $1,495 | $1.36 | 16d | 1 | 0.19mi |
| 230 Locust St Ambridge, PA | 2.0 | 1.0 | 1205 | $1,103 | $0.92 | 14d | 1 | 1.12mi |
| 121 Locust St Ambridge, PA | 2.0–3.0 | 1.0 | 875 | $1,250 | $1.43 | 1d | 3 | 1.24mi |
Listing history 19 events
-
2026-05-05status Pending
-
2026-04-11historical Contingent
-
2026-04-04$150,000 Active
-
2025-08-19soldstatus $112,000
-
2025-07-29soldstatus $112,000 Closed 142-char remark
Show marketing remark (142 chars)
NIce 3 bedroom, 1 bath house plus an extra room for an office or closet. Plenty of yard space and off street parking. Roof is three years old.
-
2025-06-30status Pending 142-char remark
Show marketing remark (142 chars)
NIce 3 bedroom, 1 bath house plus an extra room for an office or closet. Plenty of yard space and off street parking. Roof is three years old.
-
2025-06-27$106,000 Active 142-char remark
Show marketing remark (142 chars)
NIce 3 bedroom, 1 bath house plus an extra room for an office or closet. Plenty of yard space and off street parking. Roof is three years old.
-
2018-10-11soldstatus $77,000
-
2018-10-10status Under Contract 221-char remark
Show marketing remark (221 chars)
Large 3 bedroom home in move-in condition! Updated Kitchen, laminate & ceramic tile flooring. Enclosed 21x6 front porch, plus a covered rear porch that has a great view of the level, fenced yard. Large storage shed!
-
2018-10-10soldstatus $77,000 Sold 221-char remark
Show marketing remark (221 chars)
Large 3 bedroom home in move-in condition! Updated Kitchen, laminate & ceramic tile flooring. Enclosed 21x6 front porch, plus a covered rear porch that has a great view of the level, fenced yard. Large storage shed!
-
2018-09-07historical Contingent 221-char remark
Show marketing remark (221 chars)
Large 3 bedroom home in move-in condition! Updated Kitchen, laminate & ceramic tile flooring. Enclosed 21x6 front porch, plus a covered rear porch that has a great view of the level, fenced yard. Large storage shed!
-
2018-08-29$75,000 Active 221-char remark
Show marketing remark (221 chars)
Large 3 bedroom home in move-in condition! Updated Kitchen, laminate & ceramic tile flooring. Enclosed 21x6 front porch, plus a covered rear porch that has a great view of the level, fenced yard. Large storage shed!
-
2003-05-07soldstatus $49,500
-
2003-04-21soldstatus $49,500
-
2002-11-27$49,500
-
2000-05-03soldstatus $24,850
-
2000-04-06soldstatus $24,850
-
2000-02-17$22,400
-
1989-04-20soldstatus $35,000
ⓘ Source: listings_history table (triggers on properties + properties_extension) + one-shot
backfill from property_details.listing_events for pre-trigger history.
Tax reassessment forecast PA · Partial reset (capped growth)
- Current annual tax
- $2,182 · $182/mo
- Projected year-2 tax
- $2,276 · $190/mo
- Expected delta
- +$94/yr (+$8/mo · 4.3%)
ⓘ Screening estimate from a state-policy table — verify with the county assessor before closing.
Climate risk First Street
- Flood 1/10 Low FEMA zone X (unshaded) · 0% chance over 30 yrs
- Wildfire 1/10 Low
- Heat 4/10 Moderate 7 d/yr ≥97°F today · 18 d/yr by 30 yrs out
- Wind 2/10 Low
- Air quality 3/10 Moderate 2 unhealthy d/yr today · 3 by 30 yrs out
Nearby sold comps map
Loading sold comps map…
Walkable amenities ~0.75 mi
Loading nearby amenities…
Taxation est. · year 1
- Rental income
- $16,211
- − Mortgage interest
- −$8,402
- − Property taxes
- −$2,182
- − Insurance
- −$750
- − Repairs & maintenance
- −$1,297
- − Management
- −$1,297
- − Depreciation
- −$4,364
- Taxable loss
- −$2,081
- Est. tax savings @ 24.0%
- +$499
- After-tax cash flow
- $934/yr
For passive investors: Depreciation is non-cash, so a rental often shows a tax loss while cash-flowing — sheltering income. Rental losses are passive: they offset passive income freely, and up to $25,000/yr can offset ordinary (W-2) income if you actively participate and your MAGI is under $100k (phasing out to $0 by $150k); unused losses carry forward. On sale, claimed depreciation is recaptured at up to 25%, and gains may owe capital-gains tax (a 1031 exchange can defer both). Figures are a year-1 estimate at your 24.0% rate — not tax advice; consult a CPA.
Schools (NCES district)
- District
- Ambridge Area SD
- NCES district ID
- 4202440
- Math proficiency
- 23% ▼ -12.00%
- Reading proficiency
- 48% ▼ -10.00%
- Median HH income
- $49,514
- Composite
- 30.62/100
- National rank
- #6190
- State rank
- #408 of 539 in PA
Livability — Ambridge
- Score
- 78/100
- State rank
- #293
- US rank
- #2594
Category grades
Schools grade is shown separately in the Schools card above.
Census & demographics
- Census place
- Ambridge, PA
- County
- Beaver County · 116,001 people
- City population
- 11,387
- Metro
- Pittsburgh, PA
- Population (ZIP)
- 11,387
- Household income
- $59,550
- Rent vs Own
- Severe rent burden
- 397.0
Population outlook (Beaver County) Hauer SSP2
- Today (2025)
- 164,976 people
- By 2030
- 161,449 · -2.1%
- By 2040
- 151,752 · -8.0%
- By 2050
- 141,155 · -14.4%
- By 2075
- 118,142 · -28.4%
- By 2100
- 91,740 · -44.4%
Race, ethnicity, and origin ACS 2023
- Neighborhood character
- Predominantly White (77%)
- Race & ethnicity
- White 77% Two or more races 10% Black 9% Hispanic / Latino 7%
- Hispanic origin (detail)
- Mexican 2% Puerto Rican 3%
- Common ancestry
- Romanian 7% Scotch-Irish 3% Subsaharan African 3%
- Foreign-born
- 3% · Canada
- Languages at home
- 95% English-only · Other Indo-European 2% Spanish 2% Russian/Polish/Slavic 1%
Political lean MEDSL · Beaver
- 2024 margin
- Strong R (+20.7) · D 39.2% · R 59.9%
- 2008→2024 swing
- -17.9pp toward R · 2008: -2.8pp · 2024: -20.7pp
- All cycles
- 2024: R+20.7 2020: R+17.7 2016: R+20.1 2012: R+6.6 2008: R+2.8
Not yet ingested
- Civics
- —
Market trends
- HPI YoY
- ▼ -46.42%
- Current HPI
- 249.8525
- Rent YoY
- —
- Metro
- Pittsburgh, PA
- State GDP YoY
- ▲ 1.68%
- F500 in state
- 34
Industry mix (Fortune 500 HQ in PA)
| Industry | F500 HQs | Revenue |
|---|---|---|
| Healthcare | 2 | $309B |
|
||
| Insurance | 2 | $27B |
|
||
| Telecommunications / Media | 1 | $124B |
|
||
| Industrial Distribution | 1 | $22B |
|
||
| Financial Services | 1 | $20B |
|
||
| Chemicals / Materials | 1 | $18B |
|
||
Price history
+328.6% since first listed19 events — show timeline
- 2026-05-05 Pending — West Penn MLS
- 2026-04-11 Contingent — West Penn MLS
- 2026-04-04 Listed $150,000 West Penn MLS
- 2025-08-19 Sold (Public Records) $112,000 Public Records
- 2025-07-29 Sold (MLS) $112,000 West Penn MLS
- 2025-06-30 Pending — West Penn MLS
- 2025-06-27 Listed $106,000 West Penn MLS
- 2018-10-11 Sold (Public Records) $77,000 Public Records
- 2018-10-10 Pending — West Penn MLS
- 2018-10-10 Sold (MLS) $77,000 West Penn MLS
- 2018-09-07 Contingent — West Penn MLS
- 2018-08-29 Listed $75,000 West Penn MLS
- 2003-05-07 Sold (MLS) $49,500 West Penn MLS
- 2003-04-21 Sold (Public Records) $49,500 Public Records
- 2002-11-27 Listed $49,500 West Penn MLS
- 2000-05-03 Sold (MLS) $24,850 West Penn MLS
- 2000-04-06 Sold (Public Records) $24,850 Public Records
- 2000-02-17 Listed $22,400 West Penn MLS
- 1989-04-20 Sold (Public Records) $35,000 Public Records
Property tax history
-0.6%/yrLatest (2026): $2,182 · +2.2% YoY. Source: county tax records.
Cash-flow waterfall
monthlySold comps — $/sqft
last 12 mo · ≤1 miLoading sold comps…