 Duplex
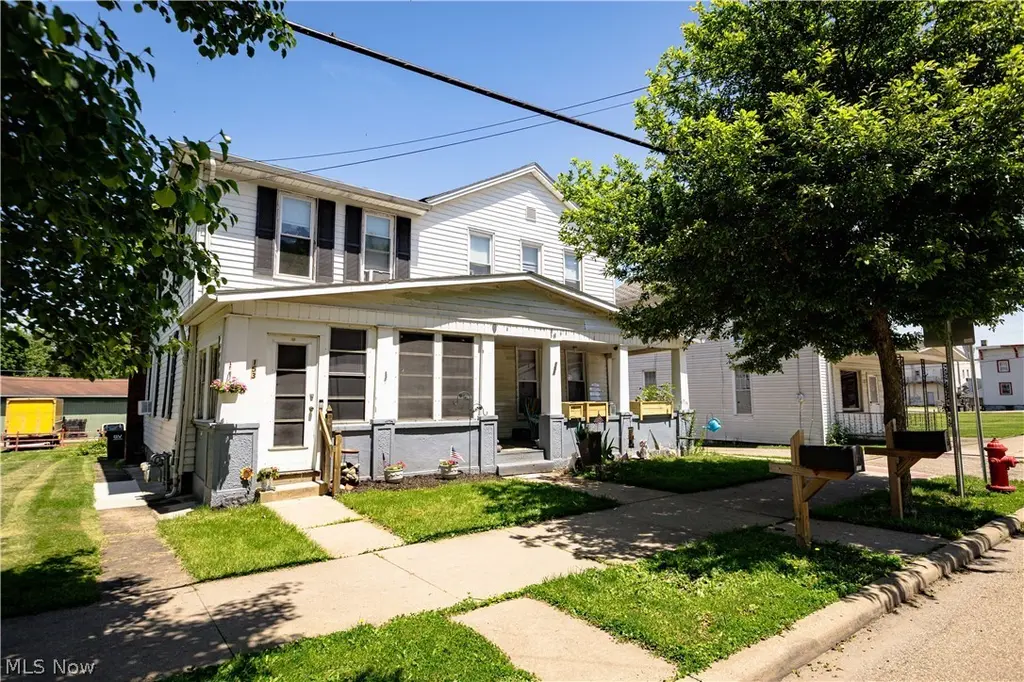
153/155 W Lisbon St · Waynesburg, OH
Flood risk 1/10 · Minimal
- FEMA flood zone
- X (unshaded)
- Chance of flooding over 30 yrs
- 0.0%
- Est. flood insurance / yr
- $473 – $860
Fire risk 1/10 · Minimal
- Est. fire insurance / yr
- $713 – $1,323
Heat risk 3/10 · Minor
- Hot days now (above 97°F)
- 7 days/yr
- Hot days in 30 yrs
- 18 days/yr
Wind risk 1/10 · Minimal
- Chance of severe wind over 30 yrs
- —
Air-quality risk 2/10 · Minimal
- Unhealthy air days now
- 0 days/yr
- Unhealthy air days in 30 yrs
- 1 days/yr
Risk factors via First Street. Map © Google.
Why this score? — see what drove the B+ grade
The composite is a weighted blend of 9 inputs, each scored 0–100. Each bar is that input's sub-score; the figure is the points it added to the 100-point composite (weight × sub-score).
- Cash flow +30.0/30.0
- DSCR +10.0/10.0
- 1% rule +9.7/10.0
- ARV discount +7.5/15.0
- Appreciation +6.7/10.0
- Schools +5.1/10.0
- Livability +3.4/5.0
- Rent growth +2.5/5.0
- Condition / age +2.5/5.0
$159,900
🖨 Deal sheet (PDF) 📄 Offer letter ✓ Due diligence
Multi-family units
County records classify this as Multi-Family (2-4 Unit). Listing-text estimate: 2 units. confirmed
Listing remarks
Attention investors!! Add this fantastic, money making, side by side duplex in the Sandy Valley Local School District to your rental portfolio. There are good, long-term tenants in place that want to stay. Each side is spacious and has approximately 1,400 sq. ft. featuring a living room, dining room, kitchen, a full bathroom and laundry area on the first floor and 3 nice sized bedrooms and another full bathroom upstairs. Each side has it's own basement access and has it's own gas, forced air furnace and hot water tank. The utilities are split with the tenants paying their own electric and gas bills. The owner pays the water/sewer/trash bill. This is a well kept property and would make for a
Key facts
- 8,881 sq ft lot
- Built 1850
- Listed 12 days
Property features AI
Finance
- Financial info: Gross rental income reported: $22,800; Owner pays sewer, water and trash collection; tenants pay electricity and gas
Exterior
- Parking: Off-street parking
- Utilities: Public water; Public sewer
- Home design: 2-story building; Aluminum siding exterior; Asphalt/fiberglass roof
- Construction: Built (year source: public records)
- Exterior features: Off-street parking
Interior
- Bathrooms: 4 full bathrooms
- Heating & cooling: Forced air heating (gas); Window air conditioning units
- Interior features: Full, unfinished basement
- Laundry & utility: In-unit laundry
Neighborhood map
What this means for you Summary
Snapshot
- This is a 2 × 3-bed/2.0-bath units multifamily listed at $160k.
Deal economics
- At list price, monthly cash flow is $870 ($10k/yr) — positive. Per door: $435/mo.
- The deal already cash-flows at list — no discount required.
- Meets the 1% rule at list price ($2k rent vs $160k).
Location & tenants
- Location reads 68/100 on livability (#559 in OH) — a middle-class / working-renter tenant base. Strengths: crime A+, cost of living A+, housing A+; Watch: schools C-, amenities F, commute F.
- Sandy Valley Local (rural): math 56% / reading 63% proficiency, ranked #296 of 656 in OH (top 45%) — acceptable for families but not a draw, mixed tenant base, ~2y average lease.
- Market conditions: 13 active listings in the ZIP; 528 units permitted in Stark County in 2024 (84 in 5+ unit buildings).
- At $2,357/mo this rent would consume 48% of the median local household income ($59k/yr) — very limited rent-growth headroom before tenants either downsize or default.
Forward outlook
- In year one you build about $7k of equity ($1k loan paydown + $6k appreciation (3.5% local appreciation)).
- Stark County population projected to shrink 8% by 2050 — rents likely to lag national; underwrite the cash flow, not the appreciation.
- At projected returns (3.5% appreciation + 3.0% rent growth), your $45k cash investment doubles in ~3 years — after that, you're playing with house money.
- By year 6, paydown + projected appreciation supports a ~$35k cash-out refi (75% LTV) — recoverable capital for the next deal without selling this one.
Negotiation context
- Only 13 days on market — expect competitive offers; lowballing is unlikely to land.
- Current owner paid $30k; list at $160k implies a 433% gain — meaningful room to come down on a strong offer.
Risks & watch-outs
- Watch-outs: built in 1850 — expect roof / HVAC / electrical / plumbing capex.
Questions for the listing agent
- Can we see the unit-by-unit rent roll, current vacancy, and any below-market leases? What's the average tenancy length?
- What capital expenditures (roof, boiler, parking lot, exteriors) have been made in the last 5 years, and what's planned in the next 2?
- Built in 1850 — when were the roof, HVAC, electrical panel, plumbing, and water heater last replaced?
- Is there a deadline driving the sale (1031 exchange, divorce, estate, relocation)? That informs how much negotiation room exists.
- What's the average days-on-market for RENTAL listings here right now (not sales)? A rising rental-DOM trend means longer vacancies and softer asking-rent achievability than the comps imply.
- What's the recent tenant-quality profile in this submarket — average credit score on applications, eviction rate, late-payment / NSF rate, and stable-employment percentage? A property-management company in the area should have these aggregated.
- How much new apartment / multifamily construction is in the pipeline within 1–3 miles? Heavy new supply (>2% of stock underway) typically softens rents 12–24 months out; light construction supports rent growth.
Investment metrics
- 1% rule
- 1.47% ✓
- Cap rate
- 12.82%
- Cash-on-cash
- 23.32%
- DSCR
- 2.04
- GRM
- 5.7
CMA / ARV
No comps found within radius.
Projected returns pro-forma
3.48% appreciation · 3.0% rent growth · sell at horizon
- IRR
- 30.4%
- Equity multiple
- 2.76×
- Total profit
- $78,723
- Equity at exit
- $76,247
- IRR
- 30.3%
- Equity multiple
- 5.41×
- Total profit
- $197,611
- Equity at exit
- $121,004
Cash invested: $44,772 (down + closing). Projections, not guarantees.
Landlord ↔ Tenant lean methodology
- Overall (STATE)
- 73 Landlord-Friendly
- State Ohio
- 73 Landlord-Friendly · R+6
- County
- — inherits STATE
- City
- — inherits STATE
ZIP-level market 44688
- Home prices YoY
- 1.4%
- Active inventory
- 13
- Price-to-rent
- 11.3×
Monthly cashflow live
- Estimated rent
- $2,357 medium interval (Pro) →
- Mortgage (P&I)
- −$839
- Tax from tax record
- −$87 /mo · $1,043/yr
- Insurance
- −$67
- HOA
- −$0
- Vacancy / Maint / Mgmt
- −$495
- Net cashflow
- $870
Break-even live
Sensitivity live
| Price | -10% $960 | -5% $915 | +0% $870 | +5% $825 | +10% $779 |
|---|---|---|---|---|---|
| Rent | -10% $684 | -5% $777 | +0% $870 | +5% $963 | +10% $1,056 |
| Rate | -1.0pp $950 | -0.5pp $911 | base $870 | +0.5pp $828 | +1.0pp $786 |
2-unit breakdown (identical units grouped — click to expand)
| Units | Beds | Baths | Est. rent |
|---|---|---|---|
| 2× units | 3 | 2 | $2,358 |
| #1 | 3 | 2 | $1,179 |
| #2 | 3 | 2 | $1,179 |
| Total (2 units) | $2,357 | ||
UW: 25.0% down · 7.5% · 30yr · 1.5% tax · 5.0% vac · 8.0% maint · 8.0% mgmt
Financing live
Cash to close
- Down payment
- $39,975
- Closing costs
- $4,797
- Reserves months
- —
- Total cash needed
- —
Loan-product check · same deal, 3 products live
Conventional
25% down · 7.5% · 30yr
- Down + closing
- —
- Monthly P&I
- —
- Monthly cashflow
- —
- DSCR
- —
- Eligible?
- —
Personal DTI + credit; lowest rate.
DSCR
20% down · 8.5% · 30yr
- Down + closing
- —
- Monthly P&I
- —
- Monthly cashflow
- —
- DSCR
- —
- Eligible?
- —
No personal income docs; deal must DSCR.
Hard money
10% down · 12.0% · 12mo
- Down + closing
- —
- Monthly P&I
- —
- Monthly cashflow
- —
- DSCR
- —
- Eligible?
- —
Short-term bridge; refi at stabilization.
Listing history 10 events
-
2026-06-16days on market $159,900 Active 13 DOM
-
2026-06-15days on market $159,900 Active 12 DOM
-
2026-06-13days on market $159,900 Active 10 DOM
-
2026-06-12days on market $159,900 Active 9 DOM
-
2026-06-09days on market $159,900 Active 6 DOM
-
2026-06-08days on market $159,900 Active 5 DOM
-
2026-06-08days on market $159,900 Active 4 DOM
-
2026-06-07days on market $159,900 Active 3 DOM
-
2026-06-04remarks 699-char remark
-
2026-06-04$159,900 Active 1 DOM
ⓘ Source: listings_history table (triggers on properties + properties_extension) + one-shot
backfill from property_details.listing_events for pre-trigger history.
Tax reassessment forecast OH · Partial reset (capped growth)
- Current annual tax
- $1,043 · $87/mo
- Projected year-2 tax
- $1,769 · $147/mo
- Expected delta
- +$726/yr (+$60/mo · 69.6%)
ⓘ Screening estimate from a state-policy table — verify with the county assessor before closing.
Climate risk First Street
- Flood 1/10 Low FEMA zone X (unshaded) · 0% chance over 30 yrs
- Wildfire 1/10 Low
- Heat 3/10 Moderate 7 d/yr ≥97°F today · 18 d/yr by 30 yrs out
- Wind 1/10 Low
- Air quality 2/10 Low 0 unhealthy d/yr today · 1 by 30 yrs out
Nearby sold comps map
Loading sold comps map…
Walkable amenities ~0.75 mi
Loading nearby amenities…
Taxation est. · year 1
- Rental income
- $28,284
- − Mortgage interest
- −$8,957
- − Property taxes
- −$1,043
- − Insurance
- −$800
- − Repairs & maintenance
- −$2,263
- − Management
- −$2,263
- − Depreciation
- −$4,652
- Taxable income
- $8,307
- Est. tax owed @ 24.0%
- −$1,994
- After-tax cash flow
- $8,445/yr
For passive investors: Depreciation is non-cash, so a rental often shows a tax loss while cash-flowing — sheltering income. Rental losses are passive: they offset passive income freely, and up to $25,000/yr can offset ordinary (W-2) income if you actively participate and your MAGI is under $100k (phasing out to $0 by $150k); unused losses carry forward. On sale, claimed depreciation is recaptured at up to 25%, and gains may owe capital-gains tax (a 1031 exchange can defer both). Figures are a year-1 estimate at your 24.0% rate — not tax advice; consult a CPA.
Schools (NCES district)
- District
- Sandy Valley Local
- NCES district ID
- 3904994
- Math proficiency
- 56% ▼ -10.00%
- Reading proficiency
- 63% ▼ -3.00%
- Median HH income
- $49,859
- Composite
- 50.62/100
- National rank
- #1842
- State rank
- #296 of 656 in OH
Livability — Waynesburg
- Score
- 68/100
- State rank
- #559
- US rank
- #9536
Category grades
Schools grade is shown separately in the Schools card above.
Census & demographics
- Census place
- Waynesburg, OH
- County
- Stark · 366,688 people
- Metro
- Canton-Massillon, OH
- Population (ZIP)
- 2,895
- Household income
- $58,936
- Rent vs Own
- Severe rent burden
- 9.6
Population outlook (Stark County) Hauer SSP2
- Today (2025)
- 373,708 people
- By 2030
- 371,245 · -0.7%
- By 2040
- 361,331 · -3.3%
- By 2050
- 345,290 · -7.6%
- By 2075
- 302,669 · -19.0%
- By 2100
- 238,870 · -36.1%
Race, ethnicity, and origin ACS 2023
- Neighborhood character
- Predominantly White (89%)
- Race & ethnicity
- White 89% Two or more races 7% Hispanic / Latino 2% Black 2%
- Common ancestry
- Italian 7% Lithuanian 3% Romanian 3%
- Foreign-born
- 0%
- Languages at home
- 98% English-only · German/W. Germanic 1% Spanish 1% Other Asian/Pacific 1%
Political lean MEDSL · Stark
- 2024 margin
- Strong R (+21.9) · D 38.6% · R 60.5%
- 2008→2024 swing
- -27.4pp toward R · 2008: 5.5pp · 2024: -21.9pp
- All cycles
- 2024: R+21.9 2020: R+18.5 2016: R+17.4 2012: R+0.4 2008: D+5.5
Not yet ingested
- Civics
- —
Market trends
- HPI YoY
- ▲ 3.48%
- Current HPI
- 258.7896
- Rent YoY
- —
- Metro
- —
- State GDP YoY
- ▲ 1.98%
- F500 in state
- 48
Industry mix (Fortune 500 HQ in OH)
| Industry | F500 HQs | Revenue |
|---|---|---|
| Insurance | 3 | $145B |
|
||
| Industrial Machinery | 3 | $49B |
|
||
| Financial Services | 3 | $24B |
|
||
| Consumer Goods | 2 | $93B |
|
||
| Aerospace / Defense | 2 | $47B |
|
||
| Utilities | 2 | $33B |
|
||
Price history
+433.0% since first listed2 events — show timeline
- 2026-06-03 Listed $159,900 MLSNOW
- 2007-04-23 Sold (Public Records) $30,000 Public Records
Property tax history
-1.4%/yrLatest (2024): $1,043 · -15.2% YoY. Source: county tax records.
Cash-flow waterfall
monthlySold comps — $/sqft
last 12 mo · ≤1 miLoading sold comps…