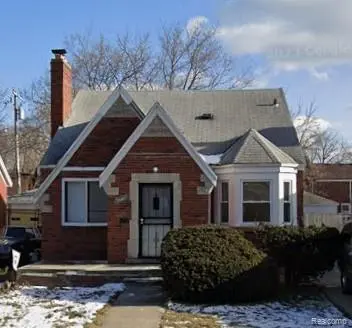
10590 Beaconsfield St · Detroit, MI
Flood risk 1/10 · Minimal
- FEMA flood zone
- X (unshaded)
- Chance of flooding over 30 yrs
- 0.0%
- Est. flood insurance / yr
- $473 – $860
Fire risk 1/10 · Minimal
- Est. fire insurance / yr
- $784 – $1,456
Heat risk 3/10 · Minor
- Hot days now (above 95°F)
- 7 days/yr
- Hot days in 30 yrs
- 15 days/yr
Wind risk 2/10 · Minimal
- Chance of severe wind over 30 yrs
- —
Air-quality risk 3/10 · Minor
- Unhealthy air days now
- 2 days/yr
- Unhealthy air days in 30 yrs
- 5 days/yr
Risk factors via First Street. Map © Google.
Why this score? — see what drove the C+ grade
The composite is a weighted blend of 9 inputs, each scored 0–100. Each bar is that input's sub-score; the figure is the points it added to the 100-point composite (weight × sub-score).
- Cash flow +27.1/30.0
- 1% rule +10.0/10.0
- DSCR +9.4/10.0
- ARV discount +7.5/15.0
- Livability +3.7/5.0
- Rent growth +2.7/5.0
- Condition / age +2.5/5.0
- Schools +1.3/10.0
- Appreciation +0.0/10.0
$89,000
🖨 Deal sheet 📄 Offer letter ✓ Due diligence
Listing remarks MLS
Turnkey Investment Opportunity – Tenant Occupied! Welcome to 10590 Beaconsfield in Detroit - a cash-flowing rental property with a reliable, long-term tenant already in place paying $1,050/month. This is the perfect addition to any investor's portfolio seeking immediate income with minimal startup effort. The property is well-maintained and professionally managed, offering a stable rental history and consistent performance. Tenant is in good standing, making this a true turnkey asset from day one. Located in an established Detroit neighborhood with strong rental demand, this property provides both steady cash flow and long-term appreciation potential. Key Highlights: Tenant occupied – performing asset $1,050/month rental income Reliable tenant in good standing Solid rental area with ongoing demand Great opportunity for new or seasoned investors Please do not disturb tenant. Showings upon accepted offer during inspection contingency
Key facts
- 4,792 sq ft lot
- Garage
- Built 1939
Property features AI
Finance
- Other: Residential property subtype: Single Family Residence
- Financial info: No investor or income/expense details provided
- HOA & community: No HOA details provided
Exterior
- Parking: Detached 1-car garage
- Security: No security details provided
- Utilities: Public water; Public sewer
- Home design: Single-family residence; Two levels; Ground-level entry with steps; Brick construction
- Construction: Brick exterior; Full unfinished basement
- Exterior features: Paved road access; Lot dimensions approximately 42 x 114 feet; Lot size about 0.11 acres; No pool
Interior
- Kitchen: No kitchen appliance details provided
- Bedrooms: 3 total rooms (includes bedrooms and living spaces)
- Flooring: No flooring details provided
- Bathrooms: 1 full bathroom
- Heating & cooling: Forced air heating; Natural gas heating; No cooling
- Interior features: Full unfinished basement
- Laundry & utility: No laundry details provided
Neighborhood map
What this means for you Summary
Snapshot
- This is a 3-bed/1.0-bath single-family listed at $89k.
Deal economics
- At list price, monthly cash flow is $253 ($3k/yr) — positive.
- The deal already cash-flows at list — no discount required.
- Meets the 1% rule at list price ($1k rent vs $89k).
- Recommended offer: $86k (3.0% below list) — sets the bar for market timing.
Location & tenants
- Location reads 73/100 on livability (#218 in MI) — a middle-class / working-renter tenant base. Strengths: amenities A+, commute A+, cost of living A+; Watch: schools F, crime F, employment F.
- Detroit Public Schools Community District (urban): math 10% / reading 24% proficiency, ranked #499 of 540 in MI (top 92%) — low school quality limits family demand, transient renter base, plan for 1-2y turnover; 90% free/reduced lunch — lower-income household profile, screen leases tightly.
- Market conditions: Rents flat; 484 active listings in the ZIP; 40 comparable units currently listed for rent nearby; rentals at typical pace (median 18d on market — plan ~3-4 weeks tenant-placement turnaround); 40% of comp listings sitting > 30 days — soft ceiling on asking rent; lower-income renter base — watch delinquency; 2,639 units permitted in Wayne County in 2024 (1,216 in 5+ unit buildings).
- This rent runs 36% of the median local income ($45k/yr) — at the standard rent-burdened threshold; future hikes will face affordability resistance.
Forward outlook
- Local home prices are declining (-3.0%/yr); year-one equity from $615 of loan paydown is wiped out by about $3k of value loss. Plan a longer hold.
- Wayne County population projected at -17% by 2050 — secular population decline; favor cash flow + early exit over multi-decade hold.
Negotiation context
- It's been on market 52 days — a 3% lower offer ($86k) is reasonable based on typical stale-listing flexibility.
- 15 sale attempts since 3y ago with the ask held roughly flat each time — persistent listings suggest the price (not the market) is what's stuck; bring a comps-based counter.
- Current owner paid $60k; 49% above their basis — modest negotiation headroom, anchor on the comps not their cost.
Risks & watch-outs
- Watch-outs: property tax is 4.0% of price; built in 1939 — expect roof / HVAC / electrical / plumbing capex.
Questions for the listing agent
- It's been on market 52 days. Have you received any prior offers? Is the seller open to a 3% concession, seller financing, or rate buy-down credit?
- Built in 1939 — when were the roof, HVAC, electrical panel, plumbing, and water heater last replaced?
- Property tax is high relative to price — has the assessment been appealed recently, and will the sale trigger a re-assessment?
- Is there a deadline driving the sale (1031 exchange, divorce, estate, relocation)? That informs how much negotiation room exists.
- Schools are F-rated, which usually means shorter tenancies and higher turnover. Who's the typical renter profile here, and what's been the actual vacancy rate?
- Crime grade is F in this area — have there been break-ins, vandalism, or insurance claims at this property in the last 3 years? What carrier currently insures it and at what premium?
- What's the average days-on-market for RENTAL listings here right now (not sales)? A rising rental-DOM trend means longer vacancies and softer asking-rent achievability than the comps imply.
- What's the recent tenant-quality profile in this submarket — average credit score on applications, eviction rate, late-payment / NSF rate, and stable-employment percentage? A property-management company in the area should have these aggregated.
- How much new for-sale + rental construction is in the pipeline within 1–3 miles? Heavy new supply typically softens prices + rents 12–24 months out; constrained supply supports both.
Investment metrics
- 1% rule
- 1.50% ✓
- Cap rate
- 9.71%
- Cash-on-cash
- 12.19%
- DSCR
- 1.54
- GRM
- 5.5
CMA / ARV
- ARV (median comp)
- $58,139
- List price
- $89,000
- Delta
- 53.08%
- Verdict
- OVERPRICED
- Comps
- 20 within 1.0 mi
Show comp detail 12 sales within ~0.75 mi
| Address | Dist | Beds/Ba | Sqft | Sold | Price | $/sf | Match |
|---|---|---|---|---|---|---|---|
| 9722 Everts St | 0.26mi | 3/1.0 | 1,178 (-1%) | 0mo | $147,000 | $125 | 86 |
| 10318 Beaconsfield St | 0.20mi | 3/1.5 | 1,146 (-4%) | 1mo | $78,000 | $68 | 82 |
| 9988 Somerset Ave | 0.34mi | 3/1.0 | 1,206 (+1%) | 1mo | $130,000 | $108 | 81 |
| 11742 Whitehill St | 0.44mi | 3/1.5 | 1,228 (+3%) | 1mo | $61,000 | $50 | 71 |
| 9817 Somerset Ave | 0.42mi | 3/1.0 | 1,290 (+8%) | 2mo | $30,000 | $23 | 64 |
| 9500 Lakepointe St | 0.63mi | 3/1.0 | 1,130 (-5%) | 0mo | $125,000 | $111 | 62 |
| 9922 Yorkshire Rd | 0.27mi | 3/2.0 | 1,342 (+13%) | 2mo | $75,000 | $56 | 60 |
| 10830 Mckinney St | 0.52mi | 3/1.0 | 1,066 (-10%) | 1mo | $40,199 | $38 | 58 |
| 10904 N Mogul St | 0.56mi | 3/1.0 | 1,045 (-12%) | 0mo | $113,000 | $108 | 54 |
| 11090 Mckinney St | 0.68mi | 3/1.5 | 1,270 (+7%) | 2mo | $154,000 | $121 | 53 |
| 10901 Worden St | 0.73mi | 3/1.5 | 1,271 (+7%) | 1mo | $43,000 | $34 | 51 |
| 5791 Bedford St | 0.71mi | 3/1.5 | 1,344 (+13%) | 1mo | $178,000 | $132 | 42 |
Match score weights: distance 35% · size 25% · config 20% · recency 20%. Top-matched comps best support the ARV.
Projected returns pro-forma
-3.0% appreciation · 0.73% rent growth · sell at horizon
- IRR
- -1.3%
- Equity multiple
- 0.95×
- Total profit
- $-1,154
- Equity at exit
- $13,270
- IRR
- 5.3%
- Equity multiple
- 1.34×
- Total profit
- $8,593
- Equity at exit
- $7,695
Cash invested: $24,920 (down + closing). Projections, not guarantees.
Landlord ↔ Tenant lean methodology
- Overall (STATE)
- 62 Landlord-Friendly
- State Michigan
- 62 Landlord-Friendly · EVEN
- County
- — inherits STATE
- City
- — inherits STATE
ZIP-level market 48224
- Rents YoY
- 0.7%
- Active inventory
- 484
- Price-to-rent
- 5.5×
Monthly cashflow live
- Estimated rent
- $1,337 high interval (Pro) →
- Mortgage (P&I)
- −$467
- Tax from tax record
- −$299 /mo · $3,591/yr
- Insurance
- −$37
- HOA
- −$0
- Vacancy / Maint / Mgmt
- −$281
- Net cashflow
- $253
Break-even live
UW: 25.0% down · 7.5% · 30yr · 1.5% tax · 5.0% vac · 8.0% maint · 8.0% mgmt
Financing live
Cash to close
- Down payment
- $22,250
- Closing costs
- $2,670
- Reserves months
- —
- Total cash needed
- —
Loan-product check · same deal, 3 products live
Conventional
25% down · 7.5% · 30yr
- Down + closing
- —
- Monthly P&I
- —
- Monthly cashflow
- —
- DSCR
- —
- Eligible?
- —
Personal DTI + credit; lowest rate.
DSCR
20% down · 8.5% · 30yr
- Down + closing
- —
- Monthly P&I
- —
- Monthly cashflow
- —
- DSCR
- —
- Eligible?
- —
No personal income docs; deal must DSCR.
Hard money
10% down · 12.0% · 12mo
- Down + closing
- —
- Monthly P&I
- —
- Monthly cashflow
- —
- DSCR
- —
- Eligible?
- —
Short-term bridge; refi at stabilization.
Rent comps 40 comps
| Address | Beds | Baths | Sqft | Rent | $/sqft | DOM | Units | Dist |
|---|---|---|---|---|---|---|---|---|
| 10803 Roxbury St Detroit, MI | 3.0 | 1.0 | 1150 | $900 | $0.78 | 20d | 1 | 0.06mi |
| 10404 Somerset Ave Detroit, MI | 3.0 | 1.0 | 1108 | $1,475 | $1.33 | 3d | 1 | 0.15mi |
| 11235 Roxbury St Detroit, MI | 3.0 | 1.0 | 1062 | $1,325 | $1.25 | 17d | 1 | 0.31mi |
| 11018 Whitehill St Detroit, MI | 3.0 | 1.0 | 1146 | $1,450 | $1.27 | 11d | 1 | 0.37mi |
| 9635 Everts St Detroit, MI | 4.0 | 2.0 | 1450 | $1,650 | $1.14 | 43d | 1 | 0.38mi |
| 10177 Boleyn St Detroit, MI | 3.0 | 1.0 | 767 | $1,250 | $1.63 | 43d | 1 | 0.40mi |
| 10037 Grayton St Detroit, MI | 3.0 | 1.0 | 1000 | $1,400 | $1.40 | 3d | 1 | 0.40mi |
| 10644 Stratman St Detroit, MI | 2.0 | 1.0 | 1000 | $1,200 | $1.20 | 17d | 1 | 0.44mi |
| 9984 Beaconsfield St Detroit, MI | 3.0 | 1.0 | 1222 | $1,575 | $1.29 | 43d | 1 | 0.45mi |
| 10813 Whitehill St Detroit, MI | 3.0 | 1.0 | 1392 | $1,350 | $0.97 | 17d | 1 | 0.47mi |
| 10400 Britain St Detroit, MI | 3.0 | 1.0 | 890 | $1,100 | $1.24 | 43d | 1 | 0.48mi |
| 10724 Whitehill St Detroit, MI | 3.0 | 3.0 | 1425 | $1,550 | $1.09 | 17d | 1 | 0.49mi |
| 11620 Rossiter St Detroit, MI | 3.0 | 1.0 | 1140 | $1,200 | $1.05 | 17d | 1 | 0.49mi |
| 10141 Roxbury St Detroit, MI | 3.0 | 1.0 | 1115 | $1,000 | $0.90 | 43d | 1 | 0.49mi |
| 11689 Wayburn St Detroit, MI | 3.0 | 1.0 | 1142 | $1,350 | $1.18 | 43d | 1 | 0.49mi |
| 10370 Britain St Detroit, MI | 3.0 | 1.0 | 1100 | $1,100 | $1.00 | 43d | 1 | 0.50mi |
| 9313 Harvard Rd Detroit, MI | 3.0 | 1.5 | 1329 | $1,200 | $0.90 | 17d | 1 | 0.51mi |
| 9927 Beaconsfield St Detroit, MI | 3.0 | 1.0 | 942 | $1,375 | $1.46 | 15d | 1 | 0.51mi |
| 9747 Somerset Ave Detroit, MI | 2.0 | 1.0 | 797 | $1,100 | $1.38 | 43d | 1 | 0.51mi |
| 11611 Morang Ave Detroit, MI | 1.0–2.0 | 1.0 | 709 | $1,040 | $1.47 | 43d | 1 | 0.52mi |
| 9241 Boleyn St Detroit, MI | 3.0 | 1.0 | 1350 | $1,350 | $1.00 | 43d | 1 | 0.52mi |
| 11911 Lansdowne St Detroit, MI | 4.0 | 1.0 | 1350 | $1,400 | $1.04 | 43d | 1 | 0.54mi |
| 11529 Roxbury St Detroit, MI | 2.0 | 1.0 | 720 | $1,200 | $1.67 | 12d | 1 | 0.56mi |
| 10692 Meuse St Detroit, MI | 3.0 | 1.0 | 955 | $1,250 | $1.31 | 12d | 1 | 0.57mi |
| 15857 Evanston St Detroit, MI | 3.0 | 1.5 | 1232 | $1,250 | $1.01 | 5d | 1 | 0.58mi |
| 11776 Rossiter St Detroit, MI | 3.0 | 1.0 | 964 | $1,150 | $1.19 | 11d | 1 | 0.62mi |
| 9409 Balfour Rd Detroit, MI | 3.0 | 1.0 | 1195 | $1,200 | $1.00 | 43d | 1 | 0.62mi |
| 9755 Wayburn St Detroit, MI | 3.0 | 2.0 | 1498 | $1,400 | $0.93 | 3d | 1 | 0.64mi |
| 9516 Wayburn St Detroit, MI | 2.0 | 1.0 | 800 | $950 | $1.19 | 17d | 1 | 0.68mi |
| 9400 Lakepointe St Detroit, MI | 3.0 | 1.0 | 1300 | $1,150 | $0.88 | 5d | 1 | 0.72mi |
| 9168 Wayburn St Detroit, MI | 3.0 | 1.0 | 1274 | $1,300 | $1.02 | 20d | 1 | 0.80mi |
| 6225 Oldtown St Detroit, MI | 3.0 | 1.0 | 1330 | $1,199 | $0.90 | 17d | 1 | 0.80mi |
| 5783 Yorkshire Rd Detroit, MI | 2.0 | 1.0 | 1040 | $1,200 | $1.15 | 43d | 1 | 0.82mi |
| 12075 Rossiter St Detroit, MI | 3.0 | 1.0 | 1100 | $1,245 | $1.13 | 43d | 1 | 0.84mi |
| 12075 Rossiter St Detroit, MI | 3.0 | 1.0 | 1100 | $1,245 | $1.13 | 15d | 1 | 0.85mi |
| 6304 Bluehill St Detroit, MI | 3.0 | 1.0 | 1088 | $1,500 | $1.38 | 43d | 1 | 0.86mi |
| 15000 Mayfield St Detroit, MI | 3.0 | 1.0 | 1146 | $970 | $0.85 | 17d | 1 | 0.88mi |
| 5574 Buckingham Ave Detroit, MI | 3.0 | 1.0 | 1430 | $1,450 | $1.01 | 4d | 1 | 0.90mi |
| 10985 Peerless St Detroit, MI | 3.0 | 1.0 | 1000 | $1,364 | $1.36 | 5d | 1 | 0.91mi |
| 15494 Mapleridge St Detroit, MI | 3.0 | 1.0 | 937 | $1,275 | $1.36 | 43d | 1 | 0.91mi |
Listing history 47 events
-
2026-06-18days on market $89,000 Active 52 DOM
-
2026-06-17days on market $89,000 Active 51 DOM
-
2026-06-15days on market $89,000 Active 49 DOM
-
2026-06-13days on market $89,000 Active 47 DOM
-
2026-06-13days on market $89,000 Active 46 DOM
-
2026-06-09days on market $89,000 Active 43 DOM
-
2026-06-08days on market $89,000 Active 42 DOM
-
2026-06-07days on market $89,000 Active 41 DOM
-
2026-06-04days on market $89,000 Active 38 DOM
-
2026-06-03days on market $89,000 Active 37 DOM
-
2026-06-02days on market $89,000 Active 36 DOM
-
2026-06-01days on market $89,000 Active 35 DOM
-
2026-05-31days on market $89,000 Active 34 DOM
-
2026-04-27$89,000 Active 972-char remark
Show marketing remark (985 chars)
Turnkey Investment Opportunity – Tenant Occupied! Welcome to 10590 Beaconsfield in Detroit - a cash-flowing rental property with a reliable, long-term tenant already in place paying $1,050/month. This is the perfect addition to any investor's portfolio seeking immediate income with minimal startup effort. The property is well-maintained and professionally managed, offering a stable rental history and consistent performance. Tenant is in good standing, making this a true turnkey asset from day one. Located in an established Detroit neighborhood with strong rental demand, this property provides both steady cash flow and long-term appreciation potential. Key Highlights: Tenant occupied – performing asset $1,050/month rental income Reliable tenant in good standing Solid rental area with ongoing demand Great opportunity for new or seasoned investors Please do not disturb tenant. Showings upon accepted offer during inspection contingency
-
2026-04-27$89,000 Active 985-char remark
Show marketing remark (985 chars)
Turnkey Investment Opportunity – Tenant Occupied! Welcome to 10590 Beaconsfield in Detroit - a cash-flowing rental property with a reliable, long-term tenant already in place paying $1,050/month. This is the perfect addition to any investor's portfolio seeking immediate income with minimal startup effort. The property is well-maintained and professionally managed, offering a stable rental history and consistent performance. Tenant is in good standing, making this a true turnkey asset from day one. Located in an established Detroit neighborhood with strong rental demand, this property provides both steady cash flow and long-term appreciation potential. Key Highlights: Tenant occupied – performing asset $1,050/month rental income Reliable tenant in good standing Solid rental area with ongoing demand Great opportunity for new or seasoned investors Please do not disturb tenant. Showings upon accepted offer during inspection contingency
-
2025-05-07historical
-
2025-05-07historical
-
2025-03-03price $77,000
-
2025-03-03price $77,000
-
2025-01-13$80,000 Active
-
2025-01-13$80,000 Active
-
2025-01-10historical
-
2025-01-09historical
-
2024-12-16historical
-
2024-12-16$65,000 Active
-
2024-12-16$65,000 Active
-
2024-12-16historical
-
2024-10-08$65,000 Active
-
2024-10-08$65,000 Active
-
2024-10-07historical
-
2024-10-07historical
-
2024-08-11$69,900 Active
-
2024-08-11$69,900 Active
-
2024-08-08historical
-
2024-08-08historical
-
2024-06-10$75,000 Active
-
2024-06-10$75,000 Active
-
2024-06-05historical
-
2024-06-05historical
-
2024-04-18price $79,000
-
2024-04-17price $79,000
-
2024-02-16$82,000 Active
-
2024-02-16$82,000 Active
-
2023-11-19historical $925
-
2023-10-11$925
-
2020-07-22soldstatus $59,900
-
1991-08-14soldstatus $31,230
ⓘ Source: listings_history table (triggers on properties + properties_extension) + one-shot
backfill from property_details.listing_events for pre-trigger history.
Tax reassessment forecast MI · Partial reset (capped growth)
- Current annual tax
- $3,591 · $299/mo
- Projected year-2 tax
- $3,591 · $299/mo
- Expected delta
- $0/yr ($0/mo · 0.0%)
ⓘ Screening estimate from a state-policy table — verify with the county assessor before closing.
Climate risk First Street
- Flood 1/10 Low FEMA zone X (unshaded) · 0% chance over 30 yrs
- Wildfire 1/10 Low
- Heat 3/10 Moderate 7 d/yr ≥95°F today · 15 d/yr by 30 yrs out
- Wind 2/10 Low
- Air quality 3/10 Moderate 2 unhealthy d/yr today · 5 by 30 yrs out
Nearby sold comps map
Loading sold comps map…
Walkable amenities ~0.75 mi
Loading nearby amenities…
Taxation est. · year 1
- Rental income
- $16,042
- − Mortgage interest
- −$4,985
- − Property taxes
- −$3,591
- − Insurance
- −$445
- − Repairs & maintenance
- −$1,283
- − Management
- −$1,283
- − Depreciation
- −$2,589
- Taxable income
- $1,865
- Est. tax owed @ 24.0%
- −$448
- After-tax cash flow
- $2,589/yr
For passive investors: Depreciation is non-cash, so a rental often shows a tax loss while cash-flowing — sheltering income. Rental losses are passive: they offset passive income freely, and up to $25,000/yr can offset ordinary (W-2) income if you actively participate and your MAGI is under $100k (phasing out to $0 by $150k); unused losses carry forward. On sale, claimed depreciation is recaptured at up to 25%, and gains may owe capital-gains tax (a 1031 exchange can defer both). Figures are a year-1 estimate at your 24.0% rate — not tax advice; consult a CPA.
Schools (NCES district)
- District
- Detroit Public Schools Community District
- NCES district ID
- 2601103
- Math proficiency
- 10% ▼ -2.00%
- Reading proficiency
- 24% ▲ 6.00%
- Median HH income
- $25,815
- Composite
- 13.06/100
- National rank
- #9564
- State rank
- #499 of 540 in MI
Livability — Detroit
- Score
- 73/100
- State rank
- #218
- US rank
- #5427
Category grades
Schools grade is shown separately in the Schools card above.
Census & demographics
- Census place
- Detroit, MI
- County
- Wayne County · 1,562,939 people
- City population
- 572,865
- Metro
- Detroit-Warren-Dearborn, MI
- Population (ZIP)
- 39,668
- Household income
- $44,856
- Rent vs Own
- Severe rent burden
- 2515.0
Population outlook (Wayne County) Hauer SSP2
- Today (2025)
- 1,675,273 people
- By 2030
- 1,620,300 · -3.3%
- By 2040
- 1,502,341 · -10.3%
- By 2050
- 1,384,039 · -17.4%
- By 2075
- 1,124,592 · -32.9%
- By 2100
- 881,193 · -47.4%
Race, ethnicity, and origin ACS 2023
- Neighborhood character
- Predominantly Black (88%)
- Race & ethnicity
- Black 88% White 8% Two or more races 3% Hispanic / Latino 1%
- Common ancestry
- Iranian 1% Romanian 1% Lithuanian 1%
- Foreign-born
- 1%
- Languages at home
- 97% English-only · Spanish 2%
Political lean MEDSL · Wayne
- 2024 margin
- Strong D (+29.0) · D 62.7% · R 33.7% · Other 3.6%
- 2008→2024 swing
- -20.5pp toward R · 2008: 49.5pp · 2024: 29.0pp
- All cycles
- 2024: D+29.0 2020: D+38.1 2016: D+37.3 2012: D+46.9 2008: D+49.5
Not yet ingested
- Civics
- —
Market trends
- HPI YoY
- ▼ -226.38%
- Current HPI
- 161.886
- Rent YoY
- ▲ 0.73%
- Metro
- Detroit-Warren-Dearborn, MI
- State GDP YoY
- ▲ 1.37%
- F500 in state
- 28
Industry mix (Fortune 500 HQ in MI)
| Industry | F500 HQs | Revenue |
|---|---|---|
| Automotive Parts | 3 | $48B |
|
||
| Automotive | 2 | $372B |
|
||
| Chemicals | 1 | $45B |
|
||
| Automotive Retail | 1 | $29B |
|
||
| Healthcare / Medical Devices | 1 | $23B |
|
||
| Automotive Technology | 1 | $20B |
|
||
Price history
+185.0% since first listed34 events — show timeline
- 2026-04-27 Listed $89,000 REALCOMP
- 2026-04-27 Listed $89,000 MiRealSource-MiMLS
- 2025-05-07 Listing Removed — MiRealSource-MiMLS
- 2025-05-07 Listing Removed — REALCOMP
- 2025-03-03 Price Changed $77,000 MiRealSource-MiMLS
- 2025-03-03 Price Changed $77,000 REALCOMP
- 2025-01-13 Listed $80,000 REALCOMP
- 2025-01-13 Listed $80,000 MiRealSource-MiMLS
- 2025-01-10 Listing Removed — REALCOMP
- 2025-01-09 Listing Removed — MiRealSource-MiMLS
- 2024-12-16 Listing Removed — MiRealSource-MiMLS
- 2024-12-16 Listed $65,000 MiRealSource-MiMLS
- 2024-12-16 Listed $65,000 REALCOMP
- 2024-12-16 Listing Removed — REALCOMP
- 2024-10-08 Listed $65,000 MiRealSource-MiMLS
- 2024-10-08 Listed $65,000 REALCOMP
- 2024-10-07 Listing Removed — MiRealSource-MiMLS
- 2024-10-07 Listing Removed — REALCOMP
- 2024-08-11 Listed $69,900 MiRealSource-MiMLS
- 2024-08-11 Listed $69,900 REALCOMP
- 2024-08-08 Listing Removed — MiRealSource-MiMLS
- 2024-08-08 Listing Removed — REALCOMP
- 2024-06-10 Listed $75,000 MiRealSource-MiMLS
- 2024-06-10 Listed $75,000 REALCOMP
- 2024-06-05 Listing Removed — MiRealSource-MiMLS
- 2024-06-05 Listing Removed — REALCOMP
- 2024-04-18 Price Changed $79,000 MiRealSource-MiMLS
- 2024-04-17 Price Changed $79,000 REALCOMP
- 2024-02-16 Listed $82,000 MiRealSource-MiMLS
- 2024-02-16 Listed $82,000 REALCOMP
- 2023-11-19 Rental Removed $925 APPFOLIO
- 2023-10-11 Listed for Rent $925 APPFOLIO
- 2020-07-22 Sold (Public Records) $59,900 Public Records
- 1991-08-14 Sold (Public Records) $31,230 Public Records
Property tax history
+3.7%/yrLatest (2025): $3,591 · +0.7% YoY. Source: county tax records.
Cash-flow waterfall
monthlySold comps — $/sqft
last 12 mo · ≤1 miLoading sold comps…