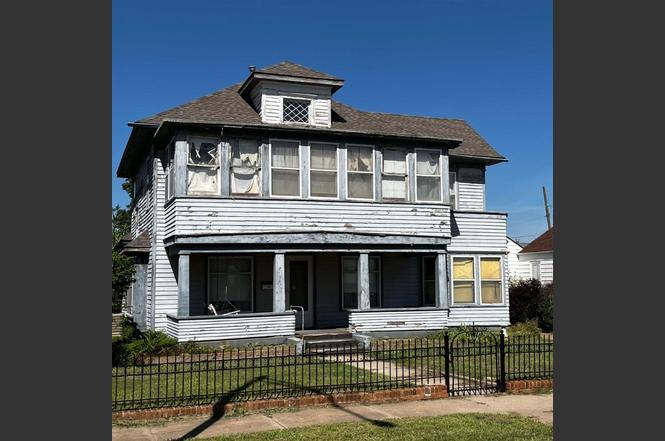
219 N Main St · Medford, OK
Flood risk 1/10 · Minimal
- FEMA flood zone
- X
- Chance of flooding over 30 yrs
- 0.0%
- Est. flood insurance / yr
- $507 – $1,088
Fire risk 2/10 · Minimal
- Est. fire insurance / yr
- $2,463 – $4,575
Heat risk 6/10 · Moderate
- Hot days now (above 109°F)
- 7 days/yr
- Hot days in 30 yrs
- 19 days/yr
Wind risk 2/10 · Minimal
- Chance of severe wind over 30 yrs
- 1.0%
Air-quality risk 2/10 · Minimal
- Unhealthy air days now
- 1 days/yr
- Unhealthy air days in 30 yrs
- 1 days/yr
Risk factors via First Street. Map © Google.
Why this score? — see what drove the B grade
The composite is a weighted blend of 9 inputs, each scored 0–100. Each bar is that input's sub-score; the figure is the points it added to the 100-point composite (weight × sub-score).
- Cash flow +30.0/30.0
- 1% rule +10.0/10.0
- DSCR +10.0/10.0
- ARV discount +7.5/15.0
- Appreciation +5.0/10.0
- Livability +3.2/5.0
- Schools +3.1/10.0
- Rent growth +2.5/5.0
- Condition / age +2.5/5.0
$45,000
🖨 Deal sheet (PDF) 📄 Offer letter ✓ Due diligence
Listing remarks
Step back in time with this stately 1910 historic home offering over 2,200 square feet of timeless character and charm. Featuring 5 bedrooms and 3 bathrooms, this spacious property showcases original hardwood floors, beautiful woodwork throughout, and architectural details. The original wrought iron fence adds striking curb appeal and highlights the home’s historic presence. The kitchen has been completely gutted and is a true blank slate — ready for your custom design and vision. Major updates provide peace of mind, including a new roof in 2024, downstairs HVAC replaced in 2025, updated plumbing and hot water heater in 2025, and new gas lines installed in 2012. If you’ve
Key facts
- Downstairs hvac
- Beautiful woodwork
- New roof
Tags
Property features AI
Exterior
- Utilities: Public water; Public sewer
- Home design: Single family residence; 2 stories; East-facing
- Exterior features: Wrought iron fencing; Composition roof
Interior
- Flooring: Hardwood; Tile
- Bathrooms: 3 full bathrooms
- Heating & cooling: Central heating (natural gas); Central air; Ceiling fans
- Interior features: Hardwood flooring; Tile flooring; Central air; Ceiling fans
Neighborhood map
What this means for you Summary
Snapshot
- This is a 4-bed/3.0-bath single-family listed at $45k.
Deal economics
- At list price, monthly cash flow is $746 ($9k/yr) — positive.
- The deal already cash-flows at list — no discount required.
- Meets the 1% rule at list price ($1k rent vs $45k).
- Recommended offer: $40k (12.0% below list) — sets the bar for market timing.
Location & tenants
- Location reads 64/100 on livability (#164 in OK) — a middle-class / working-renter tenant base. Strengths: crime A+, cost of living A+, housing B; Watch: employment D, amenities F, commute F.
- Medford (rural): math 25% / reading 40% proficiency, ranked #215 of 513 in OK (top 42%) — families likely to look elsewhere, expect single-tenant / working-renter base with shorter leases.
- Zoned schools: Medford Es (math 32% / reading 32%, grade F, #213 of 845 statewide, top 28%, 238 students, 0% FRL); Medford Hs (math 24% / reading 24%, grade F, #150 of 447 statewide, top 48%, 79 students, 0% FRL) — zoned schools average 0% FRL vs 46% district-wide (46 pts lower); this property's tenant base skews higher-income than the district average.
- Market conditions: 6 active listings in the ZIP.
Forward outlook
- In year one you build about $2k of equity ($311 loan paydown + $1k appreciation (3.0% local appreciation)).
- Grant County population projected at +4% by 2050 — modest demand growth; plan on rents tracking national, not racing it.
- At projected returns (3.0% appreciation + 3.0% rent growth), your $13k cash investment doubles in ~2 years — after that, you're playing with house money.
Negotiation context
- It's been on market 129 days — a 12% lower offer ($40k) is reasonable based on typical stale-listing flexibility.
- 3 sale attempts since 3y ago; this cycle's ask has dropped $15k (25%) from the opening price — seller is motivated, your offer sets the floor, not the list.
- Current owner paid $30k; list at $45k implies a 50% gain — meaningful room to come down on a strong offer.
Risks & watch-outs
- Watch-outs: built in 1910 — expect roof / HVAC / electrical / plumbing capex.
- Climate carrying-cost: extreme-heat days projected 7→19/yr by 2055 (HVAC capex compounding) — expect insurance premiums to compound above CPI over the hold.
Questions for the listing agent
- It's been on market 129 days. Have you received any prior offers? Is the seller open to a 12% concession, seller financing, or rate buy-down credit?
- Built in 1910 — when were the roof, HVAC, electrical panel, plumbing, and water heater last replaced?
- Why hasn't it sold? Are there any deal-killer items the seller is aware of (foundation, flood, title, zoning, code violations)?
- Is there a deadline driving the sale (1031 exchange, divorce, estate, relocation)? That informs how much negotiation room exists.
- What's the average days-on-market for RENTAL listings here right now (not sales)? A rising rental-DOM trend means longer vacancies and softer asking-rent achievability than the comps imply.
- What's the recent tenant-quality profile in this submarket — average credit score on applications, eviction rate, late-payment / NSF rate, and stable-employment percentage? A property-management company in the area should have these aggregated.
- How much new for-sale + rental construction is in the pipeline within 1–3 miles? Heavy new supply typically softens prices + rents 12–24 months out; constrained supply supports both.
Investment metrics
- 1% rule
- 2.89% ✓
- Cap rate
- 26.18%
- Cash-on-cash
- 71.03%
- DSCR
- 4.16
- GRM
- 2.9
CMA / ARV
- ARV (on-the-fly)
- $133,424
- Comps found
- 2
Show comp detail 2 sales within ~0.75 mi
| Address | Dist | Beds/Ba | Sqft | Sold | Price | $/sf | Match |
|---|---|---|---|---|---|---|---|
| 117 N 7th St | 0.42mi | 4/3.0 | 2,465 (+14%) | 7mo | $152,000 | $62 | 50 |
| 209 S 7th St | 0.47mi | 5/3.0 (+1) | 1,979 (-8%) | 18mo | $51,762 | $26 | 44 |
Match score weights: distance 35% · size 25% · config 20% · recency 20%. Top-matched comps best support the ARV.
Projected returns pro-forma
3.0% appreciation · 3.0% rent growth · sell at horizon
- IRR
- 75.6%
- Equity multiple
- 5.20×
- Total profit
- $52,925
- Equity at exit
- $20,234
- IRR
- 75.2%
- Equity multiple
- 10.67×
- Total profit
- $121,845
- Equity at exit
- $31,183
Cash invested: $12,600 (down + closing). Projections, not guarantees.
Landlord ↔ Tenant lean methodology
- Overall (STATE)
- 83 Strongly Landlord-Friendly
- State Oklahoma
- 83 Strongly Landlord-Friendly · R+20
- County
- — inherits STATE
- City
- — inherits STATE
ZIP-level market 73759
- Active inventory
- 6
- Price-to-rent
- 2.9×
Monthly cashflow live
- Estimated rent
- $1,301 medium interval (Pro) →
- Mortgage (P&I)
- −$236
- Tax from tax record
- −$28 /mo · $330/yr
- Insurance
- −$19
- HOA
- −$0
- Vacancy / Maint / Mgmt
- −$273
- Net cashflow
- $746
Break-even live
Sensitivity live
| Price | -10% $771 | -5% $759 | +0% $746 | +5% $733 | +10% $720 |
|---|---|---|---|---|---|
| Rent | -10% $643 | -5% $694 | +0% $746 | +5% $797 | +10% $849 |
| Rate | -1.0pp $768 | -0.5pp $757 | base $746 | +0.5pp $734 | +1.0pp $722 |
UW: 25.0% down · 7.5% · 30yr · 1.5% tax · 5.0% vac · 8.0% maint · 8.0% mgmt
Financing live
Cash to close
- Down payment
- $11,250
- Closing costs
- $1,350
- Reserves months
- —
- Total cash needed
- —
Loan-product check · same deal, 3 products live
Conventional
25% down · 7.5% · 30yr
- Down + closing
- —
- Monthly P&I
- —
- Monthly cashflow
- —
- DSCR
- —
- Eligible?
- —
Personal DTI + credit; lowest rate.
DSCR
20% down · 8.5% · 30yr
- Down + closing
- —
- Monthly P&I
- —
- Monthly cashflow
- —
- DSCR
- —
- Eligible?
- —
No personal income docs; deal must DSCR.
Hard money
10% down · 12.0% · 12mo
- Down + closing
- —
- Monthly P&I
- —
- Monthly cashflow
- —
- DSCR
- —
- Eligible?
- —
Short-term bridge; refi at stabilization.
Listing history 24 events
-
2026-06-21days on market $45,000 Active 129 DOM
-
2026-06-21days on market $45,000 Active 128 DOM
-
2026-06-18days on market $45,000 Active 126 DOM
-
2026-06-17days on market $45,000 Active 125 DOM
-
2026-06-16days on market $45,000 Active 124 DOM
-
2026-06-15days on market $45,000 Active 123 DOM
-
2026-06-13days on market $45,000 Active 121 DOM
-
2026-06-12days on market $45,000 Active 120 DOM
-
2026-06-09days on market $45,000 Active 117 DOM
-
2026-06-08days on market $45,000 Active 116 DOM
-
2026-06-08days on market $45,000 Active 115 DOM
-
2026-06-07pricedays on market $45,000 Active 114 DOM
-
2026-06-04days on market $50,000 Active 111 DOM
-
2026-06-02days on market $50,000 Active 110 DOM
-
2026-06-01days on market $50,000 Active 109 DOM
-
2026-05-31days on market $50,000 Active 108 DOM
-
2026-03-13price $50,000
-
2026-02-12$60,000 Active
-
2024-04-05soldstatus $30,000
-
2024-04-03soldstatus $30,000 Closed
-
2024-02-26historical Active Under Contract
-
2024-02-23status Active
-
2024-02-18historical
-
2023-08-18$33,000 Active
ⓘ Source: listings_history table (triggers on properties + properties_extension) + one-shot
backfill from property_details.listing_events for pre-trigger history.
Tax reassessment forecast OK · Resets to sale price
- Current annual tax
- $330 · $28/mo
- Projected year-2 tax
- $405 · $34/mo
- Expected delta
- +$75/yr (+$6/mo · 22.7%)
ⓘ Screening estimate from a state-policy table — verify with the county assessor before closing.
Climate risk First Street
- Flood 1/10 Low FEMA zone X · 0% chance over 30 yrs
- Wildfire 2/10 Low
- Heat 6/10 Major 7 d/yr ≥109°F today · 19 d/yr by 30 yrs out
- Wind 2/10 Low 100% chance of damaging wind over 30 yrs
- Air quality 2/10 Low 1 unhealthy d/yr today · 1 by 30 yrs out
Nearby sold comps map
Loading sold comps map…
Walkable amenities ~0.75 mi
Loading nearby amenities…
Taxation est. · year 1
- Rental income
- $15,616
- − Mortgage interest
- −$2,521
- − Property taxes
- −$330
- − Insurance
- −$225
- − Repairs & maintenance
- −$1,249
- − Management
- −$1,249
- − Depreciation
- −$1,309
- Taxable income
- $8,733
- Est. tax owed @ 24.0%
- −$2,096
- After-tax cash flow
- $6,854/yr
For passive investors: Depreciation is non-cash, so a rental often shows a tax loss while cash-flowing — sheltering income. Rental losses are passive: they offset passive income freely, and up to $25,000/yr can offset ordinary (W-2) income if you actively participate and your MAGI is under $100k (phasing out to $0 by $150k); unused losses carry forward. On sale, claimed depreciation is recaptured at up to 25%, and gains may owe capital-gains tax (a 1031 exchange can defer both). Figures are a year-1 estimate at your 24.0% rate — not tax advice; consult a CPA.
Schools (NCES district)
- District
- Medford
- NCES district ID
- 4019620
- Math proficiency
- 25% ▬ 0.00%
- Reading proficiency
- 40% ▼ -5.00%
- Median HH income
- $46,345
- Composite
- 30.63/100
- National rank
- #11449
- State rank
- #215 of 513 in OK
Livability — Medford
- Score
- 64/100
- State rank
- #164
- US rank
- #13665
Category grades
Schools grade is shown separately in the Schools card above.
Census & demographics
- Census place
- Medford, OK
- Population (ZIP)
- 1,352
Population outlook (Grant County) Hauer SSP2
- Today (2025)
- 4,375 people
- By 2030
- 4,328 · -1.1%
- By 2040
- 4,348 · -0.6%
- By 2050
- 4,536 · +3.7%
- By 2075
- 5,336 · +22.0%
- By 2100
- 5,501 · +25.7%
Race, ethnicity, and origin ACS 2023
- Neighborhood character
- Predominantly White (84%)
- Race & ethnicity
- White 84% Two or more races 6% Black 5% Hispanic / Latino 5% Native American 3%
- Common ancestry
- Italian 1% Scotch-Irish 1% Scottish 1%
- Foreign-born
- 0%
- Languages at home
- 94% English-only · German/W. Germanic 5% Spanish 1%
Political lean MEDSL · Grant
- 2024 margin
- Solid R (+70.5) · D 13.9% · R 84.4% · Other 1.7%
- 2008→2024 swing
- -14.3pp toward R · 2008: -56.3pp · 2024: -70.5pp
- All cycles
- 2024: R+70.5 2020: R+73.5 2016: R+70.0 2012: R+62.0 2008: R+56.3
Not yet ingested
- Civics
- —
Market trends
- HPI YoY
- —
- Current HPI
- —
- Rent YoY
- —
- Metro
- —
- State GDP YoY
- ▲ 1.55%
- F500 in state
- 6
Industry mix (Fortune 500 HQ in OK)
| Industry | F500 HQs | Revenue |
|---|---|---|
| Energy | 3 | $48B |
|
||
Price history
+51.5% since first listed8 events — show timeline
- 2026-03-13 Price Changed $50,000 NWOAR
- 2026-02-12 Listed $60,000 NWOAR
- 2024-04-05 Sold (Public Records) $30,000 Public Records
- 2024-04-03 Sold (MLS) $30,000 NWOAR
- 2024-02-26 Contingent — NWOAR
- 2024-02-23 Relisted — NWOAR
- 2024-02-18 Delisted — NWOAR
- 2023-08-18 Listed $33,000 NWOAR
Property tax history
+3.2%/yrLatest (2025): $330 · -10.8% YoY. Source: county tax records.
Cash-flow waterfall
monthlySold comps — $/sqft
last 12 mo · ≤1 miLoading sold comps…