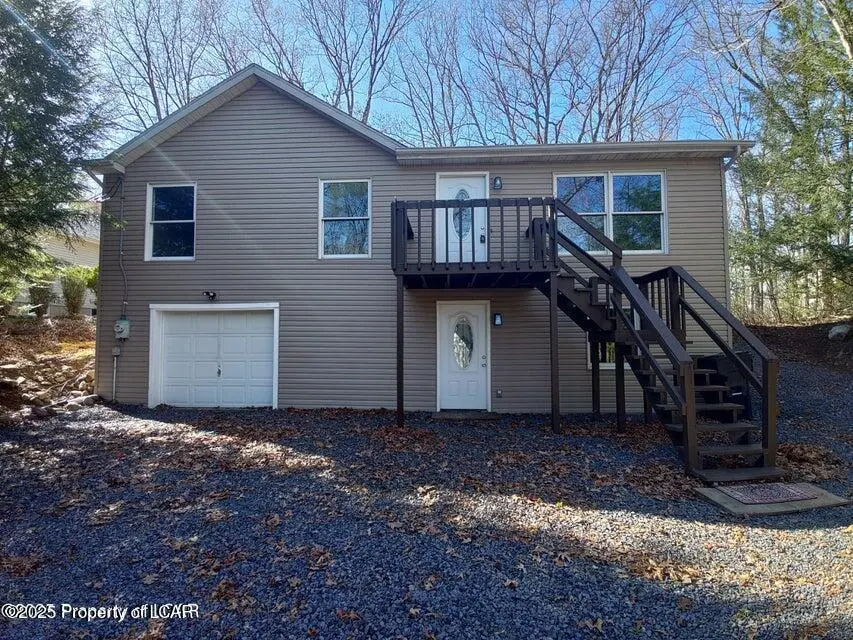
115 Debbie Dr · Beech Mountain Lakes, PA
Flood risk 1/10 · Minimal
- FEMA flood zone
- X (unshaded)
- Chance of flooding over 30 yrs
- 0.0%
- Est. flood insurance / yr
- $507 – $1,088
Fire risk 3/10 · Minor
- Est. fire insurance / yr
- $511 – $949
Heat risk 3/10 · Minor
- Hot days now (above 91°F)
- 8 days/yr
- Hot days in 30 yrs
- 18 days/yr
Wind risk 3/10 · Minor
- Chance of severe wind over 30 yrs
- 6.0%
Air-quality risk 2/10 · Minimal
- Unhealthy air days now
- 1 days/yr
- Unhealthy air days in 30 yrs
- 2 days/yr
Risk factors via First Street. Map © Google.
Why this score? — see what drove the D+ grade
The composite is a weighted blend of 9 inputs, each scored 0–100. Each bar is that input's sub-score; the figure is the points it added to the 100-point composite (weight × sub-score).
- Cash flow +11.7/30.0
- Appreciation +10.0/10.0
- ARV discount +7.6/15.0
- Livability +3.6/5.0
- 1% rule +3.4/10.0
- DSCR +3.4/10.0
- Rent growth +2.5/5.0
- Condition / age +2.5/5.0
- Schools +2.0/10.0
$249,000
🖨 Deal sheet 📄 Offer letter ✓ Due diligence
Listing remarks MLS
Beautiful, Private and Upgraded Single Home in Beech Mountain Development. 4 bedrooms, 1.5 Bath, New Kitchen with Granite and SS Appliances, New Flooring Throughout, Marble Tile Main Bathroom with Modern Fixtures. Attached Garage, 2 Decks and Great Outdoor Space Front and Rear. PLUS, Private Lake Access, Restaurant and All That Beech Mountain Has to Offer. Call Today!!!
Key facts
- New kitchen
- New flooring
- Ss appliances
Tags
Neighborhood map
What this means for you Summary
Snapshot
- This is a 4-bed/1.5-bath single-family listed at $249k.
Deal economics
- At list price, monthly cash flow is $-74 ($-887/yr) — negative.
- To cash-flow at today's rent, offer at most $236k (5.2% below list).
- To meet the 1% rule (rent ≥ 1% of price), the offer needs to be $208k (16.3% below list).
- Recommended offer: $208k (16.3% below list) — sets the bar for 1% rule.
- Cap rate 5.9% vs local median 3.7% in Beech Mountain Lakes — top-decile yield for the area; either an underpriced asset or a hidden risk that comps aren't pricing in. Stress-test before assuming the spread holds.
Location & tenants
- Location reads 71/100 on livability (#698 in PA) — a middle-class / working-renter tenant base. Strengths: crime A+, employment A+, cost of living A+; Watch: schools D+, amenities F, commute F.
- Hazleton Area SD (suburban): math 18% / reading 30% proficiency, ranked #476 of 539 in PA (top 88%) — low school quality limits family demand, transient renter base, plan for 1-2y turnover.
- Market conditions: 134 active listings in the ZIP; 349 units permitted in Luzerne County in 2024 (16 in 5+ unit buildings).
Forward outlook
- In year one you build about $27k of equity ($2k loan paydown + $25k appreciation (10.0% local appreciation)).
- Luzerne County population projected at +4% by 2050 — modest demand growth; plan on rents tracking national, not racing it.
- At projected returns (10.0% appreciation + 3.0% rent growth), your $70k cash investment doubles in ~3 years — after that, you're playing with house money.
- By year 2, paydown + projected appreciation supports a ~$43k cash-out refi (75% LTV) — recoverable capital for the next deal without selling this one.
Negotiation context
- It's been on market 261 days — a 12% lower offer ($219k) is reasonable based on typical stale-listing flexibility.
- 4 sale attempts since 10y ago with the ask held roughly flat each time — persistent listings suggest the price (not the market) is what's stuck; bring a comps-based counter.
- Current owner paid $62k; list at $249k implies a 298% gain — meaningful room to come down on a strong offer.
Questions for the listing agent
- What do current leases actually rent for vs. the listed asking? Can we see a recent rent roll and the last 12 months of T-12 income?
- It's been on market 261 days. Have you received any prior offers? Is the seller open to a 16% concession, seller financing, or rate buy-down credit?
- What does the HOA fee cover, when was the last increase, and are there any pending special assessments or reserve-fund shortfalls?
- Why hasn't it sold? Are there any deal-killer items the seller is aware of (foundation, flood, title, zoning, code violations)?
- Is there a deadline driving the sale (1031 exchange, divorce, estate, relocation)? That informs how much negotiation room exists.
- Schools are D-rated, which usually means shorter tenancies and higher turnover. Who's the typical renter profile here, and what's been the actual vacancy rate?
- The area grade is low — what's the realistic commute time and amenity access for the typical tenant pool here? Any planned neighborhood developments (good or bad) we should know about?
- What's the average days-on-market for RENTAL listings here right now (not sales)? A rising rental-DOM trend means longer vacancies and softer asking-rent achievability than the comps imply.
- What's the recent tenant-quality profile in this submarket — average credit score on applications, eviction rate, late-payment / NSF rate, and stable-employment percentage? A property-management company in the area should have these aggregated.
- How much new for-sale + rental construction is in the pipeline within 1–3 miles? Heavy new supply typically softens prices + rents 12–24 months out; constrained supply supports both.
Investment metrics
- 1% rule
- 0.84% ✗
- Cap rate
- 5.94%
- Cash-on-cash
- -1.27%
- DSCR
- 0.94
- GRM
- 10.0
CMA / ARV
- ARV (median comp)
- $249,488
- List price
- $249,000
- Delta
- -0.20%
- Verdict
- FAIR
- Comps
- 20 within 1.0 mi
Projected returns pro-forma
10.0% appreciation · 3.0% rent growth · sell at horizon
- IRR
- 23.4%
- Equity multiple
- 2.88×
- Total profit
- $130,933
- Equity at exit
- $224,319
- IRR
- 20.8%
- Equity multiple
- 6.58×
- Total profit
- $389,344
- Equity at exit
- $483,752
Cash invested: $69,720 (down + closing). Projections, not guarantees.
Landlord ↔ Tenant lean methodology
- Overall (STATE)
- 62 Landlord-Friendly
- State Pennsylvania
- 62 Landlord-Friendly · EVEN
- County
- — inherits STATE
- City
- — inherits STATE
ZIP-level market 18222
- Home prices YoY
- 10.2%
- Active inventory
- 134
- Price-to-rent
- 10.0×
Monthly cashflow live
- Estimated rent
- $2,085 medium interval (Pro) →
- Mortgage (P&I)
- −$1,306
- Tax from tax record
- −$211 /mo · $2,538/yr
- Insurance
- −$104
- HOA
- −$100
- Vacancy / Maint / Mgmt
- −$438
- Net cashflow
- $-74
Break-even live
UW: 25.0% down · 7.5% · 30yr · 1.5% tax · 5.0% vac · 8.0% maint · 8.0% mgmt
Financing live
Cash to close
- Down payment
- $62,250
- Closing costs
- $7,470
- Reserves months
- —
- Total cash needed
- —
Loan-product check · same deal, 3 products live
Conventional
25% down · 7.5% · 30yr
- Down + closing
- —
- Monthly P&I
- —
- Monthly cashflow
- —
- DSCR
- —
- Eligible?
- —
Personal DTI + credit; lowest rate.
DSCR
20% down · 8.5% · 30yr
- Down + closing
- —
- Monthly P&I
- —
- Monthly cashflow
- —
- DSCR
- —
- Eligible?
- —
No personal income docs; deal must DSCR.
Hard money
10% down · 12.0% · 12mo
- Down + closing
- —
- Monthly P&I
- —
- Monthly cashflow
- —
- DSCR
- —
- Eligible?
- —
Short-term bridge; refi at stabilization.
HOA detail
- Monthly dues
- $100 · $1,200/yr
Listing history 26 events
-
2026-06-19days on market $249,000 Active 261 DOM
-
2026-06-18days on market $249,000 Active 260 DOM
-
2026-06-17days on market $249,000 Active 259 DOM
-
2026-06-16days on market $249,000 Active 258 DOM
-
2026-06-15days on market $249,000 Active 257 DOM
-
2026-06-14days on market $249,000 Active 255 DOM
-
2026-06-12days on market $249,000 Active 254 DOM
-
2026-06-09days on market $249,000 Active 251 DOM
-
2026-06-08days on market $249,000 Active 250 DOM
-
2026-06-07days on market $249,000 Active 249 DOM
-
2026-06-02days on market $249,000 Active 244 DOM
-
2026-06-01days on market $249,000 Active 243 DOM
-
2026-05-31days on market $249,000 Active 242 DOM
-
2026-05-30days on market $249,000 Active 241 DOM
-
2026-04-09price $249,000 372-char remark
Show marketing remark (372 chars)
Beautiful, Private and Upgraded Single Home in Beech Mountain Development. 4 bedrooms, 1.5 Bath, New Kitchen with Granite and SS Appliances, New Flooring Throughout, Marble Tile Main Bathroom with Modern Fixtures. Attached Garage, 2 Decks and Great Outdoor Space Front and Rear. PLUS, Private Lake Access, Restaurant and All That Beech Mountain Has to Offer. Call Today!!!
-
2025-10-01$259,000 Active 372-char remark
Show marketing remark (372 chars)
Beautiful, Private and Upgraded Single Home in Beech Mountain Development. 4 bedrooms, 1.5 Bath, New Kitchen with Granite and SS Appliances, New Flooring Throughout, Marble Tile Main Bathroom with Modern Fixtures. Attached Garage, 2 Decks and Great Outdoor Space Front and Rear. PLUS, Private Lake Access, Restaurant and All That Beech Mountain Has to Offer. Call Today!!!
-
2025-08-12price $259,000
-
2025-06-21price $269,000
-
2025-04-09price $279,000
-
2020-06-26soldstatus $62,500
-
2020-05-18$39,900
-
2019-12-18$50,000
-
2016-09-21soldstatus $120,000
-
2016-09-20soldstatus $120,000
-
2016-07-06$119,900
-
2007-09-11soldstatus $117,500
ⓘ Source: listings_history table (triggers on properties + properties_extension) + one-shot
backfill from property_details.listing_events for pre-trigger history.
Tax reassessment forecast PA · Partial reset (capped growth)
- Current annual tax
- $2,538 · $211/mo
- Projected year-2 tax
- $3,236 · $270/mo
- Expected delta
- +$698/yr (+$58/mo · 27.5%)
ⓘ Screening estimate from a state-policy table — verify with the county assessor before closing.
Climate risk First Street
- Flood 1/10 Low FEMA zone X (unshaded) · 0% chance over 30 yrs
- Wildfire 3/10 Moderate
- Heat 3/10 Moderate 8 d/yr ≥91°F today · 18 d/yr by 30 yrs out
- Wind 3/10 Moderate 6% chance of damaging wind over 30 yrs
- Air quality 2/10 Low 1 unhealthy d/yr today · 2 by 30 yrs out
Nearby sold comps map
Loading sold comps map…
Walkable amenities ~0.75 mi
Loading nearby amenities…
Taxation est. · year 1
- Rental income
- $25,019
- − Mortgage interest
- −$13,948
- − Property taxes
- −$2,538
- − Insurance
- −$1,245
- − Repairs & maintenance
- −$2,001
- − Management
- −$2,001
- − HOA
- −$1,200
- − Depreciation
- −$7,244
- Taxable loss
- −$5,159
- Est. tax savings @ 24.0%
- +$1,238
- After-tax cash flow
- $351/yr
For passive investors: Depreciation is non-cash, so a rental often shows a tax loss while cash-flowing — sheltering income. Rental losses are passive: they offset passive income freely, and up to $25,000/yr can offset ordinary (W-2) income if you actively participate and your MAGI is under $100k (phasing out to $0 by $150k); unused losses carry forward. On sale, claimed depreciation is recaptured at up to 25%, and gains may owe capital-gains tax (a 1031 exchange can defer both). Figures are a year-1 estimate at your 24.0% rate — not tax advice; consult a CPA.
Schools (NCES district)
- District
- Hazleton Area SD
- NCES district ID
- 4211700
- Math proficiency
- 18% ▼ -3.00%
- Reading proficiency
- 30% ▼ -15.00%
- Median HH income
- $42,247
- Composite
- 20.44/100
- National rank
- #8582
- State rank
- #476 of 539 in PA
Livability — Beech Mountain Lakes
- Score
- 71/100
- State rank
- #698
- US rank
- #6837
Category grades
Schools grade is shown separately in the Schools card above.
Census & demographics
- Census place
- Beech Mountain Lakes, PA
- Population (ZIP)
- 9,946
Population outlook (Luzerne County) Hauer SSP2
- Today (2025)
- 319,505 people
- By 2030
- 319,943 · +0.1%
- By 2040
- 322,643 · +1.0%
- By 2050
- 330,817 · +3.5%
- By 2075
- 379,145 · +18.7%
- By 2100
- 431,908 · +35.2%
Race, ethnicity, and origin ACS 2023
- Neighborhood character
- Predominantly White (86%)
- Race & ethnicity
- White 86% Hispanic / Latino 7% Two or more races 7% Black 2%
- Hispanic origin (detail)
- Puerto Rican 2% Dominican 4%
- Common ancestry
- Romanian 10% Scotch-Irish 2% Iranian 2%
- Foreign-born
- 2% · Canada
- Languages at home
- 94% English-only · Spanish 3% Other Indo-European 1% Arabic 1%
Political lean MEDSL · Luzerne
- 2024 margin
- R (+19.2) · D 40.0% · R 59.2%
- 2008→2024 swing
- -27.6pp toward R · 2008: 8.4pp · 2024: -19.2pp
- All cycles
- 2024: R+19.2 2020: R+14.4 2016: R+19.6 2012: D+4.8 2008: D+8.4
Not yet ingested
- Civics
- —
Market trends
- HPI YoY
- ▲ 28.01%
- Current HPI
- 302.4923
- Rent YoY
- —
- Metro
- —
- State GDP YoY
- ▲ 1.68%
- F500 in state
- 34
Industry mix (Fortune 500 HQ in PA)
| Industry | F500 HQs | Revenue |
|---|---|---|
| Healthcare | 2 | $309B |
|
||
| Insurance | 2 | $27B |
|
||
| Telecommunications / Media | 1 | $124B |
|
||
| Industrial Distribution | 1 | $22B |
|
||
| Financial Services | 1 | $20B |
|
||
| Chemicals / Materials | 1 | $18B |
|
||
Price history
+111.9% since first listed12 events — show timeline
- 2026-04-09 Price Changed $249,000 LCAR
- 2025-10-01 Listed $259,000 LCAR
- 2025-08-12 Price Changed $259,000 LCAR
- 2025-06-21 Price Changed $269,000 LCAR
- 2025-04-09 Price Changed $279,000 LCAR
- 2020-06-26 Sold (MLS) $62,500 PMAR
- 2020-05-18 Listed $39,900 PMAR
- 2019-12-18 Listed $50,000 LCAR
- 2016-09-21 Sold (Public Records) $120,000 Public Records
- 2016-09-20 Sold (MLS) $120,000 LCAR
- 2016-07-06 Listed $119,900 LCAR
- 2007-09-11 Sold (Public Records) $117,500 Public Records
Property tax history
+2.6%/yrLatest (2026): $2,538 · +4.6% YoY. Source: county tax records.
Cash-flow waterfall
monthlySold comps — $/sqft
last 12 mo · ≤1 miLoading sold comps…