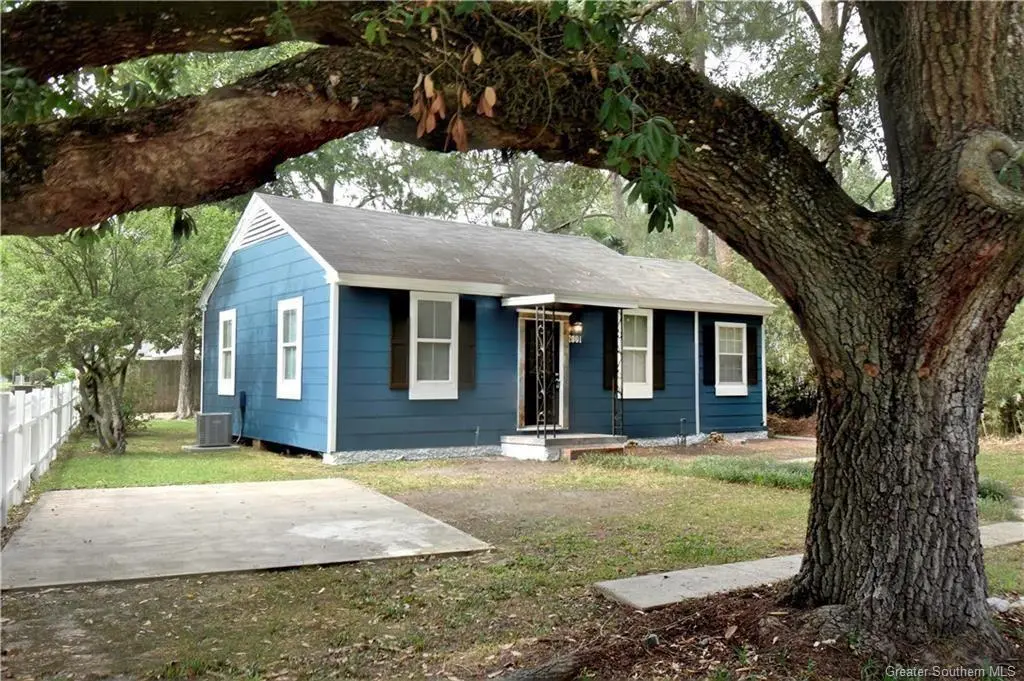
2001 Rose St · Lake Charles, LA
Flood risk 4/10 · Minor
- FEMA flood zone
- X (unshaded)
- Chance of flooding over 30 yrs
- 0.24%
- Est. flood insurance / yr
- $507 – $1,088
Fire risk 1/10 · Minimal
- Est. fire insurance / yr
- $1,269 – $2,357
Heat risk 8/10 · Major
- Hot days now (above 109°F)
- 4 days/yr
- Hot days in 30 yrs
- 13 days/yr
Wind risk 9/10 · Severe
- Chance of severe wind over 30 yrs
- 99.0%
Air-quality risk 2/10 · Minimal
- Unhealthy air days now
- 1 days/yr
- Unhealthy air days in 30 yrs
- 1 days/yr
Risk factors via First Street. Map © Google.
Why this score? — see what drove the C+ grade
The composite is a weighted blend of 9 inputs, each scored 0–100. Each bar is that input's sub-score; the figure is the points it added to the 100-point composite (weight × sub-score).
- Cash flow +30.0/30.0
- DSCR +10.0/10.0
- 1% rule +7.7/10.0
- Rent growth +4.0/5.0
- Livability +3.4/5.0
- ARV discount +3.3/15.0
- Schools +3.1/10.0
- Condition / age +2.5/5.0
- Appreciation +0.0/10.0
$77,500
🖨 Deal sheet 📄 Offer letter ✓ Due diligence
Listing remarks MLS
Invest with confidence in this precious two-bedroom, two-bath cottage in the heart of Lake Charles. This home sits on a corner lot in Flood Zone X, where flood insurance is typically not required. Currently tenant-occupied, making this the perfect opportunity for a turnkey and cash-flowing investment from the start. Conveniently located near everything Lake Charles has to offer, you are just minutes from downtown, McNeese State University, shopping, hospitals, restaurants, and more. Easy access to both I-10 and I-210, which is ideal for tenants who will be commuting to school or work and making this location even more attractive. If you are looking to add something to your portfolio that will start putting money back in your pocket from day one, then look no further and give us a call today to schedule a showing.
Key facts
- Easy access to i-210
- Flood zone x
- Turnkey investment
Tags
Neighborhood map
What this means for you Summary
Snapshot
- This is a 2-bed/2.0-bath single-family listed at $78k.
Deal economics
- At list price, monthly cash flow is $298 ($4k/yr) — positive.
- The deal already cash-flows at list — no discount required.
- Meets the 1% rule at list price ($983 rent vs $78k).
- Recommended offer: $68k (12.0% below list) — sets the bar for market timing.
- Cap rate 10.9% vs local median 4.3% in Lake Charles — top-decile yield for the area; either an underpriced asset or a hidden risk that comps aren't pricing in. Stress-test before assuming the spread holds.
Location & tenants
- Location reads 68/100 on livability (#95 in LA) — a middle-class / working-renter tenant base. Strengths: commute A+, cost of living A+, housing A+; Watch: crime F, amenities F, employment D-.
- Calcasieu Parish (other): math 30% / reading 44% proficiency, ranked #29 of 98 in LA (top 30%) — families likely to look elsewhere, expect single-tenant / working-renter base with shorter leases.
- Market conditions: Rents rising fast (+6.2%/yr); 363 active listings in the ZIP; 14 comparable units currently listed for rent nearby; rentals at typical pace (median 21d on market — plan ~3-4 weeks tenant-placement turnaround); 1,298 units permitted in Calcasieu Parish in 2024 (526 in 5+ unit buildings).
Forward outlook
- Local home prices are declining (-3.0%/yr); year-one equity from $536 of loan paydown is wiped out by about $2k of value loss. Plan a longer hold.
- Calcasieu County population projected at +11% by 2050 — modest demand growth; plan on rents tracking national, not racing it.
- At projected returns (-3.0% appreciation + 6.2% rent growth), your $22k cash investment doubles in ~7 years — after that, you're playing with house money.
Negotiation context
- It's been on market 318 days — a 12% lower offer ($68k) is reasonable based on typical stale-listing flexibility.
- 3 sale attempts since 8y ago with the ask held roughly flat each time — persistent listings suggest the price (not the market) is what's stuck; bring a comps-based counter.
Risks & watch-outs
- Climate carrying-cost: severe wind risk, 99% chance of damaging wind over 30y; extreme-heat days projected 4→13/yr by 2055 (HVAC capex compounding) — expect insurance premiums to compound above CPI over the hold.
Questions for the listing agent
- It's been on market 318 days. Have you received any prior offers? Is the seller open to a 12% concession, seller financing, or rate buy-down credit?
- Built in 1973 — when were the roof, HVAC, electrical panel, plumbing, and water heater last replaced?
- Why hasn't it sold? Are there any deal-killer items the seller is aware of (foundation, flood, title, zoning, code violations)?
- Is there a deadline driving the sale (1031 exchange, divorce, estate, relocation)? That informs how much negotiation room exists.
- Schools are B-rated — typically a magnet for longer-tenancy family renters. What's the average tenant stay here, and is there a school-zone premium baked into asking?
- Crime grade is F in this area — have there been break-ins, vandalism, or insurance claims at this property in the last 3 years? What carrier currently insures it and at what premium?
- What's the average days-on-market for RENTAL listings here right now (not sales)? A rising rental-DOM trend means longer vacancies and softer asking-rent achievability than the comps imply.
- What's the recent tenant-quality profile in this submarket — average credit score on applications, eviction rate, late-payment / NSF rate, and stable-employment percentage? A property-management company in the area should have these aggregated.
- How much new for-sale + rental construction is in the pipeline within 1–3 miles? Heavy new supply typically softens prices + rents 12–24 months out; constrained supply supports both.
Investment metrics
- 1% rule
- 1.27% ✓
- Cap rate
- 10.91%
- Cash-on-cash
- 16.49%
- DSCR
- 1.73
- GRM
- 6.6
CMA / ARV
- ARV (median comp)
- $70,923
- List price
- $77,500
- Delta
- 9.27%
- Verdict
- FAIR
- Comps
- 20 within 1.0 mi
Show comp detail 6 sales within ~0.75 mi
| Address | Dist | Beds/Ba | Sqft | Sold | Price | $/sf | Match |
|---|---|---|---|---|---|---|---|
| 2125 9th St | 0.37mi | 3/1.0 (+1) | 900 (+3%) | 3mo | $55,000 | $61 | 66 |
| 2301 Lilly St | 0.44mi | 2/1.0 | 884 (+1%) | 18mo | $53,000 | $60 | 58 |
| 2016 Tulip St St | 0.13mi | 3/1.0 (+1) | 980 (+12%) | 8mo | $55,000 | $56 | 57 |
| 2224 Lilly St | 0.38mi | 2/1.0 | 800 (-8%) | 15mo | $78,000 | $98 | 52 |
| 2213 11th St | 0.35mi | 2/1.0 | 1,000 (+15%) | 15mo | $59,000 | $59 | 42 |
| 2324 Rose St | 0.50mi | 2/1.0 | 806 (-8%) | 23mo | $83,500 | $104 | 41 |
Match score weights: distance 35% · size 25% · config 20% · recency 20%. Top-matched comps best support the ARV.
Projected returns pro-forma
-3.0% appreciation · 6.18% rent growth · sell at horizon
- IRR
- 10.9%
- Equity multiple
- 1.45×
- Total profit
- $9,665
- Equity at exit
- $11,556
- IRR
- 22.2%
- Equity multiple
- 3.17×
- Total profit
- $47,017
- Equity at exit
- $6,701
Cash invested: $21,700 (down + closing). Projections, not guarantees.
Landlord ↔ Tenant lean methodology
- Overall (STATE)
- 90 Strongly Landlord-Friendly
- State Louisiana
- 90 Strongly Landlord-Friendly · R+12
- County
- — inherits STATE
- City
- — inherits STATE
ZIP-level market 70601
- Rents YoY
- 6.2%
- Active inventory
- 363
- Price-to-rent
- 6.6×
Monthly cashflow live
- Estimated rent
- $983 high interval (Pro) →
- Mortgage (P&I)
- −$406
- Tax from tax record
- −$40 /mo · $477/yr
- Insurance
- −$32
- HOA
- −$0
- Vacancy / Maint / Mgmt
- −$206
- Net cashflow
- $298
Break-even live
UW: 25.0% down · 7.5% · 30yr · 1.5% tax · 5.0% vac · 8.0% maint · 8.0% mgmt
Financing live
Cash to close
- Down payment
- $19,375
- Closing costs
- $2,325
- Reserves months
- —
- Total cash needed
- —
Loan-product check · same deal, 3 products live
Conventional
25% down · 7.5% · 30yr
- Down + closing
- —
- Monthly P&I
- —
- Monthly cashflow
- —
- DSCR
- —
- Eligible?
- —
Personal DTI + credit; lowest rate.
DSCR
20% down · 8.5% · 30yr
- Down + closing
- —
- Monthly P&I
- —
- Monthly cashflow
- —
- DSCR
- —
- Eligible?
- —
No personal income docs; deal must DSCR.
Hard money
10% down · 12.0% · 12mo
- Down + closing
- —
- Monthly P&I
- —
- Monthly cashflow
- —
- DSCR
- —
- Eligible?
- —
Short-term bridge; refi at stabilization.
Rent comps 14 comps
| Address | Beds | Baths | Sqft | Rent | $/sqft | DOM | Units | Dist |
|---|---|---|---|---|---|---|---|---|
| 1915 Legion St Lake Charles, LA | 3.0 | 1.0 | 966 | $950 | $0.98 | 13d | 1 | 0.30mi |
| 1906 8th Ave Lake Charles, LA | 3.0 | 1.0 | 1001 | $1,350 | $1.35 | 43d | 1 | 0.54mi |
| 1505 7th St Lake Charles, LA | 2.0 | 1.0 | 1054 | $900 | $0.85 | 43d | 1 | 0.65mi |
| 2405 9th St Lake Charles, LA | 2.0 | 1.0 | 788 | $850 | $1.08 | 13d | 1 | 0.75mi |
| 3108 Aster St Unit M Lake Charles, LA | 2.0 | 1.0 | 1100 | $1,300 | $1.18 | 13d | 1 | 0.93mi |
| 1028 Alamo St Lake Charles, LA | 2.0 | 1.0 | 865 | $850 | $0.98 | 21d | 1 | 1.00mi |
| 3322 Kingham Rd Unit 2 Lake Charles, LA | 2.0 | 1.0 | 870 | $1,075 | $1.24 | 43d | 1 | 1.01mi |
| 1105 Hunter Dr Lake Charles, LA | 2.0 | 1.0 | 849 | $900 | $1.06 | 43d | 1 | 1.19mi |
| 3529 Greinwich Blvd Lake Charles, LA | 3.0 | 1.0 | 768 | $895 | $1.17 | 43d | 1 | 1.27mi |
| 333 Mill St Lake Charles, LA | 1.0–2.0 | 1.0 | 758 | $750 | $0.99 | 13d | 1 | 1.29mi |
| 603 Falls St Lake Charles, LA | 2.0 | 1.0 | 825 | $825 | $1.00 | 21d | 1 | 1.33mi |
| 1605 W Common St Unit 1 Lake Charles, LA | 1.0 | 1.0 | 750 | $925 | $1.23 | 21d | 1 | 1.38mi |
| 3619 Texas St Lake Charles, LA | 1.0–3.0 | 1.0–2.0 | 950 | $994 | $1.05 | 13d | 6 | 1.40mi |
| 823 Kirkman St Unit 4 Lake Charles, LA | 1.0 | 1.0 | 950 | $600 | $0.63 | 21d | 1 | 1.45mi |
Listing history 22 events
-
2026-06-19days on market $77,500 Active 318 DOM
-
2026-06-18days on market $77,500 Active 317 DOM
-
2026-06-17days on market $77,500 Active 316 DOM
-
2026-06-16days on market $77,500 Active 315 DOM
-
2026-06-15days on market $77,500 Active 314 DOM
-
2026-06-14days on market $77,500 Active 312 DOM
-
2026-06-13days on market $77,500 Active 311 DOM
-
2026-06-10days on market $77,500 Active 309 DOM
-
2026-06-09days on market $77,500 Active 308 DOM
-
2026-06-08days on market $77,500 Active 307 DOM
-
2026-06-07days on market $77,500 Active 306 DOM
-
2026-06-05days on market $77,500 Active 303 DOM
-
2026-06-02days on market $77,500 Active 301 DOM
-
2026-06-01days on market $77,500 Active 300 DOM
-
2026-05-31days on market $77,500 Active 299 DOM
-
2026-05-30days on market $77,500 Active 298 DOM
-
2025-06-03$77,500 Active 824-char remark
Show marketing remark (824 chars)
Invest with confidence in this precious two-bedroom, two-bath cottage in the heart of Lake Charles. This home sits on a corner lot in Flood Zone X, where flood insurance is typically not required. Currently tenant-occupied, making this the perfect opportunity for a turnkey and cash-flowing investment from the start. Conveniently located near everything Lake Charles has to offer, you are just minutes from downtown, McNeese State University, shopping, hospitals, restaurants, and more. Easy access to both I-10 and I-210, which is ideal for tenants who will be commuting to school or work and making this location even more attractive. If you are looking to add something to your portfolio that will start putting money back in your pocket from day one, then look no further and give us a call today to schedule a showing.
-
2018-06-15soldstatus 371-char remark
Show marketing remark (371 chars)
White picket fence, two gorgeous mature oaks with sweeping branches all framing an adorable 2 bedroom cottage that looks as though it was built from a storybook. This cozy home welcomes you with subtle wall colors, beautiful new flooring in the living room, kitchen and bedrooms. Schedule your showing today, and make this home part of the next chapter of your own story.
-
2018-06-15soldstatus $75,000
Show marketing remark (371 chars)
White picket fence, two gorgeous mature oaks with sweeping branches all framing an adorable 2 bedroom cottage that looks as though it was built from a storybook. This cozy home welcomes you with subtle wall colors, beautiful new flooring in the living room, kitchen and bedrooms. Schedule your showing today, and make this home part of the next chapter of your own story.
-
2018-05-21$82,500 371-char remark
Show marketing remark (371 chars)
White picket fence, two gorgeous mature oaks with sweeping branches all framing an adorable 2 bedroom cottage that looks as though it was built from a storybook. This cozy home welcomes you with subtle wall colors, beautiful new flooring in the living room, kitchen and bedrooms. Schedule your showing today, and make this home part of the next chapter of your own story.
-
2018-02-26soldstatus
-
2018-01-25$37,500
ⓘ Source: listings_history table (triggers on properties + properties_extension) + one-shot
backfill from property_details.listing_events for pre-trigger history.
Tax reassessment forecast LA · Resets to sale price
- Current annual tax
- $477 · $40/mo
- Projected year-2 tax
- $477 · $40/mo
- Expected delta
- $0/yr ($0/mo · 0.0%)
ⓘ Screening estimate from a state-policy table — verify with the county assessor before closing.
Climate risk First Street
- Flood 4/10 Moderate FEMA zone X (unshaded) · 24% chance over 30 yrs
- Wildfire 1/10 Low
- Heat 8/10 Severe 4 d/yr ≥109°F today · 13 d/yr by 30 yrs out
- Wind 9/10 Extreme 99% chance of damaging wind over 30 yrs
- Air quality 2/10 Low 1 unhealthy d/yr today · 1 by 30 yrs out
Nearby sold comps map
Loading sold comps map…
Walkable amenities ~0.75 mi
Loading nearby amenities…
Taxation est. · year 1
- Rental income
- $11,799
- − Mortgage interest
- −$4,341
- − Property taxes
- −$477
- − Insurance
- −$388
- − Repairs & maintenance
- −$944
- − Management
- −$944
- − Depreciation
- −$2,255
- Taxable income
- $2,451
- Est. tax owed @ 24.0%
- −$588
- After-tax cash flow
- $2,991/yr
For passive investors: Depreciation is non-cash, so a rental often shows a tax loss while cash-flowing — sheltering income. Rental losses are passive: they offset passive income freely, and up to $25,000/yr can offset ordinary (W-2) income if you actively participate and your MAGI is under $100k (phasing out to $0 by $150k); unused losses carry forward. On sale, claimed depreciation is recaptured at up to 25%, and gains may owe capital-gains tax (a 1031 exchange can defer both). Figures are a year-1 estimate at your 24.0% rate — not tax advice; consult a CPA.
Schools (NCES district)
- District
- Calcasieu Parish
- NCES district ID
- 2200330
- Math proficiency
- 30% ▼ -39.00%
- Reading proficiency
- 44% ▼ -33.00%
- Median HH income
- $44,700
- Composite
- 31.45/100
- National rank
- #5979
- State rank
- #29 of 98 in LA
Livability — Lake Charles
- Score
- 68/100
- State rank
- #95
- US rank
- #9820
Category grades
Schools grade is shown separately in the Schools card above.
Census & demographics
- Census place
- Lake Charles, LA
- County
- Calcasieu Parish · 170,889 people
- City population
- 133,538
- Metro
- Lake Charles, LA
- Population (ZIP)
- 30,872
- Household income
- $49,992
- Rent vs Own
- Severe rent burden
- 1304.0
Population outlook (Calcasieu County) Hauer SSP2
- Today (2025)
- 212,179 people
- By 2030
- 218,199 · +2.8%
- By 2040
- 228,486 · +7.7%
- By 2050
- 236,208 · +11.3%
- By 2075
- 251,696 · +18.6%
- By 2100
- 247,848 · +16.8%
Race, ethnicity, and origin ACS 2023
- Neighborhood character
- Diverse neighborhood (Simpson 0.55)
- Race & ethnicity
- Black 59% White 31% Two or more races 7% Hispanic / Latino 5%
- Common ancestry
- Lithuanian 7% Iranian 1% Serbian 1%
- Foreign-born
- 3% · Canada
- Languages at home
- 95% English-only · Spanish 2% French/Haitian/Cajun 1%
Political lean MEDSL · Calcasieu
- 2024 margin
- Solid R (+39.6) · D 29.5% · R 69.0% · Other 1.5%
- 2008→2024 swing
- -15.0pp toward R · 2008: -24.6pp · 2024: -39.6pp
- All cycles
- 2024: R+39.6 2020: R+35.2 2016: R+33.3 2012: R+28.7 2008: R+24.6
Not yet ingested
- Civics
- —
Market trends
- HPI YoY
- ▼ -109.32%
- Current HPI
- 55.6127
- Rent YoY
- ▲ 6.18%
- Metro
- Lake Charles, LA
- State GDP YoY
- ▲ 3.29%
- F500 in state
- 10
Industry mix (Fortune 500 HQ in LA)
| Industry | F500 HQs | Revenue |
|---|---|---|
| Telecommunications | 2 | $23B |
|
||
| Utilities | 1 | $12B |
|
||
| Wholesale / Distribution | 1 | $5B |
|
||
| Advertising | 1 | $2B |
|
||
Price history
+106.7% since first listed6 events — show timeline
- 2025-06-03 Listed $77,500 SWLAR
- 2018-06-15 Sold (Public Records) $75,000 Public Records
- 2018-06-15 Sold (MLS) — SWLAR
- 2018-05-21 Listed $82,500 SWLAR
- 2018-02-26 Sold (MLS) — SWLAR
- 2018-01-25 Listed $37,500 SWLAR
Property tax history
-0.5%/yrLatest (2025): $477 · +1.3% YoY. Source: county tax records.
Cash-flow waterfall
monthlySold comps — $/sqft
last 12 mo · ≤1 miLoading sold comps…