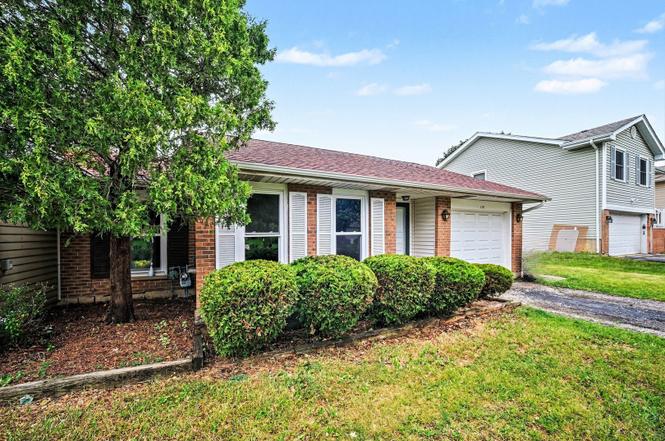
128 Majestic Dr · Lombard, IL
Flood risk 1/10 · Minimal
- FEMA flood zone
- X (unshaded)
- Chance of flooding over 30 yrs
- 0.0%
- Est. flood insurance / yr
- $473 – $860
Fire risk 1/10 · Minimal
- Est. fire insurance / yr
- $804 – $1,492
Heat risk 3/10 · Minor
- Hot days now (above 103°F)
- 7 days/yr
- Hot days in 30 yrs
- 14 days/yr
Wind risk 2/10 · Minimal
- Chance of severe wind over 30 yrs
- —
Air-quality risk 3/10 · Minor
- Unhealthy air days now
- 3 days/yr
- Unhealthy air days in 30 yrs
- 4 days/yr
Risk factors via First Street. Map © Google.
Why this score? — see what drove the F grade
The composite is a weighted blend of 9 inputs, each scored 0–100. Each bar is that input's sub-score; the figure is the points it added to the 100-point composite (weight × sub-score).
- Cash flow +12.3/30.0
- 1% rule +4.1/10.0
- DSCR +3.6/10.0
- Schools +3.6/10.0
- Livability +3.6/5.0
- Rent growth +2.7/5.0
- Condition / age +2.5/5.0
- ARV discount +0.0/15.0
- Appreciation +0.0/10.0
$310,000
🖨 Deal sheet 📄 Offer letter ✓ Due diligence
Listing remarks
Located In The Desirable Highland Green Community, This Duplex Offers A Fantastic Opportunity To Make It Your Own. Featuring 3 Bedrooms And 1 Full Bathroom, The Home Includes A Spacious Living Room, a separate dining room, A Functional Kitchen, And A Dedicated Laundry Room. Step Outside To A Fenced Backyard With A Concrete Patio, Perfect For Relaxing Or Entertaining, Along With The Convenience Of A 1-Car Garage. Major Improvements Have Already Been Completed, Including A New Roof, Windows, And Patio Door Within The Last 21/2 Years, As Well As A Furnace And Water Heater That Are Approximately 3 Years Old. While The Home Could Benefit From Cosmetic Updates, It Provides An Excellent Opportunit
Key facts
- Functional kitchen
- Separate dining room
- Concrete patio
Tags
Property features AI
Finance
- Other: Two-unit building; Not currently leased; Commuter-friendly location with bus and train access; interstate access nearby; Parcel number 0629103017
- HOA & community: No master association required; Pets allowed (cats and dogs permitted, large max pet weight indicated)
Exterior
- Parking: Attached garage (garage owned) with garage door opener; Asphalt driveway; One garage/parking space
- Utilities: Water from Lake Michigan; Public sewer
- Home design: Attached single (1/2 duplex); Entry level 1; Fee simple ownership
- Construction: Built 41–50 years ago; Vinyl siding and brick exterior; Asphalt roof; Concrete perimeter foundation
- Exterior features: Patio
Interior
- Kitchen: Kitchen with eating area/table space (14 x 11); Range; Microwave; Dishwasher; Refrigerator
- Bedrooms: Master bedroom on main level (15 x 11) with parquet flooring; Second bedroom on main level (12 x 12) with parquet flooring; Third bedroom on main level (9 x 9) with parquet flooring
- Flooring: Parquet flooring in bedrooms and master; Carpet in living and dining areas; Vinyl flooring in kitchen and laundry
- Bathrooms: One full bathroom
- Heating & cooling: Natural gas forced-air heating; Central air conditioning
- Interior features: Six total rooms; Separate dining room; Some photos virtually staged
- Laundry & utility: In-unit laundry (washer and dryer); Laundry room on main level (11 x 5)
Neighborhood map
What this means for you Summary
Snapshot
- This is a 3-bed/1.0-bath townhouse listed at $310k.
Deal economics
- At list price, monthly cash flow is $-57 ($-688/yr) — negative.
- To cash-flow at today's rent, offer at most $300k (3.3% below list).
- To meet the 1% rule (rent ≥ 1% of price), the offer needs to be $281k (9.4% below list).
- Recommended offer: $281k (9.4% below list) — sets the bar for 1% rule.
- Cap rate 6.1% vs local median 3.8% in Lombard — top-decile yield for the area; either an underpriced asset or a hidden risk that comps aren't pricing in. Stress-test before assuming the spread holds.
Location & tenants
- Location reads 72/100 on livability (#314 in IL) — a middle-class / working-renter tenant base. Strengths: employment A+, housing A+, crime A-; Watch: cost of living C-, health & safety D+, amenities F.
- Glenbard Twp Hsd 87 (suburban): math 38% / reading 40% proficiency, ranked #126 of 620 in IL (top 20%) — families likely to look elsewhere, expect single-tenant / working-renter base with shorter leases.
- Market conditions: Rents flat; 136 active listings in the ZIP; 20 comparable units currently listed for rent nearby; rentals leasing fast (median 3d on market — plan ~1-2 weeks tenant-placement turnaround); solid renter incomes; 1,378 units permitted in DuPage County in 2024 (594 in 5+ unit buildings).
- This rent runs 34% of the median local income ($101k/yr) — at the standard rent-burdened threshold; future hikes will face affordability resistance.
Forward outlook
- Local home prices are declining (-3.0%/yr); year-one equity from $2k of loan paydown is wiped out by about $9k of value loss. Plan a longer hold.
Negotiation context
- Only 7 days on market — expect competitive offers; lowballing is unlikely to land.
- Current owner paid $60k; list at $310k implies a 417% gain — meaningful room to come down on a strong offer.
Questions for the listing agent
- What do current leases actually rent for vs. the listed asking? Can we see a recent rent roll and the last 12 months of T-12 income?
- Built in 1979 — when were the roof, HVAC, electrical panel, plumbing, and water heater last replaced?
- Is there a deadline driving the sale (1031 exchange, divorce, estate, relocation)? That informs how much negotiation room exists.
- Schools are B-rated — typically a magnet for longer-tenancy family renters. What's the average tenant stay here, and is there a school-zone premium baked into asking?
- The area grade is low — what's the realistic commute time and amenity access for the typical tenant pool here? Any planned neighborhood developments (good or bad) we should know about?
- What's the average days-on-market for RENTAL listings here right now (not sales)? A rising rental-DOM trend means longer vacancies and softer asking-rent achievability than the comps imply.
- What's the recent tenant-quality profile in this submarket — average credit score on applications, eviction rate, late-payment / NSF rate, and stable-employment percentage? A property-management company in the area should have these aggregated.
- How much new for-sale + rental construction is in the pipeline within 1–3 miles? Heavy new supply typically softens prices + rents 12–24 months out; constrained supply supports both.
Investment metrics
- 1% rule
- 0.91% ✗
- Cap rate
- 6.07%
- Cash-on-cash
- -0.79%
- DSCR
- 0.96
- GRM
- 9.2
CMA / ARV
- ARV (on-the-fly)
- $242,748
- Comps found
- 12
Show comp detail 12 sales within ~0.75 mi
| Address | Dist | Beds/Ba | Sqft | Sold | Price | $/sf | Match |
|---|---|---|---|---|---|---|---|
| 36 Arboretum Dr | 0.22mi | 2/1.5 (-1) | 1,280 (+4%) | 1mo | $271,000 | $212 | 75 |
| 2211 S Stewart Ave Unit 3D | 0.34mi | 2/2.0 (-1) | 1,235 (+1%) | 5mo | $196,500 | $159 | 70 |
| 48 Arboretum Dr #253 | 0.24mi | 2/2.5 (-1) | 1,280 (+4%) | 1mo | $315,000 | $246 | 70 |
| 2201 S Highland Ave Unit 3G | 0.24mi | 2/2.0 (-1) | 1,170 (-5%) | 2mo | $230,000 | $197 | 70 |
| 2260 S Grace St #401 | 0.35mi | 2/2.0 (-1) | 1,293 (+6%) | 3mo | $277,500 | $215 | 63 |
| 2000 Saint Regis Dr Unit 6B | 0.61mi | 2/2.0 (-1) | 1,200 (-2%) | 4mo | $257,000 | $214 | 56 |
| 2000 Saint Regis Dr Unit 4G | 0.61mi | 2/2.0 (-1) | 1,186 (-3%) | 3mo | $235,000 | $198 | 55 |
| 2000 Saint Regis Dr Unit 6G | 0.61mi | 2/2.0 (-1) | 1,186 (-3%) | 5mo | $185,000 | $156 | 53 |
| 2201 S Grace St #305 | 0.46mi | 3/2.0 | 1,383 (+13%) | 4mo | $265,000 | $192 | 50 |
| 273 W 20th St | 0.48mi | 2/2.5 (-1) | 1,350 (+10%) | 3mo | $310,000 | $230 | 47 |
| 2015 S Finley Rd #1104 | 0.67mi | 2/2.0 (-1) | 1,092 (-11%) | 0mo | $184,900 | $169 | 41 |
| 2015 S Finley Rd #812 | 0.67mi | 2/2.0 (-1) | 1,092 (-11%) | 1mo | $170,000 | $156 | 41 |
Match score weights: distance 35% · size 25% · config 20% · recency 20%. Top-matched comps best support the ARV.
Projected returns pro-forma
-3.0% appreciation · 0.94% rent growth · sell at horizon
- IRR
- -20.0%
- Equity multiple
- 0.31×
- Total profit
- $-59,467
- Equity at exit
- $46,222
- IRR
- -18.5%
- Equity multiple
- 0.10×
- Total profit
- $-78,447
- Equity at exit
- $26,803
Cash invested: $86,800 (down + closing). Projections, not guarantees.
Landlord ↔ Tenant lean methodology
- Overall (STATE)
- 43 Moderately Tenant-Leaning
- State Illinois
- 43 Moderately Tenant-Leaning · D+7
- County
- — inherits STATE
- City
- — inherits STATE
ZIP-level market 60148
- Rents YoY
- 0.9%
- Active inventory
- 136
- Price-to-rent
- 9.2×
Monthly cashflow live
- Estimated rent
- $2,810 high interval (Pro) →
- Mortgage (P&I)
- −$1,626
- Tax from tax record
- −$522 /mo · $6,268/yr
- Insurance
- −$129
- HOA
- −$0
- Vacancy / Maint / Mgmt
- −$590
- Net cashflow
- $-57
Break-even live
UW: 25.0% down · 7.5% · 30yr · 1.5% tax · 5.0% vac · 8.0% maint · 8.0% mgmt
Financing live
Cash to close
- Down payment
- $77,500
- Closing costs
- $9,300
- Reserves months
- —
- Total cash needed
- —
Loan-product check · same deal, 3 products live
Conventional
25% down · 7.5% · 30yr
- Down + closing
- —
- Monthly P&I
- —
- Monthly cashflow
- —
- DSCR
- —
- Eligible?
- —
Personal DTI + credit; lowest rate.
DSCR
20% down · 8.5% · 30yr
- Down + closing
- —
- Monthly P&I
- —
- Monthly cashflow
- —
- DSCR
- —
- Eligible?
- —
No personal income docs; deal must DSCR.
Hard money
10% down · 12.0% · 12mo
- Down + closing
- —
- Monthly P&I
- —
- Monthly cashflow
- —
- DSCR
- —
- Eligible?
- —
Short-term bridge; refi at stabilization.
Rent comps 20 comps
| Address | Beds | Baths | Sqft | Rent | $/sqft | DOM | Units | Dist |
|---|---|---|---|---|---|---|---|---|
| 2211 S Highland Ave Unit 4B Lombard, IL | 3.0 | 2.0 | 1430 | $2,600 | $1.82 | 24d | 1 | 0.22mi |
| 2720 S Highland Ave Lombard, IL | 1.0–3.0 | 1.0–2.0 | 1060 | $3,326 | $3.14 | 1d | 20 | 0.23mi |
| 2233 S Highland Ave Lombard, IL | 2.0 | 1.0–2.0 | 858 | $2,547 | $2.97 | 2d | 51 | 0.25mi |
| 95 Yorktown Shopping Ctr Lombard, IL | 1.0–3.0 | 1.0–2.0 | 1107 | $3,825 | $3.45 | 1d | 145 | 0.30mi |
| 2211 S Stewart Ave Unit 4D Lombard, IL | 2.0 | 2.0 | 1235 | $2,300 | $1.86 | 15d | 1 | 0.34mi |
| 2211 S Stewart Ave Unit 3B Lombard, IL | 3.0 | 2.0 | 1430 | $2,525 | $1.77 | 24d | 1 | 0.34mi |
| 2001 S Highland Ave Lombard, IL | 2.0 | 2.0 | 740 | $1,750 | $2.36 | 7d | 1 | 0.35mi |
| 2200 S Grace St Lombard, IL | 2.0–3.0 | 2.0 | 1320 | $2,504 | $1.90 | 5d | 10 | 0.42mi |
| 268 Gazebo Ln #38 Lombard, IL | 2.0 | 1.5 | 917 | $2,295 | $2.50 | 20d | 1 | 0.45mi |
| 55 Yorktown Shopping Ctr Lombard, IL | 1.0–2.0 | 1.0–2.5 | 966 | $3,613 | $3.74 | 1d | 4 | 0.47mi |
| 50 Yorktown Shopping Ctr Lombard, IL | 2.0 | 1.0–2.0 | 1206 | $3,696 | $3.06 | 1d | 23 | 0.50mi |
| 20W560 Glen Pl Lombard, IL | 4.0 | 2.0 | 1245 | $3,050 | $2.45 | 1d | 1 | 0.84mi |
| 450 Woodmoor Dr Lombard, IL | 2.0 | 1.0–2.0 | 953 | $3,145 | $3.30 | 1d | 15 | 0.85mi |
| 830 Foxworth Blvd Lombard, IL | 1.0–3.0 | 1.0–2.0 | 929 | $2,434 | $2.62 | 1d | 66 | 0.95mi |
| 1504 S Fairfield Ave Unit 25C Lombard, IL | 2.0 | 1.0 | 940 | $1,800 | $1.91 | 24d | 1 | 1.00mi |
| 2845 Easton St Downers Grove, IL | 2.0 | 1.0–2.5 | 1121 | $3,785 | $3.38 | 1d | 23 | 1.04mi |
| 1000 Hunter St Lombard, IL | 3.0 | 2.0 | 1146 | $2,950 | $2.57 | 4d | 1 | 1.11mi |
| 2003 S Meyers Rd Oakbrook Terrace, IL | 1.0–3.0 | 1.0–2.0 | 1227 | $4,140 | $3.37 | 1d | 7 | 1.18mi |
| 1301 S Finley Rd #418 Lombard, IL | 2.0 | 1.5 | 1137 | $1,500 | $1.32 | 3d | 1 | 1.23mi |
| 1300 S Finley Rd Lombard, IL | 1.0–2.0 | 1.0–2.0 | 980 | $2,125 | $2.17 | 1d | 9 | 1.40mi |
Listing history 9 events
-
2026-06-18days on market $310,000 Active 7 DOM
-
2026-06-17status $310,000 Active 6 DOM
-
2026-06-17days on market $310,000 Contingent - Continue to Show 6 DOM
-
2026-06-16days on market $310,000 Contingent - Continue to Show 5 DOM
-
2026-06-15status $310,000 Contingent - Continue to Show 4 DOM
-
2026-06-15days on market $310,000 Active 4 DOM
-
2026-06-13days on market $310,000 Active 2 DOM
-
2026-06-13remarks 699-char remark
-
2026-06-13$310,000 Active 1 DOM
ⓘ Source: listings_history table (triggers on properties + properties_extension) + one-shot
backfill from property_details.listing_events for pre-trigger history.
Tax reassessment forecast IL · Partial reset (capped growth)
- Current annual tax
- $6,268 · $522/mo
- Projected year-2 tax
- $6,652 · $554/mo
- Expected delta
- +$385/yr (+$32/mo · 6.1%)
ⓘ Screening estimate from a state-policy table — verify with the county assessor before closing.
Climate risk First Street
- Flood 1/10 Low FEMA zone X (unshaded) · 0% chance over 30 yrs
- Wildfire 1/10 Low
- Heat 3/10 Moderate 7 d/yr ≥103°F today · 14 d/yr by 30 yrs out
- Wind 2/10 Low
- Air quality 3/10 Moderate 3 unhealthy d/yr today · 4 by 30 yrs out
Nearby sold comps map
Loading sold comps map…
Walkable amenities ~0.75 mi
Loading nearby amenities…
Taxation est. · year 1
- Rental income
- $33,719
- − Mortgage interest
- −$17,365
- − Property taxes
- −$6,268
- − Insurance
- −$1,550
- − Repairs & maintenance
- −$2,697
- − Management
- −$2,697
- − Depreciation
- −$9,018
- Taxable loss
- −$5,877
- Est. tax savings @ 24.0%
- +$1,411
- After-tax cash flow
- $722/yr
For passive investors: Depreciation is non-cash, so a rental often shows a tax loss while cash-flowing — sheltering income. Rental losses are passive: they offset passive income freely, and up to $25,000/yr can offset ordinary (W-2) income if you actively participate and your MAGI is under $100k (phasing out to $0 by $150k); unused losses carry forward. On sale, claimed depreciation is recaptured at up to 25%, and gains may owe capital-gains tax (a 1031 exchange can defer both). Figures are a year-1 estimate at your 24.0% rate — not tax advice; consult a CPA.
Schools (NCES district)
- District
- Glenbard Twp Hsd 87
- NCES district ID
- 1716830
- Math proficiency
- 38% ▼ -5.00%
- Reading proficiency
- 40% ▼ -4.00%
- Median HH income
- $79,535
- Composite
- 36.49/100
- National rank
- #4651
- State rank
- #126 of 620 in IL
Livability — Lombard
- Score
- 72/100
- State rank
- #314
- US rank
- #6205
Category grades
Schools grade is shown separately in the Schools card above.
Census & demographics
- Census place
- Lombard, IL
- County
- DuPage County · 904,569 people
- City population
- 52,596
- Metro
- Chicago-Naperville-Elgin, IL-IN-WI
- Population (ZIP)
- 52,596
- Household income
- $100,616
- Rent vs Own
- Severe rent burden
- 1539.0
Population outlook (DuPage County) Hauer SSP2
- Today (2025)
- 960,187 people
- By 2030
- 965,850 · +0.6%
- By 2040
- 965,812 · +0.6%
- By 2050
- 954,890 · -0.6%
- By 2075
- 910,185 · -5.2%
- By 2100
- 816,255 · -15.0%
Race, ethnicity, and origin ACS 2023
- Neighborhood character
- Predominantly White (66%)
- Race & ethnicity
- White 66% Hispanic / Latino 13% Asian 11% Two or more races 9% Black 6%
- Hispanic origin (detail)
- Mexican 9%
- Common ancestry
- Romanian 11% Italian 4% Iranian 2%
- Foreign-born
- 17% · Canada, China, South Korea
- Languages at home
- 75% English-only · Other Indo-European 9% Spanish 9% Russian/Polish/Slavic 3%
Political lean MEDSL · DuPage
- 2024 margin
- D (+13.3) · D 55.9% · R 42.5% · Other 1.6%
- 2008→2024 swing
- +2.5pp toward D · 2008: 10.8pp · 2024: 13.3pp
- All cycles
- 2024: D+13.3 2020: D+18.1 2016: D+14.1 2012: D+1.0 2008: D+10.8
Not yet ingested
- Civics
- —
Market trends
- HPI YoY
- ▼ -282.93%
- Current HPI
- 210.0801
- Rent YoY
- ▲ 0.94%
- Metro
- Chicago-Naperville-Elgin, IL-IN-WI
- State GDP YoY
- ▲ 1.59%
- F500 in state
- 60
Industry mix (Fortune 500 HQ in IL)
| Industry | F500 HQs | Revenue |
|---|---|---|
| Insurance | 4 | $201B |
|
||
| Consumer Goods | 4 | $87B |
|
||
| Industrial Machinery | 3 | $64B |
|
||
| Healthcare | 2 | $55B |
|
||
| Retail / Pharmacy | 1 | $148B |
|
||
| Agriculture / Food | 1 | $86B |
|
||
Price history
+373.3% since first listed3 events — show timeline
- 2026-06-11 Listed $310,000 MRED as Distributed by MLS Grid
- 1989-07-31 Sold (Public Records) $60,000 Public Records
- 1983-12-01 Sold (Public Records) $65,500 Public Records
Property tax history
+3.3%/yrLatest (2024): $6,268 · +4.5% YoY. Source: county tax records.
Cash-flow waterfall
monthlySold comps — $/sqft
last 12 mo · ≤1 miLoading sold comps…