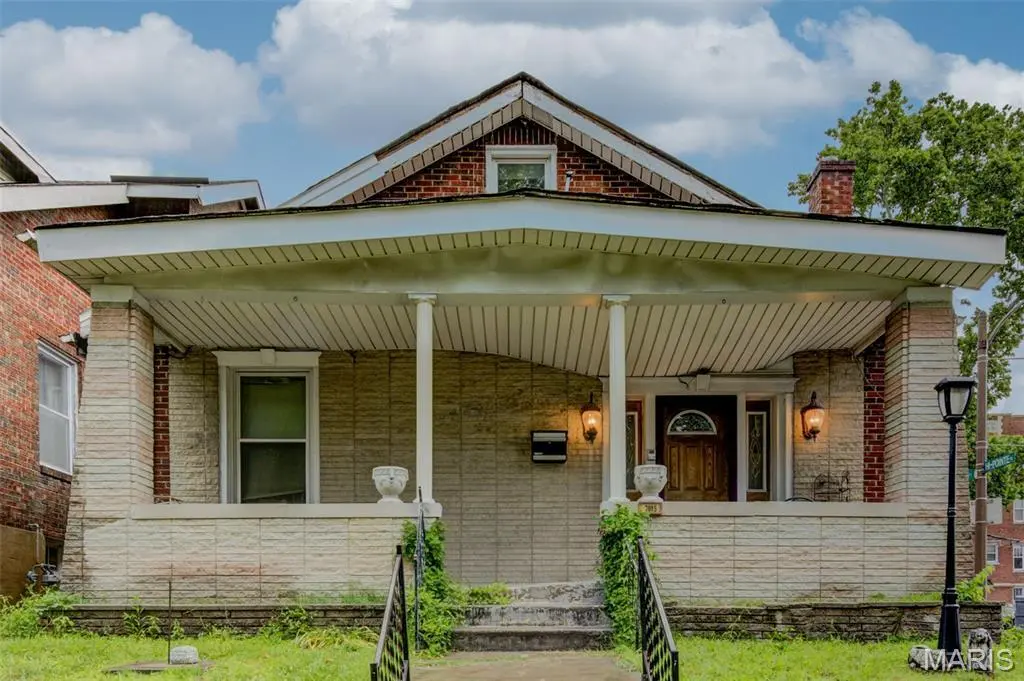
7015 Ethel Ave · St. Louis, MO
Flood risk 1/10 · Minimal
- FEMA flood zone
- X (unshaded)
- Chance of flooding over 30 yrs
- 0.0%
- Est. flood insurance / yr
- $473 – $860
Fire risk 1/10 · Minimal
- Est. fire insurance / yr
- $1,054 – $1,958
Heat risk 5/10 · Moderate
- Hot days now (above 107°F)
- 7 days/yr
- Hot days in 30 yrs
- 21 days/yr
Wind risk 2/10 · Minimal
- Chance of severe wind over 30 yrs
- 1.0%
Air-quality risk 3/10 · Minor
- Unhealthy air days now
- 3 days/yr
- Unhealthy air days in 30 yrs
- 4 days/yr
Risk factors via First Street. Map © Google.
Why this score? — see what drove the B grade
The composite is a weighted blend of 9 inputs, each scored 0–100. Each bar is that input's sub-score; the figure is the points it added to the 100-point composite (weight × sub-score).
- Cash flow +30.0/30.0
- ARV discount +15.0/15.0
- 1% rule +10.0/10.0
- DSCR +10.0/10.0
- Rent growth +3.7/5.0
- Livability +2.5/5.0
- Condition / age +2.5/5.0
- Schools +1.2/10.0
- Appreciation +0.0/10.0
$185,000
🖨 Deal sheet 📄 Offer letter ✓ Due diligence
Listing remarks
Calling all Investors! Opportunity awaits with this spacious home located in the awesome Hi-Pointe neighborhood. Bring your creative ideas and get ready to call this place home.
Key facts
- 4,199 sq ft lot
- Built 1923
- Listed 30 days
Property features AI
Finance
- Other: Private ownership; No pool
- Financial info: Lease not considered; Seller may consider concessions
Exterior
- Utilities: Public water; Public sewer; Single phase electric; Electricity connected
- Home design: Single family residence; One level (levels listed as One)
- Construction: Brick construction
- Exterior features: Front yard; Back yard
Interior
- Bedrooms: 4 bedrooms total; 2 bedrooms on the main level; 2 bedrooms on the upper level
- Bathrooms: 2 full bathrooms; 1 half bathroom; 1 full bathroom on the main level; 1 full bathroom on the upper level; 1 half bathroom on the lower level
- Heating & cooling: Forced air heating; Central air conditioning
- Interior features: Full basement
Neighborhood map
What this means for you Summary
Snapshot
- This is a 4-bed/2.0-bath single-family listed at $185k.
Deal economics
- At list price, monthly cash flow is $1k ($12k/yr) — positive.
- The deal already cash-flows at list — no discount required.
- Meets the 1% rule at list price ($3k rent vs $185k).
- Recommended offer: $182k (1.5% below list) — sets the bar for market timing.
- Cap rate 12.8% vs local median 5.0% in St. Louis — top-decile yield for the area; either an underpriced asset or a hidden risk that comps aren't pricing in. Stress-test before assuming the spread holds.
Location & tenants
- Location reads: area grade B — affects rentability + tenant quality, not the cash-flow math above.
- St. Louis City (urban): math 10% / reading 18% proficiency, ranked #312 of 324 in MO (top 96%) — low school quality limits family demand, transient renter base, plan for 1-2y turnover; 80% free/reduced lunch — lower-income household profile, screen leases tightly.
- Zoned schools: Mason Elem. (math 22% / reading 37%, grade F, #813 of 1,115 statewide, top 75%, 389 students, 99% FRL); Roosevelt High (math 2% / reading 8%, grade F, #517 of 521 statewide, top 100%, 460 students, 99% FRL) — zoned schools average 99% FRL vs 80% district-wide (19 pts higher); higher-poverty schools than district average — tighter screening recommended.
- Market conditions: Rents rising fast (+4.9%/yr); 58 active listings in the ZIP; 13 comparable units currently listed for rent nearby; rentals at typical pace (median 15d on market — plan ~3-4 weeks tenant-placement turnaround); solid renter incomes; 294 units permitted in St. Louis city in 2024 (227 in 5+ unit buildings).
- This rent runs 38% of the median local income ($91k/yr) — at the standard rent-burdened threshold; future hikes will face affordability resistance.
Forward outlook
- Local home prices are declining (-3.0%/yr); year-one equity from $1k of loan paydown is wiped out by about $6k of value loss. Plan a longer hold.
- St. Louis County population projected to shrink 6% by 2050 — rents likely to lag national; underwrite the cash flow, not the appreciation.
- At projected returns (-3.0% appreciation + 4.9% rent growth), your $52k cash investment doubles in ~5 years — after that, you're playing with house money.
Negotiation context
- It's been on market 30 days — a 2% lower offer ($182k) is reasonable based on typical stale-listing flexibility.
Risks & watch-outs
- Watch-outs: built in 1923 — expect roof / HVAC / electrical / plumbing capex.
- Climate carrying-cost: extreme-heat days projected 7→21/yr by 2055 (HVAC capex compounding) — expect insurance premiums to compound above CPI over the hold.
Questions for the listing agent
- Built in 1923 — when were the roof, HVAC, electrical panel, plumbing, and water heater last replaced?
- Is there a deadline driving the sale (1031 exchange, divorce, estate, relocation)? That informs how much negotiation room exists.
- What's the average days-on-market for RENTAL listings here right now (not sales)? A rising rental-DOM trend means longer vacancies and softer asking-rent achievability than the comps imply.
- What's the recent tenant-quality profile in this submarket — average credit score on applications, eviction rate, late-payment / NSF rate, and stable-employment percentage? A property-management company in the area should have these aggregated.
- How much new for-sale + rental construction is in the pipeline within 1–3 miles? Heavy new supply typically softens prices + rents 12–24 months out; constrained supply supports both.
Investment metrics
- 1% rule
- 1.56% ✓
- Cap rate
- 12.79%
- Cash-on-cash
- 23.21%
- DSCR
- 2.03
- GRM
- 5.3
CMA / ARV
- ARV (on-the-fly)
- $314,390
- Comps found
- 12
Show comp detail 12 sales within ~0.75 mi
| Address | Dist | Beds/Ba | Sqft | Sold | Price | $/sf | Match |
|---|---|---|---|---|---|---|---|
| 7040 Ethel Ave | 0.07mi | 3/1.5 (-1) | 1,472 (-1%) | 8mo | $289,900 | $197 | 81 |
| 7022 Ethel Ave | 0.04mi | 3/1.5 (-1) | 1,440 (-3%) | 8mo | $375,000 | $260 | 79 |
| 7051 Nashville Ave | 0.31mi | 3/2.0 (-1) | 1,542 (+4%) | 2mo | $335,000 | $217 | 73 |
| 1035 Central Ave | 0.18mi | 4/2.0 | 1,665 (+12%) | 1mo | $309,900 | $186 | 72 |
| 1111 Forest Ave | 0.15mi | 3/2.0 (-1) | 1,324 (-11%) | 3mo | $227,500 | $172 | 67 |
| 1115 Forest Ave | 0.15mi | 3/1.0 (-1) | 1,648 (+11%) | 0mo | $274,900 | $167 | 66 |
| 6815 Wise Ave | 0.22mi | 3/1.5 (-1) | 1,320 (-11%) | 3mo | $300,000 | $227 | 61 |
| 7469 Hoover Ave | 0.63mi | 3/2.0 (-1) | 1,512 (+2%) | 8mo | $389,900 | $258 | 57 |
| 6682 W Park Ave | 0.42mi | 3/2.0 (-1) | 1,597 (+7%) | 8mo | $279,900 | $175 | 56 |
| 7440 Wise Ave | 0.59mi | 3/1.5 (-1) | 1,416 (-5%) | 6mo | $299,000 | $211 | 52 |
| 1370 Mobile Ct | 0.68mi | 3/1.0 (-1) | 1,440 (-3%) | 2mo | $244,900 | $170 | 52 |
| 7235 El Moro Ave | 0.59mi | 3/2.5 (-1) | 1,655 (+11%) | 5mo | $399,900 | $242 | 43 |
Match score weights: distance 35% · size 25% · config 20% · recency 20%. Top-matched comps best support the ARV.
Projected returns pro-forma
-3.0% appreciation · 4.87% rent growth · sell at horizon
- IRR
- 18.3%
- Equity multiple
- 1.76×
- Total profit
- $39,405
- Equity at exit
- $27,584
- IRR
- 28.0%
- Equity multiple
- 3.71×
- Total profit
- $140,259
- Equity at exit
- $15,995
Cash invested: $51,800 (down + closing). Projections, not guarantees.
Landlord ↔ Tenant lean methodology
- Overall (STATE)
- 81 Strongly Landlord-Friendly
- State Missouri
- 81 Strongly Landlord-Friendly · R+10
- County
- — inherits STATE
- City
- — inherits STATE
ZIP-level market 63117
- Rents YoY
- 4.9%
- Active inventory
- 58
- Price-to-rent
- 5.3×
Monthly cashflow live
- Estimated rent
- $2,889 high interval (Pro) →
- Mortgage (P&I)
- −$970
- Tax from tax record
- −$234 /mo · $2,805/yr
- Insurance
- −$77
- HOA
- −$0
- Vacancy / Maint / Mgmt
- −$607
- Net cashflow
- $1,002
Break-even live
UW: 25.0% down · 7.5% · 30yr · 1.5% tax · 5.0% vac · 8.0% maint · 8.0% mgmt
Financing live
Cash to close
- Down payment
- $46,250
- Closing costs
- $5,550
- Reserves months
- —
- Total cash needed
- —
Loan-product check · same deal, 3 products live
Conventional
25% down · 7.5% · 30yr
- Down + closing
- —
- Monthly P&I
- —
- Monthly cashflow
- —
- DSCR
- —
- Eligible?
- —
Personal DTI + credit; lowest rate.
DSCR
20% down · 8.5% · 30yr
- Down + closing
- —
- Monthly P&I
- —
- Monthly cashflow
- —
- DSCR
- —
- Eligible?
- —
No personal income docs; deal must DSCR.
Hard money
10% down · 12.0% · 12mo
- Down + closing
- —
- Monthly P&I
- —
- Monthly cashflow
- —
- DSCR
- —
- Eligible?
- —
Short-term bridge; refi at stabilization.
Rent comps 13 comps
| Address | Beds | Baths | Sqft | Rent | $/sqft | DOM | Units | Dist |
|---|---|---|---|---|---|---|---|---|
| 6301 Southwood Ave Unit 3rd floor Clayton, MO | 4.0 | 2.0 | 1800 | $3,500 | $1.94 | 43d | 1 | 0.32mi |
| 6318 S Rosebury Ave Clayton, MO | 3.0 | 2.0 | 1712 | $2,600 | $1.52 | 14d | 1 | 0.36mi |
| 665 S Skinker Blvd Saint Louis, MO | 3.0 | 1.0–2.0 | 1080 | $3,500 | $3.24 | 16d | 40 | 0.42mi |
| 665 S Skinker Blvd Saint Louis, MO | 3.0 | 1.0–2.0 | 1080 | $3,045 | $2.82 | 1d | 43 | 0.42mi |
| 6328 Northwood Ave Unit 2nd floor Clayton, MO | 3.0 | 1.0 | 1700 | $2,950 | $1.74 | 23d | 1 | 0.45mi |
| 7103 Horner Ave Unit 7 Richmond Heights, MO | 3.0 | 2.5 | 1816 | $2,995 | $1.65 | 1d | 1 | 0.48mi |
| 1617 Forest Ave Saint Louis, MO | 3.0 | 2.5 | 1822 | $1,195 | $0.66 | 3d | 1 | 0.60mi |
| 6414 Wise Ave Unit 401 St. Louis, MO | 3.0 | 2.0 | 1850 | $2,500 | $1.35 | 43d | 1 | 0.72mi |
| 6723 Glades Ave Saint Louis, MO | 3.0 | 1.0 | 980 | $1,750 | $1.79 | 7d | 1 | 0.78mi |
| 5700 Highlands Plaza Dr Saint Louis, MO | 3.0 | 1.0–2.0 | 1029 | $4,100 | $3.98 | 2d | 24 | 1.28mi |
| 6186 Waterman Blvd Saint Louis, MO | 3.0 | 1.5 | 1100 | $3,000 | $2.73 | 3d | 1 | 1.32mi |
| 6023 Waterman Blvd Saint Louis, MO | 4.0 | 1.5 | 1200 | $3,800 | $3.17 | 43d | 1 | 1.41mi |
| 5920 McPherson Ave Unit 1st Floor St. Louis, MO | 3.0 | 1.0 | 1300 | $2,550 | $1.96 | 43d | 1 | 1.49mi |
Listing history 15 events
-
2026-06-18days on market $185,000 Active 30 DOM
-
2026-06-17days on market $185,000 Active 29 DOM
-
2026-06-16days on market $185,000 Active 28 DOM
-
2026-06-15days on market $185,000 Active 27 DOM
-
2026-06-13days on market $185,000 Active 25 DOM
-
2026-06-09days on market $185,000 Active 21 DOM
-
2026-06-08days on market $185,000 Active 20 DOM
-
2026-06-07days on market $185,000 Active 19 DOM
-
2026-06-05days on market $185,000 Active 16 DOM
-
2026-06-03days on market $185,000 Active 15 DOM
-
2026-06-02days on market $185,000 Active 14 DOM
-
2026-06-02price $185,000 Active 13 DOM
-
2026-06-01days on market $199,000 Active 13 DOM
-
2026-05-31days on market $199,000 Active 12 DOM
-
2026-05-19$199,900 Active
ⓘ Source: listings_history table (triggers on properties + properties_extension) + one-shot
backfill from property_details.listing_events for pre-trigger history.
Tax reassessment forecast MO · Resets to sale price
- Current annual tax
- $2,805 · $234/mo
- Projected year-2 tax
- $2,805 · $234/mo
- Expected delta
- $0/yr ($0/mo · 0.0%)
ⓘ Screening estimate from a state-policy table — verify with the county assessor before closing.
Climate risk First Street
- Flood 1/10 Low FEMA zone X (unshaded) · 0% chance over 30 yrs
- Wildfire 1/10 Low
- Heat 5/10 Major 7 d/yr ≥107°F today · 21 d/yr by 30 yrs out
- Wind 2/10 Low 100% chance of damaging wind over 30 yrs
- Air quality 3/10 Moderate 3 unhealthy d/yr today · 4 by 30 yrs out
Nearby sold comps map
Loading sold comps map…
Walkable amenities ~0.75 mi
Loading nearby amenities…
Taxation est. · year 1
- Rental income
- $34,674
- − Mortgage interest
- −$10,363
- − Property taxes
- −$2,805
- − Insurance
- −$925
- − Repairs & maintenance
- −$2,774
- − Management
- −$2,774
- − Depreciation
- −$5,382
- Taxable income
- $9,652
- Est. tax owed @ 24.0%
- −$2,316
- After-tax cash flow
- $9,704/yr
For passive investors: Depreciation is non-cash, so a rental often shows a tax loss while cash-flowing — sheltering income. Rental losses are passive: they offset passive income freely, and up to $25,000/yr can offset ordinary (W-2) income if you actively participate and your MAGI is under $100k (phasing out to $0 by $150k); unused losses carry forward. On sale, claimed depreciation is recaptured at up to 25%, and gains may owe capital-gains tax (a 1031 exchange can defer both). Figures are a year-1 estimate at your 24.0% rate — not tax advice; consult a CPA.
Schools (NCES district)
- District
- St. Louis City
- NCES district ID
- 2929280
- Math proficiency
- 10% ▼ -6.00%
- Reading proficiency
- 18% ▼ -3.00%
- Median HH income
- $35,685
- Composite
- 11.54/100
- National rank
- #9699
- State rank
- #312 of 324 in MO
Livability — St. Louis
No livability data for this city. (Only ~50 U.S. cities are tracked.)
Census & demographics
- Census place
- St. Louis, MO
- County
- Saint Louis County · 888,823 people
- City population
- 283,259
- Metro
- St. Louis, MO-IL
- Population (ZIP)
- 9,261
- Household income
- $90,921
- Rent vs Own
- Severe rent burden
- 285.0
Population outlook (St. Louis County) Hauer SSP2
- Today (2025)
- 315,737 people
- By 2030
- 313,865 · -0.6%
- By 2040
- 305,439 · -3.3%
- By 2050
- 296,529 · -6.1%
- By 2075
- 271,028 · -14.2%
- By 2100
- 255,359 · -19.1%
Race, ethnicity, and origin ACS 2023
- Neighborhood character
- Predominantly White (82%)
- Race & ethnicity
- White 82% Black 6% Two or more races 5% Asian 5% Hispanic / Latino 3%
- Common ancestry
- Slovak 5% Lithuanian 3% Romanian 3%
- Foreign-born
- 10% · Canada, China, Jamaica
- Languages at home
- 91% English-only · Chinese 3% Spanish 2% Russian/Polish/Slavic 1%
Political lean MEDSL · St. Louis
- 2024 margin
- Solid D (+64.7) · D 81.4% · R 16.7% · Other 2.0%
- 2008→2024 swing
- -3.5pp toward R · 2008: 68.2pp · 2024: 64.7pp
- All cycles
- 2024: D+64.7 2020: D+66.2 2016: D+63.7 2012: D+66.6 2008: D+68.2
Not yet ingested
- Civics
- —
Market trends
- HPI YoY
- ▼ -332.54%
- Current HPI
- 220.8603
- Rent YoY
- ▲ 4.87%
- Metro
- St. Louis, MO-IL
- State GDP YoY
- ▲ 1.84%
- F500 in state
- 20
Industry mix (Fortune 500 HQ in MO)
| Industry | F500 HQs | Revenue |
|---|---|---|
| Healthcare | 1 | $163B |
|
||
| Insurance | 1 | $21B |
|
||
| Industrial Technology | 1 | $17B |
|
||
| Retail | 1 | $16B |
|
||
| Industrial Distribution | 1 | $10B |
|
||
| Utilities | 1 | $9B |
|
||
Price history
1 event — show timeline
- 2026-05-19 Listed $199,900 MARIS as Distributed by MLS Grid
Property tax history
+5.1%/yrLatest (2024): $2,805 · +5.1% YoY. Source: county tax records.
Cash-flow waterfall
monthlySold comps — $/sqft
last 12 mo · ≤1 miLoading sold comps…