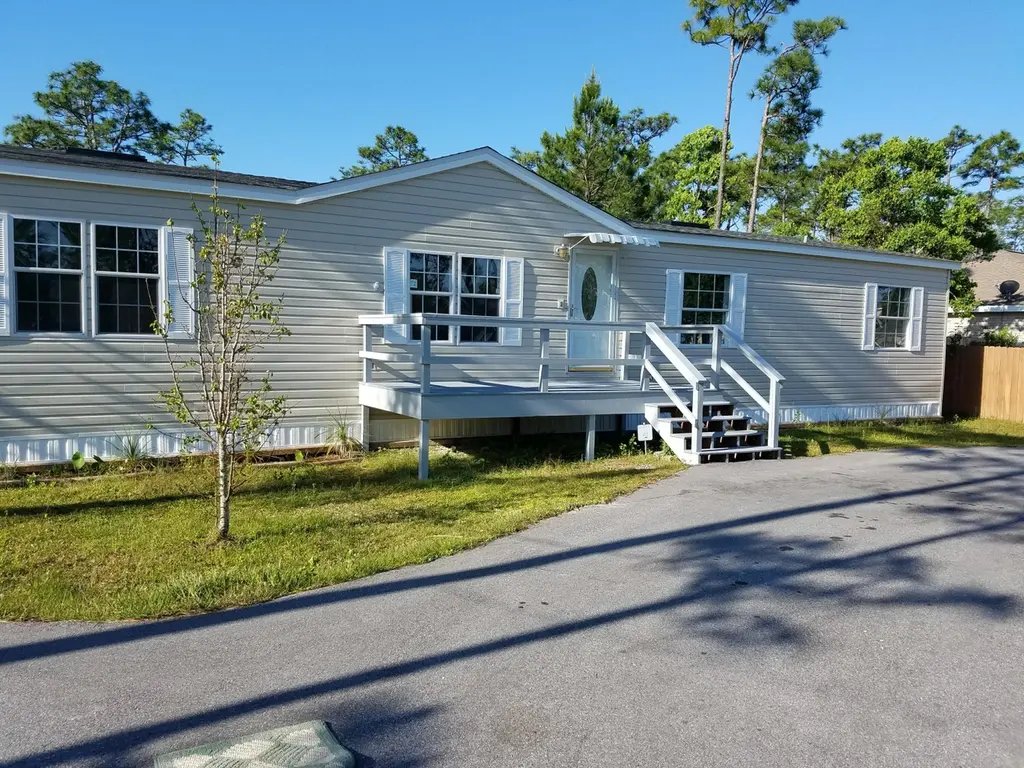
120 Las Roblas Grande Dr · Miramar Beach, FL
Flood risk 7/10 · Major
- FEMA flood zone
- X (unshaded)
- Chance of flooding over 30 yrs
- 0.94%
- Est. flood insurance / yr
- $507 – $1,088
Fire risk 3/10 · Minor
- Est. fire insurance / yr
- $947 – $1,759
Heat risk 10/10 · Severe
- Hot days now (above 104°F)
- 7 days/yr
- Hot days in 30 yrs
- 22 days/yr
Wind risk 9/10 · Severe
- Chance of severe wind over 30 yrs
- 99.0%
Air-quality risk 2/10 · Minimal
- Unhealthy air days now
- 0 days/yr
- Unhealthy air days in 30 yrs
- 1 days/yr
Risk factors via First Street. Map © Google.
Why this score? — see what drove the B- grade
The composite is a weighted blend of 9 inputs, each scored 0–100. Each bar is that input's sub-score; the figure is the points it added to the 100-point composite (weight × sub-score).
- Cash flow +30.0/30.0
- DSCR +10.0/10.0
- ARV discount +7.5/15.0
- 1% rule +7.4/10.0
- Schools +5.2/10.0
- Livability +3.4/5.0
- Condition / age +2.5/5.0
- Rent growth +1.6/5.0
- Appreciation +0.0/10.0
$250,000
🖨 Deal sheet 📄 Offer letter ✓ Due diligence
Listing remarks
Great price for the location!!! Nice Double wide MH in a fantastic location in highly desirable Santa Rosa Beach, close to the Sacred Heart Hospital complex, beach and state park. Lot backs up to state forest. Property has deeded water access to Mack Bayou at West end of LRG drive. Home is being sold ''As Is'' with right to inspect. This has been a great long term rental for the current owner.
Key facts
- 0.28 acre lot
- 5 parking spots
- Built 1998
Property features AI
Finance
- HOA & community: Deed access; Subdivision: BAYOU PINES UNREC 1ST ADDN
Exterior
- Parking: Driveway with 5 parking spaces
- Security: Smoke detectors
- Utilities: Public water; Public sewer; Electric service; Phone service; TV cable; Electric water heater
- Home design: Mobile home; One story; Built in 1998; Zoned for single-family residential; Total building area approximately 1984 sq ft
- Construction: Vinyl siding; Built 1998
- Exterior features: Private yard; Lawn pump; Open deck; Interior, level lot within 1/2 mile to water; City street frontage and city road access
Interior
- Kitchen: Dishwasher; Microwave
- Bedrooms: 3 bedrooms; Master bedroom on the first floor with walk-in closet
- Flooring: Laminate
- Bathrooms: 2 full bathrooms; Master bathroom with double vanity, garden tub, separate shower, and walk-in closet
- Heating & cooling: Central heating; Central air; Ceiling fans
- Interior features: Washer/dryer hookup; Skylights; Window treatments
- Laundry & utility: Washer; Dryer; Electric water heater; Dedicated laundry room on the first floor
Neighborhood map
What this means for you Summary
Snapshot
- This is a 3-bed/2.0-bath manufactured listed at $250k.
Deal economics
- At list price, monthly cash flow is $873 ($10k/yr) — positive.
- The deal already cash-flows at list — no discount required.
- Meets the 1% rule at list price ($3k rent vs $250k).
- Cap rate 10.8% vs local median 1.1% in Miramar Beach — top-decile yield for the area; either an underpriced asset or a hidden risk that comps aren't pricing in. Stress-test before assuming the spread holds.
Location & tenants
- Location reads 67/100 on livability (#569 in FL) — a middle-class / working-renter tenant base. Strengths: crime A+, housing A, employment A-; Watch: health & safety C-, amenities F, commute F.
- Walton (rural): math 62% / reading 61% proficiency, ranked #10 of 73 in FL (top 14%) — acceptable for families but not a draw, mixed tenant base, ~2y average lease.
- Zoned schools: Van R. Butler Elementary School (math 77% / reading 69%, grade A, #271 of 2,144 statewide, top 13%, 1,013 students, 30% FRL); South Walton High School (math 61% / reading 73%, grade B, #69 of 667 statewide, top 11%, 1,235 students, 20% FRL) — zoned schools average 25% FRL vs 48% district-wide (23 pts lower); this property's tenant base skews higher-income than the district average.
- Market conditions: Rents falling (-3.5%/yr); 1585 active listings in the ZIP; 14 comparable units currently listed for rent nearby; rentals at typical pace (median 21d on market — plan ~3-4 weeks tenant-placement turnaround); solid renter incomes; 2,883 units permitted in Walton County in 2024 (1,322 in 5+ unit buildings).
- This rent runs 34% of the median local income ($108k/yr) — at the standard rent-burdened threshold; future hikes will face affordability resistance.
Forward outlook
- Local home prices are declining (-3.0%/yr); year-one equity from $2k of loan paydown is wiped out by about $8k of value loss. Plan a longer hold.
- Walton County population projected at +46% by 2050 — long-run rental-demand tailwind backs the buy-and-hold thesis.
Negotiation context
- Only 13 days on market — expect competitive offers; lowballing is unlikely to land.
- 24 sale attempts since 22y ago with the ask held roughly flat each time — persistent listings suggest the price (not the market) is what's stuck; bring a comps-based counter.
- Current owner paid $140k; list at $250k implies a 79% gain — meaningful room to come down on a strong offer.
Risks & watch-outs
- Watch-outs: flood insurance adds $66/mo.
- Climate carrying-cost: major flood risk; severe wind risk, 99% chance of damaging wind over 30y; extreme-heat days projected 7→22/yr by 2055 (HVAC capex compounding) — expect insurance premiums to compound above CPI over the hold.
Questions for the listing agent
- What's the actual annual flood-insurance premium (NFIP or private), and is the property in a SFHA with mandatory coverage?
- Is there a deadline driving the sale (1031 exchange, divorce, estate, relocation)? That informs how much negotiation room exists.
- Schools are D-rated, which usually means shorter tenancies and higher turnover. Who's the typical renter profile here, and what's been the actual vacancy rate?
- What's the average days-on-market for RENTAL listings here right now (not sales)? A rising rental-DOM trend means longer vacancies and softer asking-rent achievability than the comps imply.
- What's the recent tenant-quality profile in this submarket — average credit score on applications, eviction rate, late-payment / NSF rate, and stable-employment percentage? A property-management company in the area should have these aggregated.
- How much new for-sale + rental construction is in the pipeline within 1–3 miles? Heavy new supply typically softens prices + rents 12–24 months out; constrained supply supports both.
Investment metrics
- 1% rule
- 1.24% ✓
- Cap rate
- 10.80%
- Cash-on-cash
- 16.11%
- DSCR
- 1.72
- GRM
- 6.7
CMA / ARV
No comps found within radius.
Projected returns pro-forma
-3.0% appreciation · 0.0% rent growth · sell at horizon
- IRR
- 2.3%
- Equity multiple
- 1.09×
- Total profit
- $5,980
- Equity at exit
- $37,276
- IRR
- 8.9%
- Equity multiple
- 1.59×
- Total profit
- $41,573
- Equity at exit
- $21,615
Cash invested: $70,000 (down + closing). Projections, not guarantees.
Landlord ↔ Tenant lean methodology
- Overall (STATE)
- 87 Strongly Landlord-Friendly
- State Florida
- 87 Strongly Landlord-Friendly · R+3
- County
- — inherits STATE
- City
- — inherits STATE
ZIP-level market 32459
- Home prices YoY
- -19.8%
- Rents YoY
- -3.5%
- Active inventory
- 1585
- Price-to-rent
- 6.7×
Monthly cashflow live
- Estimated rent
- $3,093 high interval (Pro) →
- Mortgage (P&I)
- −$1,311
- Tax from tax record
- −$89 /mo · $1,067/yr
- Insurance
- −$104
- Flood insurance flood zone
- −$66 /mo · $798/yr
- HOA
- −$0
- Vacancy / Maint / Mgmt
- −$650
- Net cashflow
- $873
Break-even live
UW: 25.0% down · 7.5% · 30yr · 1.5% tax · 5.0% vac · 8.0% maint · 8.0% mgmt
Financing live
Cash to close
- Down payment
- $62,500
- Closing costs
- $7,500
- Reserves months
- —
- Total cash needed
- —
Loan-product check · same deal, 3 products live
Conventional
25% down · 7.5% · 30yr
- Down + closing
- —
- Monthly P&I
- —
- Monthly cashflow
- —
- DSCR
- —
- Eligible?
- —
Personal DTI + credit; lowest rate.
DSCR
20% down · 8.5% · 30yr
- Down + closing
- —
- Monthly P&I
- —
- Monthly cashflow
- —
- DSCR
- —
- Eligible?
- —
No personal income docs; deal must DSCR.
Hard money
10% down · 12.0% · 12mo
- Down + closing
- —
- Monthly P&I
- —
- Monthly cashflow
- —
- DSCR
- —
- Eligible?
- —
Short-term bridge; refi at stabilization.
Rent comps 14 comps
| Address | Beds | Baths | Sqft | Rent | $/sqft | DOM | Units | Dist |
|---|---|---|---|---|---|---|---|---|
| 14 Marlin Ct Santa Rosa Beach, FL | 3.0 | 2.0 | 2141 | $2,250 | $1.05 | 21d | 1 | 0.36mi |
| 2469 Bungalo Ln Unit 1354366P Miramar Beach, FL | 3.0 | 3.5 | 1668 | $4,498 | $2.70 | 13d | 1 | 0.43mi |
| 44 Sandhill Pines Dr Lot 53 Santa Rosa Beach, FL | 3.0 | 2.5 | 1456 | $3,150 | $2.16 | 21d | 1 | 0.44mi |
| 40 Oaks Ct Santa Rosa Beach, FL | 4.0 | 3.5 | 2210 | $3,600 | $1.63 | 21d | 1 | 0.48mi |
| 28 E Wild Briar Rd Unit C Santa Rosa Beach, FL | 3.0 | 2.0 | 1968 | $3,500 | $1.78 | 21d | 1 | 0.50mi |
| 15 Blue Cove Dr Santa Rosa Beach, FL | 1.0–3.0 | 1.0–2.5 | 1075 | $2,677 | $2.49 | 13d | 23 | 0.55mi |
| 12 Sandy Cove Way Unit 1468396P SANTA RSA BCH, FL | 3.0 | 2.5 | 1689 | $3,093 | $1.83 | 21d | 1 | 0.63mi |
| 647 Goldsby Rd Santa Rosa Beach, FL | 1.0–3.0 | 1.0–3.0 | 1002 | $2,940 | $2.93 | 13d | 25 | 0.70mi |
| 15 Beacon Point Dr Santa Rosa Beach, FL | 4.0 | 4.0 | 2447 | $3,850 | $1.57 | 13d | 1 | 0.74mi |
| 31 Rearden Way Santa Rosa Beach, FL | 3.0 | 3.0 | 1870 | $2,850 | $1.52 | 21d | 1 | 0.82mi |
| 45 S Blue Heron Dr Santa Rosa Beach, FL | 4.0 | 3.0 | 2512 | $5,200 | $2.07 | 13d | 1 | 0.89mi |
| 17 Bald Eagle Ct Santa Rosa Beach, FL | 3.0 | 2.5 | 1588 | $2,195 | $1.38 | 21d | 1 | 0.92mi |
| 3 Talon Ct Santa Rosa Beach, FL | 3.0 | 2.0 | 1396 | $2,300 | $1.65 | 21d | 1 | 1.11mi |
| 93 Dune Lakes Cir Santa Rosa Beach, FL | 1.0–3.0 | 1.0–2.0 | 987 | $2,267 | $2.30 | 13d | 32 | 1.28mi |
Listing history 40 events
-
2026-05-13status Pending
-
2026-04-30$250,000 Active
-
2025-02-28historical $1,900
-
2025-02-25$1,900
-
2025-01-19historical $1,900
-
2025-01-16$1,900
-
2024-11-10historical $1,800
-
2024-11-06$1,800
-
2017-03-20soldstatus $140,000
-
2016-09-22historical
-
2016-06-30$164,900
-
2016-06-30$164,900
-
2015-12-04historical
-
2015-07-03$162,500
-
2015-07-03$162,500
-
2010-11-19soldstatus $60,000
-
2010-11-19soldstatus $60,000
-
2010-07-01$69,900
-
2010-07-01$69,900
-
2009-03-31historical
-
2009-01-11$129,300
-
2009-01-11$129,300
-
2009-01-08historical
-
2008-09-21$137,000
-
2008-09-21$137,000
-
2008-06-29historical
-
2008-05-12$189,000
-
2008-05-12$189,000
-
2006-08-21historical
-
2006-08-21historical
-
2006-02-21$175,000
-
2006-02-21$175,000
-
2006-02-20$222,500
-
2006-02-20$222,500
-
2005-09-06historical
-
2005-02-27historical
-
2004-12-12$200,000
-
2004-12-12$200,000
-
2004-11-26$310,000
-
2004-11-26$310,000
ⓘ Source: listings_history table (triggers on properties + properties_extension) + one-shot
backfill from property_details.listing_events for pre-trigger history.
Tax reassessment forecast FL · Resets to sale price
- Current annual tax
- $1,067 · $89/mo
- Projected year-2 tax
- $2,075 · $173/mo
- Expected delta
- +$1,008/yr (+$84/mo · 94.5%)
ⓘ Screening estimate from a state-policy table — verify with the county assessor before closing.
Climate risk First Street
- Flood 7/10 Severe FEMA zone X (unshaded) · 94% chance over 30 yrs
- Wildfire 3/10 Moderate
- Heat 10/10 Extreme 7 d/yr ≥104°F today · 22 d/yr by 30 yrs out
- Wind 9/10 Extreme 99% chance of damaging wind over 30 yrs
- Air quality 2/10 Low 0 unhealthy d/yr today · 1 by 30 yrs out
Nearby sold comps map
Loading sold comps map…
Walkable amenities ~0.75 mi
Loading nearby amenities…
Taxation est. · year 1
- Rental income
- $37,118
- − Mortgage interest
- −$14,004
- − Property taxes
- −$1,067
- − Insurance
- −$2,048
- − Repairs & maintenance
- −$2,969
- − Management
- −$2,969
- − Depreciation
- −$7,273
- Taxable income
- $6,788
- Est. tax owed @ 24.0%
- −$1,629
- After-tax cash flow
- $8,847/yr
For passive investors: Depreciation is non-cash, so a rental often shows a tax loss while cash-flowing — sheltering income. Rental losses are passive: they offset passive income freely, and up to $25,000/yr can offset ordinary (W-2) income if you actively participate and your MAGI is under $100k (phasing out to $0 by $150k); unused losses carry forward. On sale, claimed depreciation is recaptured at up to 25%, and gains may owe capital-gains tax (a 1031 exchange can defer both). Figures are a year-1 estimate at your 24.0% rate — not tax advice; consult a CPA.
Schools (NCES district)
- District
- Walton
- NCES district ID
- 1201980
- Math proficiency
- 62% ▼ -4.00%
- Reading proficiency
- 61% ▼ -2.00%
- Median HH income
- $46,794
- Composite
- 52.03/100
- National rank
- #1634
- State rank
- #10 of 73 in FL
Livability — Miramar Beach
- Score
- 67/100
- State rank
- #569
- US rank
- #10855
Category grades
Schools grade is shown separately in the Schools card above.
Census & demographics
- County
- Walton County · 70,839 people
- City population
- 8,486
- Metro
- Crestview-Fort Walton Beach-Destin, FL
- Population (ZIP)
- 23,522
- Household income
- $107,821
- Rent vs Own
- Severe rent burden
- 633.0
Population outlook (Walton County) Hauer SSP2
- Today (2025)
- 80,014 people
- By 2030
- 88,120 · +10.1%
- By 2040
- 103,537 · +29.4%
- By 2050
- 117,034 · +46.3%
- By 2075
- 143,901 · +79.8%
- By 2100
- 155,138 · +93.9%
Race, ethnicity, and origin ACS 2023
- Neighborhood character
- Predominantly White (84%)
- Race & ethnicity
- White 84% Hispanic / Latino 8% Two or more races 5% Asian 3%
- Hispanic origin (detail)
- Mexican 3% Puerto Rican 2% Cuban 1%
- Common ancestry
- Italian 3% Lithuanian 2% Slovak 2%
- Foreign-born
- 11% · Canada, China, Jamaica
- Languages at home
- 91% English-only · Spanish 4% Russian/Polish/Slavic 2% Other Indo-European 1%
Political lean MEDSL · Walton
- 2024 margin
- Solid R (+57.8) · D 20.7% · R 78.6%
- 2008→2024 swing
- -12.0pp toward R · 2008: -45.8pp · 2024: -57.8pp
- All cycles
- 2024: R+57.8 2020: R+51.7 2016: R+56.1 2012: R+52.0 2008: R+45.8
Not yet ingested
- Civics
- —
Market trends
- HPI YoY
- ▼ -91.08%
- Current HPI
- 368.4091
- Rent YoY
- ▼ -3.45%
- Metro
- Crestview-Fort Walton Beach-Destin, FL
- State GDP YoY
- ▲ 3.28%
- F500 in state
- 36
Industry mix (Fortune 500 HQ in FL)
| Industry | F500 HQs | Revenue |
|---|---|---|
| Industrial Technology | 2 | $29B |
|
||
| Insurance | 2 | $17B |
|
||
| Retail | 1 | $60B |
|
||
| Technology Distribution | 1 | $58B |
|
||
| Homebuilding | 1 | $35B |
|
||
| Technology Manufacturing | 1 | $35B |
|
||
Price history
-19.4% since first listed40 events — show timeline
- 2026-05-13 Pending — ECAR
- 2026-04-30 Listed $250,000 ECAR
- 2025-02-28 Rental Removed $1,900 Avail
- 2025-02-25 Listed for Rent $1,900 Avail
- 2025-01-19 Rental Removed $1,900 Avail
- 2025-01-16 Listed for Rent $1,900 Avail
- 2024-11-10 Rental Removed $1,800 Avail
- 2024-11-06 Listed for Rent $1,800 Avail
- 2017-03-20 Sold (Public Records) $140,000 Public Records
- 2016-09-22 Listing Removed — NAMLS
- 2016-06-30 Listed $164,900 NAMLS
- 2016-06-30 Listed $164,900 ECAR
- 2015-12-04 Listing Removed — NAMLS
- 2015-07-03 Listed $162,500 NAMLS
- 2015-07-03 Listed $162,500 ECAR
- 2010-11-19 Sold (MLS) $60,000 ECAR
- 2010-11-19 Sold (MLS) $60,000 NAMLS
- 2010-07-01 Listed $69,900 ECAR
- 2010-07-01 Listed $69,900 NAMLS
- 2009-03-31 Listing Removed — NAMLS
- 2009-01-11 Listed $129,300 NAMLS
- 2009-01-11 Listed $129,300 ECAR
- 2009-01-08 Listing Removed — NAMLS
- 2008-09-21 Listed $137,000 NAMLS
- 2008-09-21 Listed $137,000 ECAR
- 2008-06-29 Listing Removed — NAMLS
- 2008-05-12 Listed $189,000 NAMLS
- 2008-05-12 Listed $189,000 ECAR
- 2006-08-21 Listing Removed — NAMLS
- 2006-08-21 Listing Removed — NAMLS
- 2006-02-21 Listed $175,000 NAMLS
- 2006-02-21 Listed $175,000 ECAR
- 2006-02-20 Listed $222,500 NAMLS
- 2006-02-20 Listed $222,500 ECAR
- 2005-09-06 Listing Removed — NAMLS
- 2005-02-27 Listing Removed — NAMLS
- 2004-12-12 Listed $200,000 NAMLS
- 2004-12-12 Listed $200,000 ECAR
- 2004-11-26 Listed $310,000 NAMLS
- 2004-11-26 Listed $310,000 ECAR
Property tax history
+6.8%/yrLatest (2025): $1,067 · +11.3% YoY. Source: county tax records.
Cash-flow waterfall
monthlySold comps — $/sqft
last 12 mo · ≤1 miLoading sold comps…