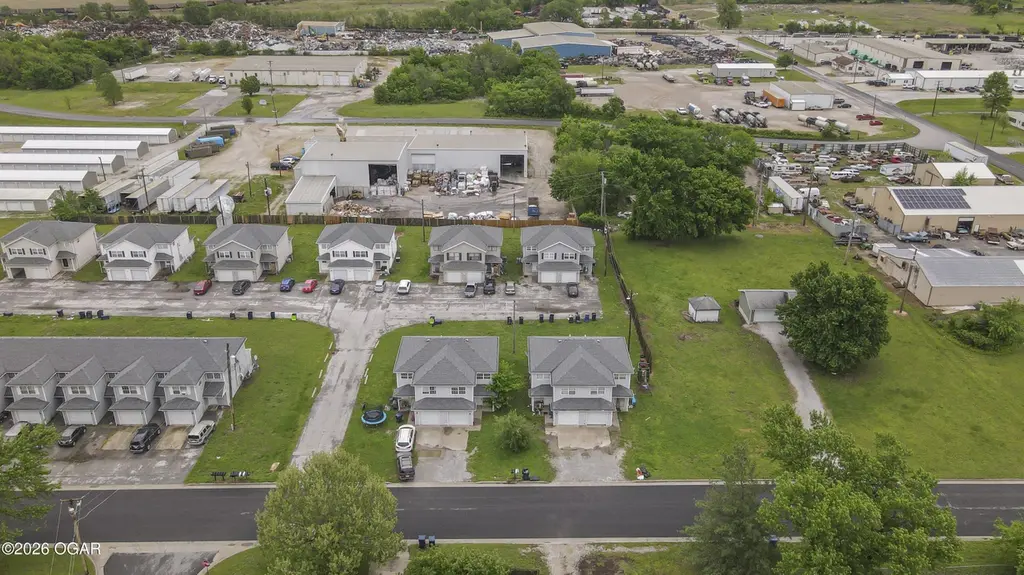
 Triplex
711-715 S Walker St · Webb City, MO
Flood risk 1/10 · Minimal
- FEMA flood zone
- X (unshaded)
- Chance of flooding over 30 yrs
- 0.0%
- Est. flood insurance / yr
- $507 – $1,088
Fire risk 4/10 · Minor
- Est. fire insurance / yr
- $1,054 – $1,958
Heat risk 5/10 · Moderate
- Hot days now (above 106°F)
- 7 days/yr
- Hot days in 30 yrs
- 20 days/yr
Wind risk 2/10 · Minimal
- Chance of severe wind over 30 yrs
- 2.0%
Air-quality risk 2/10 · Minimal
- Unhealthy air days now
- 1 days/yr
- Unhealthy air days in 30 yrs
- 1 days/yr
Risk factors via First Street. Map © Google.
Why this score? — see what drove the C- grade
The composite is a weighted blend of 9 inputs, each scored 0–100. Each bar is that input's sub-score; the figure is the points it added to the 100-point composite (weight × sub-score).
- Cash flow +18.7/30.0
- ARV discount +7.5/15.0
- DSCR +5.9/10.0
- 1% rule +5.0/10.0
- Schools +4.8/10.0
- Livability +3.9/5.0
- Rent growth +3.1/5.0
- Condition / age +2.2/5.0
- Appreciation +0.0/10.0
$440,000
🖨 Deal sheet (PDF) 📄 Offer letter ✓ Due diligence
Multi-family units
County records classify this as Multi-Family (2-4 Unit). Listing-text estimate: 3 units. confirmed
Listing remarks MLS
Three well-maintained duplexes and one sixplex located in Webb City, built in 2003 and offering four spacious units. Each unit features approximately 1,200 square feet with 3 bedrooms, 1.5 bathrooms, and a 1-car attached garage. Currently tenant-occupied, providing immediate rental income opportunity. Functional floor plans with comfortable living spaces, ample storage, and practical layouts ideal for long-term tenants. Schedule a private tour today!
Key facts
- 0.45 acre lot
- Built 2003
Property features AI
Finance
- Financial info: Annual tax information available
Exterior
- Utilities: Public sewer
- Home design: Residential income property with multiple buildings
- Exterior features: Shingle roof; Lot dimensions approximately 145 x 135
Interior
- Heating & cooling: Central heating (electric); Central cooling
- Interior features: Central heating; Electric heating; Central cooling
Neighborhood map
What this means for you Summary
Snapshot
- This is a 3 × 3-bed/?-bath units multifamily listed at $440k. Condition is rated fair.
Deal economics
- At list price, monthly cash flow is $438 ($5k/yr) — positive. Per door: $146/mo.
- The deal already cash-flows at list — no discount required.
- Meets the 1% rule at list price ($4k rent vs $440k).
Location & tenants
- Location reads 77/100 on livability (#35 in MO, #3,062 nationally) — a middle-class / working-renter tenant base. Strengths: cost of living A+, housing A+, health & safety A+; Watch: employment C-, amenities D-, commute F.
- Webb City R-VII (suburban): math 53% / reading 60% proficiency, ranked #21 of 324 in MO (top 6%) — acceptable for families but not a draw, mixed tenant base, ~2y average lease.
- Market conditions: Rents rising (+2.5%/yr); 122 active listings in the ZIP; 602 units permitted in Jasper County in 2024 (0 in 5+ unit buildings).
- At $4,403/mo this rent would consume 77% of the median local household income ($68k/yr) (locally 427% of renters already pay >50% of income on rent) — very limited rent-growth headroom before tenants either downsize or default.
Forward outlook
- Local home prices are declining (-3.0%/yr); year-one equity from $3k of loan paydown is wiped out by about $13k of value loss. Plan a longer hold.
Negotiation context
- Only 1 days on market — expect competitive offers; lowballing is unlikely to land.
- 2 sale attempts; this cycle's ask has dropped $880k (67%) from the opening price — seller is motivated, your offer sets the floor, not the list.
Risks & watch-outs
- Climate carrying-cost: extreme-heat days projected 7→20/yr by 2055 (HVAC capex compounding) — expect insurance premiums to compound above CPI over the hold.
Questions for the listing agent
- Can we see the unit-by-unit rent roll, current vacancy, and any below-market leases? What's the average tenancy length?
- What capital expenditures (roof, boiler, parking lot, exteriors) have been made in the last 5 years, and what's planned in the next 2?
- Have any recent inspections been done? Can we get a copy of the seller's disclosures and any deferred-maintenance estimates?
- Is there a deadline driving the sale (1031 exchange, divorce, estate, relocation)? That informs how much negotiation room exists.
- Schools are B-rated — typically a magnet for longer-tenancy family renters. What's the average tenant stay here, and is there a school-zone premium baked into asking?
- What's the average days-on-market for RENTAL listings here right now (not sales)? A rising rental-DOM trend means longer vacancies and softer asking-rent achievability than the comps imply.
- What's the recent tenant-quality profile in this submarket — average credit score on applications, eviction rate, late-payment / NSF rate, and stable-employment percentage? A property-management company in the area should have these aggregated.
- How much new apartment / multifamily construction is in the pipeline within 1–3 miles? Heavy new supply (>2% of stock underway) typically softens rents 12–24 months out; light construction supports rent growth.
Investment metrics
- 1% rule
- 1.00% ✓
- Cap rate
- 7.49%
- Cash-on-cash
- 4.26%
- DSCR
- 1.19
- GRM
- 8.3
CMA / ARV
No comps found within radius.
Projected returns pro-forma
-3.0% appreciation · 2.49% rent growth · sell at horizon
- IRR
- -10.2%
- Equity multiple
- 0.63×
- Total profit
- $-45,608
- Equity at exit
- $65,605
- IRR
- -1.5%
- Equity multiple
- 0.90×
- Total profit
- $-12,684
- Equity at exit
- $38,043
Cash invested: $123,200 (down + closing). Projections, not guarantees.
Landlord ↔ Tenant lean methodology
- Overall (STATE)
- 81 Strongly Landlord-Friendly
- State Missouri
- 81 Strongly Landlord-Friendly · R+10
- County
- — inherits STATE
- City
- — inherits STATE
ZIP-level market 64870
- Home prices YoY
- -8.3%
- Rents YoY
- 2.5%
- Active inventory
- 122
- Price-to-rent
- 25.0×
Monthly cashflow live
- Estimated rent
- $4,403 high interval (Pro) →
- Mortgage (P&I)
- −$2,307
- Tax est. 1.5%
- −$550 /mo · $6,600/yr
- Insurance
- −$183
- HOA
- −$0
- Vacancy / Maint / Mgmt
- −$925
- Net cashflow
- $438
Break-even live
Sensitivity live
| Price | -10% $742 | -5% $590 | +0% $438 | +5% $286 | +10% $134 |
|---|---|---|---|---|---|
| Rent | -10% $90 | -5% $264 | +0% $438 | +5% $612 | +10% $785 |
| Rate | -1.0pp $659 | -0.5pp $550 | base $438 | +0.5pp $324 | +1.0pp $208 |
3-unit breakdown (identical units grouped — click to expand)
| Units | Beds | Baths | Est. rent |
|---|---|---|---|
| 3× units | 3 | — | $4,404 |
| #1 | 3 | — | $1,468 |
| #2 | 3 | — | $1,468 |
| #3 | 3 | — | $1,468 |
| Total (3 units) | $4,403 | ||
UW: 25.0% down · 7.5% · 30yr · 1.5% tax · 5.0% vac · 8.0% maint · 8.0% mgmt
Financing live
Cash to close
- Down payment
- $110,000
- Closing costs
- $13,200
- Reserves months
- —
- Total cash needed
- —
Loan-product check · same deal, 3 products live
Conventional
25% down · 7.5% · 30yr
- Down + closing
- —
- Monthly P&I
- —
- Monthly cashflow
- —
- DSCR
- —
- Eligible?
- —
Personal DTI + credit; lowest rate.
DSCR
20% down · 8.5% · 30yr
- Down + closing
- —
- Monthly P&I
- —
- Monthly cashflow
- —
- DSCR
- —
- Eligible?
- —
No personal income docs; deal must DSCR.
Hard money
10% down · 12.0% · 12mo
- Down + closing
- —
- Monthly P&I
- —
- Monthly cashflow
- —
- DSCR
- —
- Eligible?
- —
Short-term bridge; refi at stabilization.
Listing history 4 events
-
2026-04-29status Pending
Show marketing remark (454 chars)
Three well-maintained duplexes and one sixplex located in Webb City, built in 2003 and offering four spacious units. Each unit features approximately 1,200 square feet with 3 bedrooms, 1.5 bathrooms, and a 1-car attached garage. Currently tenant-occupied, providing immediate rental income opportunity. Functional floor plans with comfortable living spaces, ample storage, and practical layouts ideal for long-term tenants. Schedule a private tour today!
-
2026-04-29status Pending 454-char remark
Show marketing remark (454 chars)
Three well-maintained duplexes and one sixplex located in Webb City, built in 2003 and offering four spacious units. Each unit features approximately 1,200 square feet with 3 bedrooms, 1.5 bathrooms, and a 1-car attached garage. Currently tenant-occupied, providing immediate rental income opportunity. Functional floor plans with comfortable living spaces, ample storage, and practical layouts ideal for long-term tenants. Schedule a private tour today!
-
2026-04-28$440,000 Active
Show marketing remark (454 chars)
Three well-maintained duplexes and one sixplex located in Webb City, built in 2003 and offering four spacious units. Each unit features approximately 1,200 square feet with 3 bedrooms, 1.5 bathrooms, and a 1-car attached garage. Currently tenant-occupied, providing immediate rental income opportunity. Functional floor plans with comfortable living spaces, ample storage, and practical layouts ideal for long-term tenants. Schedule a private tour today!
-
2026-04-28$1,320,000 Active 454-char remark
Show marketing remark (454 chars)
Three well-maintained duplexes and one sixplex located in Webb City, built in 2003 and offering four spacious units. Each unit features approximately 1,200 square feet with 3 bedrooms, 1.5 bathrooms, and a 1-car attached garage. Currently tenant-occupied, providing immediate rental income opportunity. Functional floor plans with comfortable living spaces, ample storage, and practical layouts ideal for long-term tenants. Schedule a private tour today!
ⓘ Source: listings_history table (triggers on properties + properties_extension) + one-shot
backfill from property_details.listing_events for pre-trigger history.
Climate risk First Street
- Flood 1/10 Low FEMA zone X (unshaded) · 0% chance over 30 yrs
- Wildfire 4/10 Moderate
- Heat 5/10 Major 7 d/yr ≥106°F today · 20 d/yr by 30 yrs out
- Wind 2/10 Low 2% chance of damaging wind over 30 yrs
- Air quality 2/10 Low 1 unhealthy d/yr today · 1 by 30 yrs out
Nearby sold comps map
Loading sold comps map…
Walkable amenities ~0.75 mi
Loading nearby amenities…
Taxation est. · year 1
- Rental income
- $52,836
- − Mortgage interest
- −$24,647
- − Property taxes
- −$6,600
- − Insurance
- −$2,200
- − Repairs & maintenance
- −$4,227
- − Management
- −$4,227
- − Depreciation
- −$12,800
- Taxable loss
- −$1,865
- Est. tax savings @ 24.0%
- +$448
- After-tax cash flow
- $5,699/yr
For passive investors: Depreciation is non-cash, so a rental often shows a tax loss while cash-flowing — sheltering income. Rental losses are passive: they offset passive income freely, and up to $25,000/yr can offset ordinary (W-2) income if you actively participate and your MAGI is under $100k (phasing out to $0 by $150k); unused losses carry forward. On sale, claimed depreciation is recaptured at up to 25%, and gains may owe capital-gains tax (a 1031 exchange can defer both). Figures are a year-1 estimate at your 24.0% rate — not tax advice; consult a CPA.
Condition & rehab AI · 13 photos
This multi-family property requires extensive repairs and maintenance to improve its condition and increase its value for both resale and rental.
Repairs flagged
- Major roof — The roof appears to be in poor condition, with visible damage and potential leaks.
- Major exterior siding — The exterior siding shows signs of wear and tear, with some areas appearing loose or damaged.
- Major flooring — The flooring in the garage appears to be in poor condition, with visible wear and potential structural issues.
- Major interior walls — The interior walls show signs of wear and potential damage, with some areas appearing loose or damaged.
- Major HVAC units — The HVAC units appear to be in poor condition, with visible rust and potential leaks.
Value-add opportunities
- Both repair and replace roof — Repairing and replacing the roof will improve the overall condition of the property and increase its value for both resale and rental.
- Both repair and replace exterior siding — Repairing and replacing the exterior siding will improve the overall condition of the property and increase its value for both resale and rental.
- Both repair and replace flooring — Repairing and replacing the flooring in the garage will improve the overall condition of the property and increase its value for both resale and rental.
- Both repair and replace interior walls — Repairing and replacing the interior walls will improve the overall condition of the property and increase its value for both resale and rental.
- Both repair and replace HVAC units — Repairing and replacing the HVAC units will improve the overall condition of the property and increase its value for both resale and rental.
Renovation cost estimate screening
| Repair item | Severity | Est. cost |
|---|---|---|
| roof · The roof appears to be in poor condition, with visible damage and potential leaks. | Major | $15,000–50,000 |
| exterior siding · The exterior siding shows signs of wear and tear, with some areas appearing loose or damaged. | Major | $15,000–50,000 |
| flooring · The flooring in the garage appears to be in poor condition, with visible wear and potential structural issues. | Major | $15,000–50,000 |
| interior walls · The interior walls show signs of wear and potential damage, with some areas appearing loose or damaged. | Major | $15,000–50,000 |
| HVAC units · The HVAC units appear to be in poor condition, with visible rust and potential leaks. | Major | $15,000–50,000 |
| Total estimated repair cost · 5 items | $75,000–250,000 |
Value-add ROI direction
- Both repair and replace roof — Repairing and replacing the roof will improve the overall condition of the property and increase its value for both resale and rental. ↑
- Both repair and replace exterior siding — Repairing and replacing the exterior siding will improve the overall condition of the property and increase its value for both resale and rental. ↑
- Both repair and replace flooring — Repairing and replacing the flooring in the garage will improve the overall condition of the property and increase its value for both resale and rental. ↑
- Both repair and replace interior walls — Repairing and replacing the interior walls will improve the overall condition of the property and increase its value for both resale and rental. ↑
- Both repair and replace HVAC units — Repairing and replacing the HVAC units will improve the overall condition of the property and increase its value for both resale and rental. ↑
ⓘ Cost ranges are severity-bucket heuristics (US national rule-of-thumb). Get contractor quotes + a written scope before underwriting a rehab budget.
Schools (NCES district)
- District
- Webb City R-VII
- NCES district ID
- 2931500
- Math proficiency
- 53% ▼ -1.00%
- Reading proficiency
- 60% ▼ -1.00%
- Median HH income
- $45,022
- Composite
- 47.68/100
- National rank
- #2244
- State rank
- #21 of 324 in MO
Livability — Webb City
- Score
- 77/100
- State rank
- #35
- US rank
- #3062
Category grades
Schools grade is shown separately in the Schools card above.
Census & demographics
- Census place
- Webb City, MO
- County
- Jasper County · 79,035 people
- City population
- 16,186
- Metro
- Joplin, MO
- Population (ZIP)
- 16,186
- Household income
- $68,300
- Rent vs Own
- Severe rent burden
- 427.0
Population outlook (Jasper County) Hauer SSP2
- Today (2025)
- 120,033 people
- By 2030
- 120,091 · +0.0%
- By 2040
- 119,297 · -0.6%
- By 2050
- 117,705 · -1.9%
- By 2075
- 110,402 · -8.0%
- By 2100
- 99,719 · -16.9%
Race, ethnicity, and origin ACS 2023
- Neighborhood character
- Predominantly White (86%)
- Race & ethnicity
- White 86% Two or more races 8% Hispanic / Latino 4% Asian 2% Black 2%
- Common ancestry
- Lithuanian 2% Slovak 2% Italian 2%
- Foreign-born
- 2% · Canada, China
- Languages at home
- 98% English-only · Spanish 1%
Political lean MEDSL · Jasper
- 2024 margin
- Solid R (+46.8) · D 25.9% · R 72.7% · Other 1.4%
- 2008→2024 swing
- -13.6pp toward R · 2008: -33.2pp · 2024: -46.8pp
- All cycles
- 2024: R+46.8 2020: R+46.2 2016: R+50.8 2012: R+41.0 2008: R+33.2
Not yet ingested
- Civics
- —
Market trends
- HPI YoY
- ▼ -24.29%
- Current HPI
- 267.5318
- Rent YoY
- ▲ 2.49%
- Metro
- Joplin, MO
- State GDP YoY
- ▲ 1.84%
- F500 in state
- 20
Industry mix (Fortune 500 HQ in MO)
| Industry | F500 HQs | Revenue |
|---|---|---|
| Healthcare | 1 | $163B |
|
||
| Insurance | 1 | $21B |
|
||
| Industrial Technology | 1 | $17B |
|
||
| Retail | 1 | $16B |
|
||
| Industrial Distribution | 1 | $10B |
|
||
| Utilities | 1 | $9B |
|
||
Price history
+200.0% since first listed4 events — show timeline
- 2026-04-29 Pending — OGAR
- 2026-04-29 Pending — OGAR
- 2026-04-28 Listed $1,320,000 OGAR
- 2026-04-28 Listed $440,000 OGAR
Cash-flow waterfall
monthlySold comps — $/sqft
last 12 mo · ≤1 miLoading sold comps…