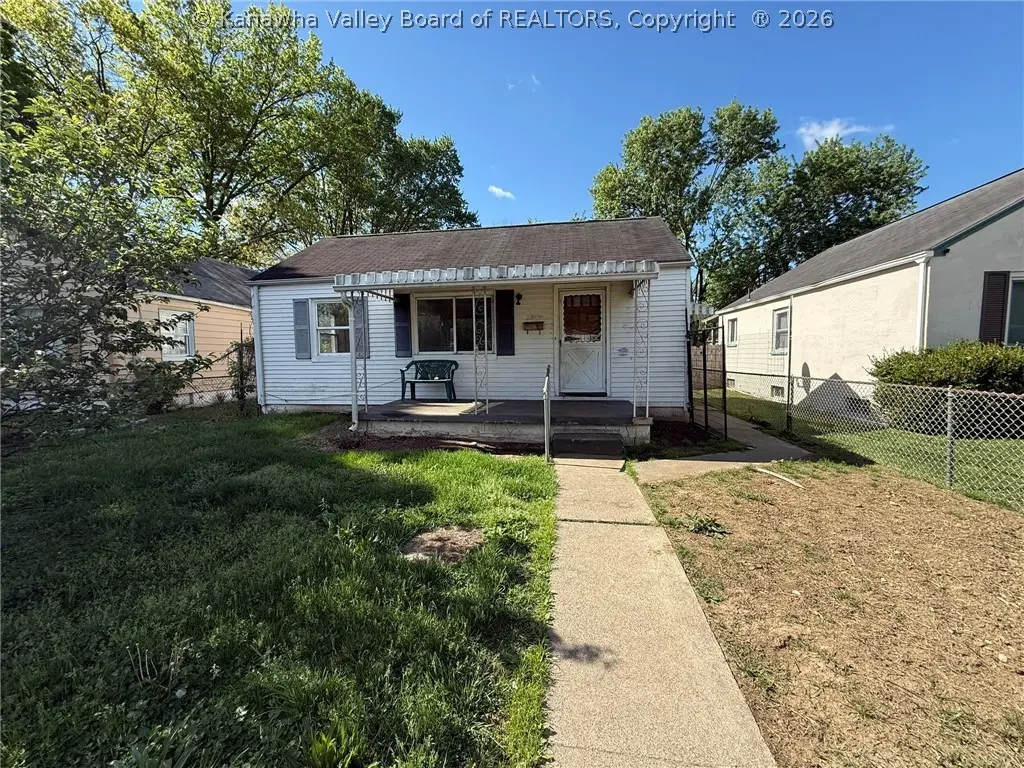
2509 Mckinley St · St. Albans, WV
Flood risk 10/10 · Severe
- FEMA flood zone
- X (shaded)
- Chance of flooding over 30 yrs
- 0.99%
- Est. flood insurance / yr
- $473 – $860
Fire risk 4/10 · Minor
- Est. fire insurance / yr
- $787 – $1,461
Heat risk 5/10 · Moderate
- Hot days now (above 101°F)
- 7 days/yr
- Hot days in 30 yrs
- 21 days/yr
Wind risk 2/10 · Minimal
- Chance of severe wind over 30 yrs
- 1.0%
Air-quality risk 2/10 · Minimal
- Unhealthy air days now
- 0 days/yr
- Unhealthy air days in 30 yrs
- 1 days/yr
Risk factors via First Street. Map © Google.
Why this score? — see what drove the B- grade
The composite is a weighted blend of 9 inputs, each scored 0–100. Each bar is that input's sub-score; the figure is the points it added to the 100-point composite (weight × sub-score).
- Cash flow +30.0/30.0
- 1% rule +10.0/10.0
- DSCR +10.0/10.0
- ARV discount +7.5/15.0
- Schools +2.9/10.0
- Rent growth +2.5/5.0
- Livability +2.5/5.0
- Condition / age +2.5/5.0
- Appreciation +0.0/10.0
$39,900
🖨 Deal sheet 📄 Offer letter ✓ Due diligence
Listing remarks
This house is an investors dream with so much potential. 2 bed, 1 bath, flat fenced yard. Great opportunity. Full unfinished basement with washer/dryer hookups. Sold as, seller will make no repairs. Great location in St. Albans.
Key facts
- Flat fenced yard
- 4,356 sq ft lot
- Built 1947
Tags
Property features AI
Exterior
- Utilities: Public water; Public sewer
- Home design: Single-family residence; Single-story
- Construction: Aluminum siding and plaster exterior; Composition/shingle roof
- Exterior features: Porch; Fenced yard
Interior
- Bedrooms: Total of 5 rooms (bedrooms and living areas combined)
- Flooring: Other flooring
- Bathrooms: 1 full bathroom
- Heating & cooling: Forced air heating
- Interior features: Insulated windows; Full basement
Neighborhood map
What this means for you Summary
Snapshot
- This is a 2-bed/1.0-bath single-family listed at $40k.
Deal economics
- At list price, monthly cash flow is $291 ($3k/yr) — positive.
- The deal already cash-flows at list — no discount required.
- Meets the 1% rule at list price ($846 rent vs $40k).
- Cap rate 16.7% vs local median 4.9% in St. Albans — top-decile yield for the area; either an underpriced asset or a hidden risk that comps aren't pricing in. Stress-test before assuming the spread holds.
Location & tenants
- Location reads: area grade B — affects rentability + tenant quality, not the cash-flow math above.
- Kanawha County Schools (suburban): math 29% / reading 40% proficiency, ranked #17 of 55 in WV (top 31%) — families likely to look elsewhere, expect single-tenant / working-renter base with shorter leases.
- Zoned schools: Alban Elementary School (math 32% / reading 37%, grade F, #148 of 377 statewide, top 49%, 253 students, 0% FRL); Hayes Middle School (math 24% / reading 39%, grade F, #52 of 109 statewide, top 49%, 436 students, 0% FRL); Saint Albans High School (math 32% / reading 57%, grade F, #11 of 110 statewide, top 11%, 993 students, 0% FRL) — zoned schools average 0% FRL vs 46% district-wide (46 pts lower); this property's tenant base skews higher-income than the district average.
- Market conditions: 116 active listings in the ZIP; 103 units permitted in Kanawha County in 2024 (0 in 5+ unit buildings).
Forward outlook
- Local home prices are declining (-3.0%/yr); year-one equity from $276 of loan paydown is wiped out by about $1k of value loss. Plan a longer hold.
- Kanawha County population projected at -17% by 2050 — secular population decline; favor cash flow + early exit over multi-decade hold.
- At projected returns (-3.0% appreciation + 3.0% rent growth), your $11k cash investment doubles in ~4 years — after that, you're playing with house money.
Negotiation context
- Only 13 days on market — expect competitive offers; lowballing is unlikely to land.
- Current owner paid $29k; 38% above their basis — modest negotiation headroom, anchor on the comps not their cost.
Risks & watch-outs
- Watch-outs: property tax is 2.9% of price; flood insurance adds $56/mo; built in 1947 — expect roof / HVAC / electrical / plumbing capex.
- Climate carrying-cost: severe flood risk; extreme-heat days projected 7→21/yr by 2055 (HVAC capex compounding) — expect insurance premiums to compound above CPI over the hold.
Questions for the listing agent
- Built in 1947 — when were the roof, HVAC, electrical panel, plumbing, and water heater last replaced?
- Property tax is high relative to price — has the assessment been appealed recently, and will the sale trigger a re-assessment?
- What's the actual annual flood-insurance premium (NFIP or private), and is the property in a SFHA with mandatory coverage?
- Is there a deadline driving the sale (1031 exchange, divorce, estate, relocation)? That informs how much negotiation room exists.
- What's the average days-on-market for RENTAL listings here right now (not sales)? A rising rental-DOM trend means longer vacancies and softer asking-rent achievability than the comps imply.
- What's the recent tenant-quality profile in this submarket — average credit score on applications, eviction rate, late-payment / NSF rate, and stable-employment percentage? A property-management company in the area should have these aggregated.
- How much new for-sale + rental construction is in the pipeline within 1–3 miles? Heavy new supply typically softens prices + rents 12–24 months out; constrained supply supports both.
Investment metrics
- 1% rule
- 2.12% ✓
- Cap rate
- 16.72%
- Cash-on-cash
- 37.24%
- DSCR
- 2.66
- GRM
- 3.9
CMA / ARV
- ARV (on-the-fly)
- $114,624
- Comps found
- 12
Show comp detail 12 sales within ~0.75 mi
| Address | Dist | Beds/Ba | Sqft | Sold | Price | $/sf | Match |
|---|---|---|---|---|---|---|---|
| 2326 Monroe Ave | 0.26mi | 3/1.0 (+1) | 800 (+0%) | 4mo | $115,000 | $144 | 79 |
| 2501 Harrison Ave | 0.11mi | 2/1.0 | 816 (+2%) | 19mo | $47,000 | $58 | 75 |
| 2614 Washington Ave | 0.20mi | 2/1.0 | 875 (+10%) | 1mo | $135,000 | $154 | 73 |
| 2237 Cleveland Ave | 0.37mi | 2/1.0 | 840 (+6%) | 2mo | $112,500 | $134 | 72 |
| 2231 Washington Ave | 0.37mi | 2/1.0 | 768 (-4%) | 7mo | $129,900 | $169 | 71 |
| 2313 Mckinley Ave | 0.24mi | 2/1.0 | 816 (+2%) | 23mo | $127,500 | $156 | 66 |
| 2121 Wilson Ave | 0.43mi | 2/1.0 | 720 (-10%) | 8mo | $90,000 | $125 | 58 |
| 2361 Cleveland Ave | 0.23mi | 2/1.0 | 896 (+13%) | 14mo | $129,150 | $144 | 56 |
| 1915 Wilson Ave | 0.73mi | 2/1.0 | 798 (+0%) | 13mo | $70,000 | $88 | 55 |
| 2404 Adams Ave | 0.10mi | 3/1.0 (+1) | 912 (+15%) | 22mo | $145,000 | $159 | 48 |
| 215 Alameda St | 0.46mi | 2/1.0 | 902 (+13%) | 24mo | $125,500 | $139 | 36 |
| 2115 Lincoln Ave | 0.45mi | 2/1.0 | 912 (+15%) | 23mo | $123,000 | $135 | 36 |
Match score weights: distance 35% · size 25% · config 20% · recency 20%. Top-matched comps best support the ARV.
Projected returns pro-forma
-3.0% appreciation · 3.0% rent growth · sell at horizon
- IRR
- 26.2%
- Equity multiple
- 2.09×
- Total profit
- $12,152
- Equity at exit
- $5,949
- IRR
- 33.9%
- Equity multiple
- 4.11×
- Total profit
- $34,764
- Equity at exit
- $3,450
Cash invested: $11,172 (down + closing). Projections, not guarantees.
Landlord ↔ Tenant lean methodology
- Overall (STATE)
- 83 Strongly Landlord-Friendly
- State West Virginia
- 83 Strongly Landlord-Friendly · R+22
- County
- — inherits STATE
- City
- — inherits STATE
ZIP-level market 25177
- Home prices YoY
- -16.6%
- Active inventory
- 116
- Price-to-rent
- 3.9×
Monthly cashflow live
- Estimated rent
- $846 medium interval (Pro) →
- Mortgage (P&I)
- −$209
- Tax from tax record
- −$96 /mo · $1,148/yr
- Insurance
- −$17
- Flood insurance flood zone
- −$56 /mo · $666/yr
- HOA
- −$0
- Vacancy / Maint / Mgmt
- −$178
- Net cashflow
- $291
Break-even live
UW: 25.0% down · 7.5% · 30yr · 1.5% tax · 5.0% vac · 8.0% maint · 8.0% mgmt
Financing live
Cash to close
- Down payment
- $9,975
- Closing costs
- $1,197
- Reserves months
- —
- Total cash needed
- —
Loan-product check · same deal, 3 products live
Conventional
25% down · 7.5% · 30yr
- Down + closing
- —
- Monthly P&I
- —
- Monthly cashflow
- —
- DSCR
- —
- Eligible?
- —
Personal DTI + credit; lowest rate.
DSCR
20% down · 8.5% · 30yr
- Down + closing
- —
- Monthly P&I
- —
- Monthly cashflow
- —
- DSCR
- —
- Eligible?
- —
No personal income docs; deal must DSCR.
Hard money
10% down · 12.0% · 12mo
- Down + closing
- —
- Monthly P&I
- —
- Monthly cashflow
- —
- DSCR
- —
- Eligible?
- —
Short-term bridge; refi at stabilization.
Listing history 3 events
-
2026-05-04status Pending
-
2026-04-20$39,900 Active
-
1984-11-16soldstatus $29,000
ⓘ Source: listings_history table (triggers on properties + properties_extension) + one-shot
backfill from property_details.listing_events for pre-trigger history.
Tax reassessment forecast WV · Resets to sale price
- Current annual tax
- $1,148 · $96/mo
- Projected year-2 tax
- $1,148 · $96/mo
- Expected delta
- $0/yr ($0/mo · 0.0%)
ⓘ Screening estimate from a state-policy table — verify with the county assessor before closing.
Climate risk First Street
- Flood 10/10 Extreme FEMA zone X (shaded) · 99% chance over 30 yrs
- Wildfire 4/10 Moderate
- Heat 5/10 Major 7 d/yr ≥101°F today · 21 d/yr by 30 yrs out
- Wind 2/10 Low 100% chance of damaging wind over 30 yrs
- Air quality 2/10 Low 0 unhealthy d/yr today · 1 by 30 yrs out
Nearby sold comps map
Loading sold comps map…
Walkable amenities ~0.75 mi
Loading nearby amenities…
Taxation est. · year 1
- Rental income
- $10,150
- − Mortgage interest
- −$2,235
- − Property taxes
- −$1,148
- − Insurance
- −$866
- − Repairs & maintenance
- −$812
- − Management
- −$812
- − Depreciation
- −$1,161
- Taxable income
- $3,116
- Est. tax owed @ 24.0%
- −$748
- After-tax cash flow
- $2,746/yr
For passive investors: Depreciation is non-cash, so a rental often shows a tax loss while cash-flowing — sheltering income. Rental losses are passive: they offset passive income freely, and up to $25,000/yr can offset ordinary (W-2) income if you actively participate and your MAGI is under $100k (phasing out to $0 by $150k); unused losses carry forward. On sale, claimed depreciation is recaptured at up to 25%, and gains may owe capital-gains tax (a 1031 exchange can defer both). Figures are a year-1 estimate at your 24.0% rate — not tax advice; consult a CPA.
Schools (NCES district)
- District
- Kanawha County Schools
- NCES district ID
- 5400600
- Math proficiency
- 29% ▼ -13.00%
- Reading proficiency
- 40% ▼ -7.00%
- Median HH income
- $44,329
- Composite
- 29.35/100
- National rank
- #6540
- State rank
- #17 of 55 in WV
Livability — St. Albans
No livability data for this city. (Only ~50 U.S. cities are tracked.)
Census & demographics
- Census place
- St. Albans, WV
- Population (ZIP)
- 23,211
Population outlook (Kanawha County) Hauer SSP2
- Today (2025)
- 178,946 people
- By 2030
- 172,906 · -3.4%
- By 2040
- 159,874 · -10.7%
- By 2050
- 148,148 · -17.2%
- By 2075
- 123,257 · -31.1%
- By 2100
- 96,454 · -46.1%
Race, ethnicity, and origin ACS 2023
- Neighborhood character
- Predominantly White (89%)
- Race & ethnicity
- White 89% Two or more races 5% Black 5% Hispanic / Latino 1%
- Common ancestry
- Serbian 2% Italian 2% Slovak 1%
- Foreign-born
- 0%
Political lean MEDSL · Kanawha
- 2024 margin
- R (+17.4) · D 40.2% · R 57.6% · Other 2.2%
- 2008→2024 swing
- -17.0pp toward R · 2008: -0.4pp · 2024: -17.4pp
- All cycles
- 2024: R+17.4 2020: R+14.7 2016: R+20.6 2012: R+11.9 2008: R+0.4
Not yet ingested
- Civics
- —
Market trends
- HPI YoY
- ▼ -36.96%
- Current HPI
- 185.502
- Rent YoY
- —
- Metro
- —
- State GDP YoY
- —
- F500 in state
- 0
Price history
+37.6% since first listed3 events — show timeline
- 2026-05-04 Pending — KVBOR
- 2026-04-20 Listed $39,900 KVBOR
- 1984-11-16 Sold (Public Records) $29,000 Public Records
Property tax history
+3.3%/yrLatest (2025): $1,148 · +0.0% YoY. Source: county tax records.
Cash-flow waterfall
monthlySold comps — $/sqft
last 12 mo · ≤1 miLoading sold comps…