 Duplex
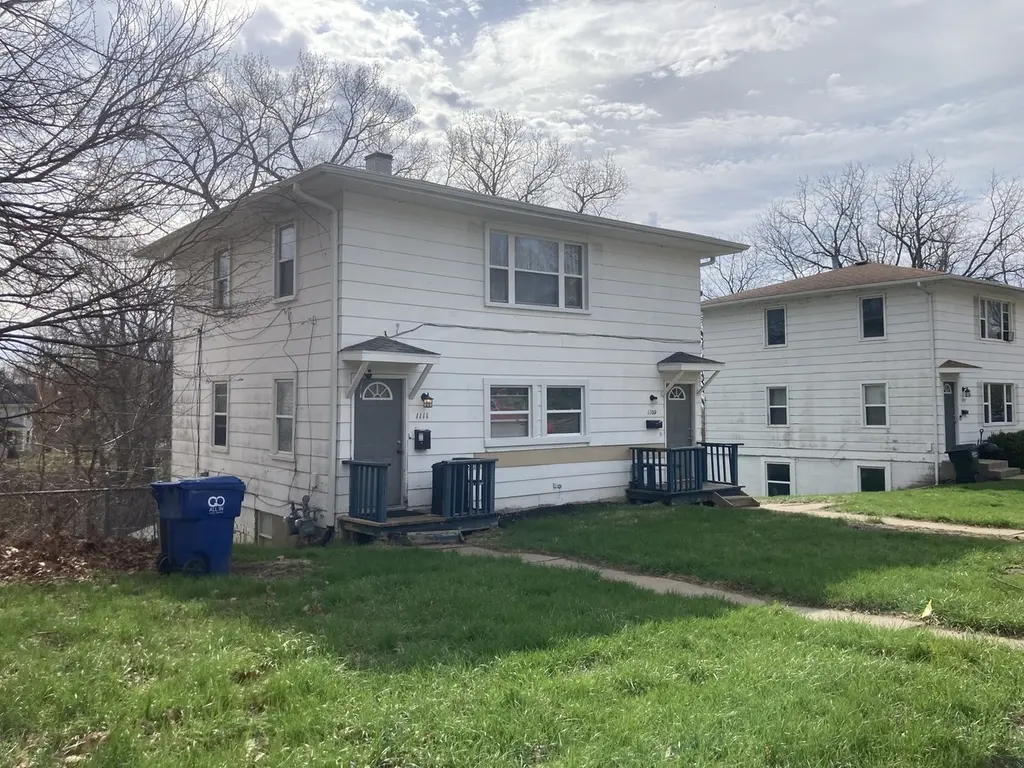
1109 Tremont Ave · Davenport, IA
Flood risk 1/10 · Minimal
- FEMA flood zone
- X (unshaded)
- Chance of flooding over 30 yrs
- 0.0%
- Est. flood insurance / yr
- $473 – $860
Fire risk 1/10 · Minimal
- Est. fire insurance / yr
- $902 – $1,676
Heat risk 3/10 · Minor
- Hot days now (above 103°F)
- 7 days/yr
- Hot days in 30 yrs
- 16 days/yr
Wind risk 2/10 · Minimal
- Chance of severe wind over 30 yrs
- —
Air-quality risk 3/10 · Minor
- Unhealthy air days now
- 2 days/yr
- Unhealthy air days in 30 yrs
- 3 days/yr
Risk factors via First Street. Map © Google.
Why this score? — see what drove the B grade
The composite is a weighted blend of 9 inputs, each scored 0–100. Each bar is that input's sub-score; the figure is the points it added to the 100-point composite (weight × sub-score).
- Cash flow +30.0/30.0
- DSCR +10.0/10.0
- 1% rule +9.8/10.0
- ARV discount +7.5/15.0
- Livability +4.0/5.0
- Schools +3.9/10.0
- Rent growth +3.6/5.0
- Condition / age +2.5/5.0
- Appreciation +0.0/10.0
$107,000
🖨 Deal sheet (PDF) 📄 Offer letter ✓ Due diligence
Multi-family units
County records classify this as Multi-Family (2-4 Unit). Listing-text estimate: 2 units. confirmed
Listing remarks MLS
This 2 unit up and down duplex has a 2 car garage. 1 new water heater installed in 2017. Updates on main level: new windows, appliances, bath and kitchen. Some new doors: side door and basement door. To be sold "AS IS". Garage is not included in rent. Upstairs tenant has been there for many years. Appliances not warranted.
Key facts
- Upper lower duplex
- Major updates
- New garage door
Tags
Property features AI
Finance
- Other: Two units in building; Security deposits: $425 (first-floor unit), $500 (second-floor unit); Current rents listed as $500 for each unit; Tenants pay electric, gas, heat, sewer, and water; School bus service available
- Financial info: Gross rental income reported as $12,600; Insurance expense reported as $1,256
- HOA & community:
Exterior
- Parking:
- Security:
- Utilities: Public water; Public sewer
- Home design: Two- to four-unit property; Fee simple ownership; Unincorporated location
- Construction: Masonite exterior; Asphalt roof; Block foundation; Built approximately 51–60 years ago; Built before 1978
- Exterior features: Sloped lot; Lot dimensions approximately 64 x 150
Interior
- Kitchen: Each unit includes a stove and refrigerator
- Bedrooms: Two 1-bedroom units (one on first floor, one on second floor)
- Flooring: Hardwood floors in both units
- Bathrooms: Two full bathrooms (one in each unit)
- Heating & cooling: Natural gas forced air heating
- Interior features: 8 total rooms; Unfinished full basement
- Laundry & utility: First-floor unit has laundry hook-up
Neighborhood map
What this means for you Summary
Snapshot
- This is a 2 × 1-bed/1-bath units multifamily listed at $107k.
Deal economics
- At list price, monthly cash flow is $518 ($6k/yr) — positive. Per door: $259/mo.
- The deal already cash-flows at list — no discount required.
- Meets the 1% rule at list price ($2k rent vs $107k).
- Cap rate 12.1% vs local median 4.4% in Davenport — top-decile yield for the area; either an underpriced asset or a hidden risk that comps aren't pricing in. Stress-test before assuming the spread holds.
Location & tenants
- Location reads 79/100 on livability (#126 in IA, #2,312 nationally) — a middle-class / working-renter tenant base. Strengths: cost of living A+, housing A+, health & safety A+; Watch: employment C-, crime F.
- Davenport Community School District (urban): math 43% / reading 50% proficiency, ranked #288 of 289 in IA (top 100%) — families likely to look elsewhere, expect single-tenant / working-renter base with shorter leases.
- Market conditions: Rents rising fast (+4.6%/yr); 160 active listings in the ZIP; 21 comparable units currently listed for rent nearby; rentals at typical pace (median 22d on market — plan ~3-4 weeks tenant-placement turnaround); 48% of comp listings sitting > 30 days — soft ceiling on asking rent; 805 units permitted in Scott County in 2024 (479 in 5+ unit buildings).
Forward outlook
- Local home prices are declining (-3.0%/yr); year-one equity from $740 of loan paydown is wiped out by about $3k of value loss. Plan a longer hold.
- Scott County population projected at +19% by 2050 — long-run rental-demand tailwind backs the buy-and-hold thesis.
- At projected returns (-3.0% appreciation + 4.6% rent growth), your $30k cash investment doubles in ~6 years — after that, you're playing with house money.
Negotiation context
- Only 10 days on market — expect competitive offers; lowballing is unlikely to land.
- 5 sale attempts since 12y ago with the ask held roughly flat each time — persistent listings suggest the price (not the market) is what's stuck; bring a comps-based counter.
- Current owner paid $50k; list at $107k implies a 114% gain — meaningful room to come down on a strong offer.
Questions for the listing agent
- Can we see the unit-by-unit rent roll, current vacancy, and any below-market leases? What's the average tenancy length?
- What capital expenditures (roof, boiler, parking lot, exteriors) have been made in the last 5 years, and what's planned in the next 2?
- Built in 1966 — when were the roof, HVAC, electrical panel, plumbing, and water heater last replaced?
- Is there a deadline driving the sale (1031 exchange, divorce, estate, relocation)? That informs how much negotiation room exists.
- Crime grade is F in this area — have there been break-ins, vandalism, or insurance claims at this property in the last 3 years? What carrier currently insures it and at what premium?
- What's the average days-on-market for RENTAL listings here right now (not sales)? A rising rental-DOM trend means longer vacancies and softer asking-rent achievability than the comps imply.
- What's the recent tenant-quality profile in this submarket — average credit score on applications, eviction rate, late-payment / NSF rate, and stable-employment percentage? A property-management company in the area should have these aggregated.
- How much new apartment / multifamily construction is in the pipeline within 1–3 miles? Heavy new supply (>2% of stock underway) typically softens rents 12–24 months out; light construction supports rent growth.
Investment metrics
- 1% rule
- 1.48% ✓
- Cap rate
- 12.10%
- Cash-on-cash
- 20.75%
- DSCR
- 1.92
- GRM
- 5.6
CMA / ARV
No comps found within radius.
Projected returns pro-forma
-3.0% appreciation · 4.57% rent growth · sell at horizon
- IRR
- 14.9%
- Equity multiple
- 1.61×
- Total profit
- $18,214
- Equity at exit
- $15,954
- IRR
- 24.7%
- Equity multiple
- 3.31×
- Total profit
- $69,191
- Equity at exit
- $9,251
Cash invested: $29,960 (down + closing). Projections, not guarantees.
Landlord ↔ Tenant lean methodology
- Overall (STATE)
- 83 Strongly Landlord-Friendly
- State Iowa
- 83 Strongly Landlord-Friendly · R+6
- County
- — inherits STATE
- City
- — inherits STATE
ZIP-level market 52803
- Home prices YoY
- -34.5%
- Rents YoY
- 4.6%
- Active inventory
- 160
- Price-to-rent
- 11.3×
Monthly cashflow live
- Estimated rent
- $1,584 high interval (Pro) →
- Mortgage (P&I)
- −$561
- Tax from tax record
- −$128 /mo · $1,532/yr
- Insurance
- −$45
- HOA
- −$0
- Vacancy / Maint / Mgmt
- −$333
- Net cashflow
- $518
Break-even live
Sensitivity live
| Price | -10% $579 | -5% $548 | +0% $518 | +5% $488 | +10% $457 |
|---|---|---|---|---|---|
| Rent | -10% $393 | -5% $455 | +0% $518 | +5% $581 | +10% $643 |
| Rate | -1.0pp $572 | -0.5pp $545 | base $518 | +0.5pp $490 | +1.0pp $462 |
2-unit breakdown (identical units grouped — click to expand)
| Units | Beds | Baths | Est. rent |
|---|---|---|---|
| 2× units | 1 | 1 | $1,584 |
| #1 | 1 | 1 | $792 |
| #2 | 1 | 1 | $792 |
| Total (2 units) | $1,584 | ||
UW: 25.0% down · 7.5% · 30yr · 1.5% tax · 5.0% vac · 8.0% maint · 8.0% mgmt
Financing live
Cash to close
- Down payment
- $26,750
- Closing costs
- $3,210
- Reserves months
- —
- Total cash needed
- —
Loan-product check · same deal, 3 products live
Conventional
25% down · 7.5% · 30yr
- Down + closing
- —
- Monthly P&I
- —
- Monthly cashflow
- —
- DSCR
- —
- Eligible?
- —
Personal DTI + credit; lowest rate.
DSCR
20% down · 8.5% · 30yr
- Down + closing
- —
- Monthly P&I
- —
- Monthly cashflow
- —
- DSCR
- —
- Eligible?
- —
No personal income docs; deal must DSCR.
Hard money
10% down · 12.0% · 12mo
- Down + closing
- —
- Monthly P&I
- —
- Monthly cashflow
- —
- DSCR
- —
- Eligible?
- —
Short-term bridge; refi at stabilization.
Rent comps 21 comps
| Address | Beds | Baths | Sqft | Rent | $/sqft | DOM | Units | Dist |
|---|---|---|---|---|---|---|---|---|
| 736 Federal St Davenport, IA | 1.0–3.0 | 1.0–2.0 | 1186 | $1,868 | $1.57 | 21d | 1 | 0.41mi |
| 616 E 6th St Davenport, IA | 4.0 | 1.0 | 1578 | $1,712 | $1.08 | 44d | 1 | 0.42mi |
| 1527 Fulton Ct Davenport, IA | 4.0 | 2.0 | 1850 | $1,775 | $0.96 | 44d | 1 | 0.57mi |
| 119 E 13th St Davenport, IA | 3.0 | 1.0 | 1728 | $1,495 | $0.87 | 44d | 1 | 0.65mi |
| 511 Pershing Ave Unit 106E Davenport, IA | 3.0 | 2.0 | 1349 | $1,996 | $1.48 | 44d | 1 | 0.66mi |
| 511 Pershing Ave Unit 301E Davenport, IA | 3.0 | 2.0 | 1429 | $2,126 | $1.49 | 44d | 1 | 0.66mi |
| 427 Pershing Ave Davenport, IA | 3.0 | 2.0 | 1438 | $2,288 | $1.59 | 14d | 3 | 0.68mi |
| 1812 Pershing Ave Unit 1 Davenport, IA | 3.0 | 1.0 | 1000 | $1,200 | $1.20 | 21d | 1 | 0.71mi |
| 1421 N Main St #2 Davenport, IA | 3.0 | 1.0 | 1350 | $1,095 | $0.81 | 44d | 1 | 0.78mi |
| 427 N Brady St Unit 1 Davenport, IA | 3.0 | 1.5 | 1126 | $1,359 | $1.21 | 44d | 1 | 0.80mi |
| 401 Brady St Davenport, IA | 1.0–3.0 | 1.0–2.0 | 870 | $2,100 | $2.41 | 14d | 2 | 0.84mi |
| 2209 Farnam St Unit 2211 Davenport, IA | 3.0 | 1.0 | 1138 | $1,050 | $0.92 | 21d | 1 | 0.84mi |
| 212 N Brady St Davenport, IA | 2.0–3.0 | 2.0–3.0 | 1428 | $2,600 | $1.82 | 14d | 4 | 0.94mi |
| 1511 N Ripley St Davenport, IA | 4.0 | 2.0 | 1872 | $1,450 | $0.77 | 21d | 1 | 0.95mi |
| 537 W 16th St Davenport, IA | 3.0 | 1.0 | 1311 | $1,400 | $1.07 | 44d | 1 | 1.11mi |
| 1323 N Gaines St Davenport, IA | 4.0 | 2.0 | 1733 | $1,350 | $0.78 | 21d | 1 | 1.13mi |
| 621 W 15th St Davenport, IA | 4.0 | 2.0 | 1833 | $1,500 | $0.82 | 14d | 1 | 1.14mi |
| 2220 E Lombard St Davenport, IA | 3.0 | 2.0 | 1500 | $1,620 | $1.08 | 44d | 1 | 1.16mi |
| 1315 Brown St Unit 2 Davenport, IA | 3.0 | 1.0 | 1300 | $1,250 | $0.96 | 21d | 1 | 1.21mi |
| 915 W 14th St Davenport, IA | 3.0 | 1.0 | 1390 | $900 | $0.65 | 44d | 1 | 1.34mi |
| 2809 N Main St Davenport, IA | 3.0 | 1.5 | 1000 | $1,350 | $1.35 | 21d | 1 | 1.45mi |
Listing history 12 events
-
2026-05-01status Pending
-
2026-04-21$107,000 Active
-
2021-08-06historical
-
2018-04-20soldstatus $50,000 334-char remark
Show marketing remark (334 chars)
This 2 unit up and down duplex has a 2 car garage. 1 new water heater installed in 2017. Updates on main level: new windows, appliances, bath and kitchen. Some new doors: side door and basement door. To be sold "AS IS". Garage is not included in rent. Upstairs tenant has been there for many years. Appliances not warranted.
-
2018-02-11$59,900 334-char remark
Show marketing remark (334 chars)
This 2 unit up and down duplex has a 2 car garage. 1 new water heater installed in 2017. Updates on main level: new windows, appliances, bath and kitchen. Some new doors: side door and basement door. To be sold "AS IS". Garage is not included in rent. Upstairs tenant has been there for many years. Appliances not warranted.
-
2014-04-30soldstatus $40,000
-
2014-04-30soldstatus $40,000
-
2014-02-09$45,000
-
2014-02-09$45,000
-
2013-12-18historical
ⓘ Source: listings_history table (triggers on properties + properties_extension) + one-shot
backfill from property_details.listing_events for pre-trigger history.
Tax reassessment forecast IA · Partial reset (capped growth)
- Current annual tax
- $1,532 · $128/mo
- Projected year-2 tax
- $1,606 · $134/mo
- Expected delta
- +$74/yr (+$6/mo · 4.8%)
ⓘ Screening estimate from a state-policy table — verify with the county assessor before closing.
Climate risk First Street
- Flood 1/10 Low FEMA zone X (unshaded) · 0% chance over 30 yrs
- Wildfire 1/10 Low
- Heat 3/10 Moderate 7 d/yr ≥103°F today · 16 d/yr by 30 yrs out
- Wind 2/10 Low
- Air quality 3/10 Moderate 2 unhealthy d/yr today · 3 by 30 yrs out
Nearby sold comps map
Loading sold comps map…
Walkable amenities ~0.75 mi
Loading nearby amenities…
Taxation est. · year 1
- Rental income
- $19,008
- − Mortgage interest
- −$5,994
- − Property taxes
- −$1,532
- − Insurance
- −$535
- − Repairs & maintenance
- −$1,521
- − Management
- −$1,521
- − Depreciation
- −$3,113
- Taxable income
- $4,793
- Est. tax owed @ 24.0%
- −$1,150
- After-tax cash flow
- $5,065/yr
For passive investors: Depreciation is non-cash, so a rental often shows a tax loss while cash-flowing — sheltering income. Rental losses are passive: they offset passive income freely, and up to $25,000/yr can offset ordinary (W-2) income if you actively participate and your MAGI is under $100k (phasing out to $0 by $150k); unused losses carry forward. On sale, claimed depreciation is recaptured at up to 25%, and gains may owe capital-gains tax (a 1031 exchange can defer both). Figures are a year-1 estimate at your 24.0% rate — not tax advice; consult a CPA.
Schools (NCES district)
- District
- Davenport Community School District
- NCES district ID
- 1908580
- Math proficiency
- 43% ▼ -11.00%
- Reading proficiency
- 50% ▼ -3.00%
- Median HH income
- $46,157
- Composite
- 39.49/100
- National rank
- #3951
- State rank
- #288 of 289 in IA
Livability — Davenport
- Score
- 79/100
- State rank
- #126
- US rank
- #2312
Category grades
Schools grade is shown separately in the Schools card above.
Census & demographics
- Census place
- Davenport, IA
- County
- Scott County · 144,583 people
- City population
- 103,319
- Metro
- Davenport-Moline-Rock Island, IA-IL
- Population (ZIP)
- 22,742
- Household income
- $64,543
- Rent vs Own
- Severe rent burden
- 630.0
Population outlook (Scott County) Hauer SSP2
- Today (2025)
- 188,878 people
- By 2030
- 196,648 · +4.1%
- By 2040
- 210,860 · +11.6%
- By 2050
- 224,359 · +18.8%
- By 2075
- 258,884 · +37.1%
- By 2100
- 286,447 · +51.7%
Race, ethnicity, and origin ACS 2023
- Neighborhood character
- Predominantly White (69%)
- Race & ethnicity
- White 69% Black 14% Two or more races 10% Hispanic / Latino 9%
- Hispanic origin (detail)
- Mexican 7%
- Common ancestry
- Romanian 2% Portuguese 2% Iranian 2%
- Foreign-born
- 5% · Canada, United Kingdom, South Korea
- Languages at home
- 93% English-only · Spanish 4% French/Haitian/Cajun 1%
Political lean MEDSL · Scott
- 2024 margin
- Toss-up / Even · D 47.3% · R 51.2% · Other 1.4%
- 2008→2024 swing
- -18.4pp toward R · 2008: 14.6pp · 2024: -3.9pp
- All cycles
- 2024: R+3.9 2020: D+3.5 2016: D+1.4 2012: D+13.8 2008: D+14.6
Not yet ingested
- Civics
- —
Market trends
- HPI YoY
- ▼ -96.00%
- Current HPI
- 182.0976
- Rent YoY
- ▲ 4.57%
- Metro
- Davenport-Moline-Rock Island, IA-IL
- State GDP YoY
- ▲ 2.48%
- F500 in state
- 4
Industry mix (Fortune 500 HQ in IA)
| Industry | F500 HQs | Revenue |
|---|---|---|
| Financial Services | 1 | $16B |
|
||
| Retail / Convenience | 1 | $15B |
|
||
Price history
+137.8% since first listed12 events — show timeline
- 2026-05-01 Pending — MRED as Distributed by MLS Grid
- 2026-04-21 Listed $107,000 MRED as Distributed by MLS Grid
- 2021-08-06 Listing Removed — RMLSA as Distributed by MLS Grid
- 2018-04-20 Sold (MLS) $50,000 RMLSA as Distributed by MLS Grid
- 2018-04-20 Sold (MLS) $50,000 MRED as Distributed by MLS Grid
- 2018-02-11 Listed $59,900 RMLSA as Distributed by MLS Grid
- 2018-02-11 Listed $59,900 MRED as Distributed by MLS Grid
- 2014-04-30 Sold (MLS) $40,000 MRED as Distributed by MLS Grid
- 2014-04-30 Sold (MLS) $40,000 RMLSA as Distributed by MLS Grid
- 2014-02-09 Listed $45,000 MRED as Distributed by MLS Grid
- 2014-02-09 Listed $45,000 RMLSA as Distributed by MLS Grid
- 2013-12-18 Listing Removed — MRED as Distributed by MLS Grid
Property tax history
+2.9%/yrLatest (2025): $1,532 · -5.0% YoY. Source: county tax records.
Cash-flow waterfall
monthlySold comps — $/sqft
last 12 mo · ≤1 miLoading sold comps…