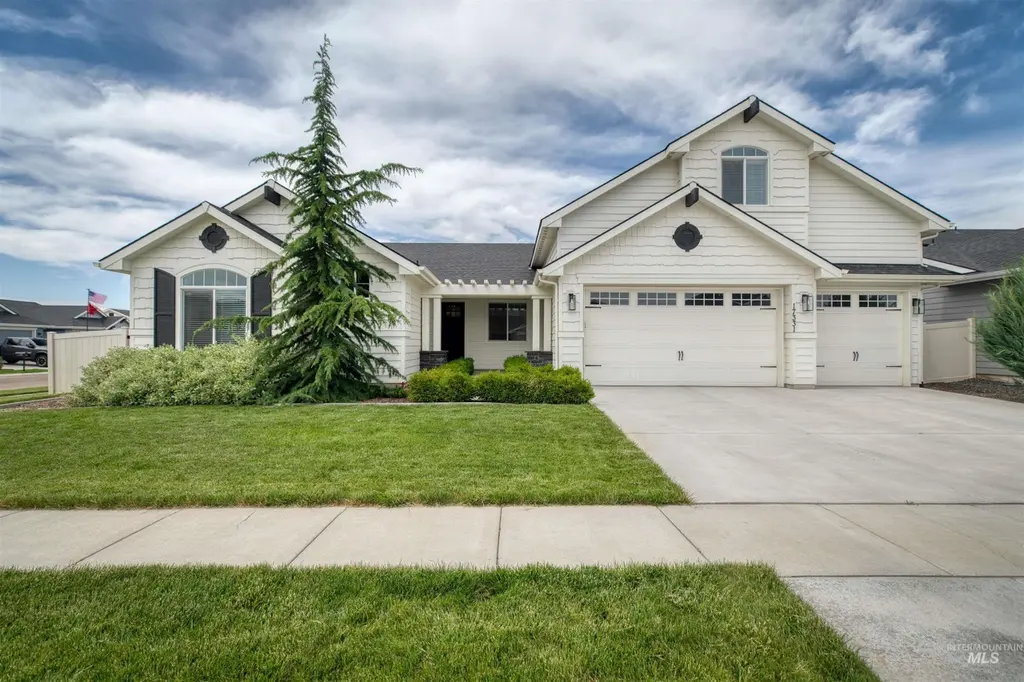
17331 N Fort Laramie Way · Nampa, ID
Flood risk 1/10 · Minimal
- FEMA flood zone
- X (unshaded)
- Chance of flooding over 30 yrs
- 0.0%
- Est. flood insurance / yr
- $507 – $1,088
Fire risk 3/10 · Minor
- Est. fire insurance / yr
- $584 – $1,086
Heat risk 4/10 · Minor
- Hot days now (above 98°F)
- 7 days/yr
- Hot days in 30 yrs
- 17 days/yr
Wind risk 1/10 · Minimal
- Chance of severe wind over 30 yrs
- —
Air-quality risk 8/10 · Major
- Unhealthy air days now
- 12 days/yr
- Unhealthy air days in 30 yrs
- 18 days/yr
Risk factors via First Street. Map © Google.
Why this score? — see what drove the D- grade
The composite is a weighted blend of 9 inputs, each scored 0–100. Each bar is that input's sub-score; the figure is the points it added to the 100-point composite (weight × sub-score).
- Cash flow +12.5/30.0
- ARV discount +7.5/15.0
- Schools +3.8/10.0
- DSCR +3.7/10.0
- Livability +3.6/5.0
- Rent growth +3.4/5.0
- 1% rule +2.8/10.0
- Condition / age +2.5/5.0
- Appreciation +0.0/10.0
$625,000
🖨 Deal sheet (PDF) 📄 Offer letter ✓ Due diligence
Listing remarks MLS
Pre-sold "The Emerson" with Bonus Room by Toll Brothers, is nestled in the beautiful Fairhaven community. This stunning floor plan offers an open gourmet kitchen followed by the formal dining room and great room with lots of natural light, cozy fireplace and opens to covered patio. Off the great room find a spacious den, perfect for home office or play space. Primary features separate tile shower and soaking tub, dual vanities and two walk in closets. 3 car garage. Photos similar.
Key facts
- Cozy gas fireplace
- Covered patio
- Walk-in pantry
Tags
Property features AI
Finance
- Other: Low/No VOC paint (improved indoor air quality)
- HOA & community: HOA with quarterly fee of $225; Subdivision: Fairhaven; Community pool
Exterior
- Parking: Attached 3-car garage; RV access/parking; Finished driveway; 3 covered parking spaces (total 3 spaces)
- Utilities: City water service; Sewer connected; Cable connected; Broadband internet
- Home design: Single family residence; Entry and main living areas on the main level
- Construction: Built in 2021; Brick, concrete, and wood siding construction; Composition roof; Crawl space foundation
- Exterior features: Full vinyl fencing; Covered patio/deck; Community pool and spa/hot tub; Irrigation available; Auto sprinkler system with drip and pressurized irrigation; Sidewalks; Corner lot
Interior
- Kitchen: Dishwasher; Disposal; Double oven; Microwave; Freestanding oven/range; Refrigerator; Gas oven; Gas range; Kitchen island; Breakfast bar; Pantry; Quartz counters
- Bedrooms: 4 bedrooms, all on the main level
- Flooring: Tile; Carpet
- Bathrooms: 4 bathrooms
- Heating & cooling: Forced air heating (natural gas); Central air conditioning; Gas water heating
- Interior features: Primary bedroom with ensuite bath; Split bedroom layout; Den/office; Formal dining room; Great room; Rec/bonus room; Double vanity in bathroom(s); Walk-in closet(s); Breakfast bar; Pantry; Kitchen island; Quartz countertops
- Laundry & utility: Washer included; Gas water heater (ENERGY STAR qualified); Tank water heater; Water softener (owned); Utility room on main level
Neighborhood map
What this means for you Summary
Snapshot
- This is a 5-bed/3.5-bath other listed at $625k.
Deal economics
- At list price, monthly cash flow is $-96 ($-1k/yr) — negative.
- To cash-flow at today's rent, offer at most $608k (2.7% below list).
- To meet the 1% rule (rent ≥ 1% of price), the offer needs to be $486k (22.2% below list).
- Recommended offer: $486k (22.2% below list) — sets the bar for 1% rule.
- Cap rate 6.1% vs local median 3.2% in Nampa — top-decile yield for the area; either an underpriced asset or a hidden risk that comps aren't pricing in. Stress-test before assuming the spread holds.
Location & tenants
- Location reads 72/100 on livability (#47 in ID) — a middle-class / working-renter tenant base. Strengths: housing A+, health & safety A+, cost of living A-; Watch: employment C-, amenities F, commute F.
- Vallivue School District (rural): math 34% / reading 56% proficiency, ranked #48 of 92 in ID (top 52%) — families likely to look elsewhere, expect single-tenant / working-renter base with shorter leases.
- Zoned schools: East Canyon Elementary School (math 34% / reading 44%, grade F, #247 of 357 statewide, top 70%, 692 students, 33% FRL); Sage Valley Middle School (math 27% / reading 55%, grade F, #68 of 109 statewide, top 62%, 810 students, 28% FRL); Ridgevue High School (math 27% / reading 67%, grade D-, #55 of 169 statewide, top 34%, 1,578 students, 31% FRL) — zoned schools average 31% FRL vs 52% district-wide (21 pts lower); this property's tenant base skews higher-income than the district average.
- Market conditions: Rents rising (+3.4%/yr); 638 active listings in the ZIP; 2 comparable units currently listed for rent nearby; solid renter incomes; 3,620 units permitted in Canyon County in 2024 (196 in 5+ unit buildings).
- At $4,864/mo this rent would consume 76% of the median local household income ($77k/yr) (locally 683% of renters already pay >50% of income on rent) — very limited rent-growth headroom before tenants either downsize or default.
Forward outlook
- Local home prices are declining (-3.0%/yr); year-one equity from $4k of loan paydown is wiped out by about $19k of value loss. Plan a longer hold.
- Canyon County population projected at +41% by 2050 — long-run rental-demand tailwind backs the buy-and-hold thesis.
Negotiation context
- Only 14 days on market — expect competitive offers; lowballing is unlikely to land.
- 3 sale attempts since 5y ago with the ask held roughly flat each time — persistent listings suggest the price (not the market) is what's stuck; bring a comps-based counter.
Questions for the listing agent
- What do current leases actually rent for vs. the listed asking? Can we see a recent rent roll and the last 12 months of T-12 income?
- What does the HOA fee cover, when was the last increase, and are there any pending special assessments or reserve-fund shortfalls?
- Is there a deadline driving the sale (1031 exchange, divorce, estate, relocation)? That informs how much negotiation room exists.
- Schools are D-rated, which usually means shorter tenancies and higher turnover. Who's the typical renter profile here, and what's been the actual vacancy rate?
- The area grade is low — what's the realistic commute time and amenity access for the typical tenant pool here? Any planned neighborhood developments (good or bad) we should know about?
- What's the average days-on-market for RENTAL listings here right now (not sales)? A rising rental-DOM trend means longer vacancies and softer asking-rent achievability than the comps imply.
- What's the recent tenant-quality profile in this submarket — average credit score on applications, eviction rate, late-payment / NSF rate, and stable-employment percentage? A property-management company in the area should have these aggregated.
- How much new for-sale + rental construction is in the pipeline within 1–3 miles? Heavy new supply typically softens prices + rents 12–24 months out; constrained supply supports both.
Investment metrics
- 1% rule
- 0.78% ✗
- Cap rate
- 6.11%
- Cash-on-cash
- -0.66%
- DSCR
- 0.97
- GRM
- 10.7
CMA / ARV
No comps found within radius.
Projected returns pro-forma
-3.0% appreciation · 3.44% rent growth · sell at horizon
- IRR
- -17.0%
- Equity multiple
- 0.40×
- Total profit
- $-105,396
- Equity at exit
- $93,190
- IRR
- -8.2%
- Equity multiple
- 0.48×
- Total profit
- $-91,356
- Equity at exit
- $54,039
Cash invested: $175,000 (down + closing). Projections, not guarantees.
Landlord ↔ Tenant lean methodology
- Overall (STATE)
- 91 Strongly Landlord-Friendly
- State Idaho
- 91 Strongly Landlord-Friendly · R+18
- County
- — inherits STATE
- City
- — inherits STATE
ZIP-level market 83687
- Home prices YoY
- -21.0%
- Rents YoY
- 3.4%
- Active inventory
- 638
- Price-to-rent
- 10.7×
Monthly cashflow live
- Estimated rent
- $4,864 medium interval (Pro) →
- Mortgage (P&I)
- −$3,278
- Tax from tax record
- −$326 /mo · $3,913/yr
- Insurance
- −$260
- HOA
- −$75
- Vacancy / Maint / Mgmt
- −$1,022
- Net cashflow
- $-96
Break-even live
Sensitivity live
| Price | -10% $258 | -5% $81 | +0% $-96 | +5% $-273 | +10% $-450 |
|---|---|---|---|---|---|
| Rent | -10% $-480 | -5% $-288 | +0% $-96 | +5% $96 | +10% $288 |
| Rate | -1.0pp $219 | -0.5pp $63 | base $-96 | +0.5pp $-258 | +1.0pp $-423 |
UW: 25.0% down · 7.5% · 30yr · 1.5% tax · 5.0% vac · 8.0% maint · 8.0% mgmt
Financing live
Cash to close
- Down payment
- $156,250
- Closing costs
- $18,750
- Reserves months
- —
- Total cash needed
- —
Loan-product check · same deal, 3 products live
Conventional
25% down · 7.5% · 30yr
- Down + closing
- —
- Monthly P&I
- —
- Monthly cashflow
- —
- DSCR
- —
- Eligible?
- —
Personal DTI + credit; lowest rate.
DSCR
20% down · 8.5% · 30yr
- Down + closing
- —
- Monthly P&I
- —
- Monthly cashflow
- —
- DSCR
- —
- Eligible?
- —
No personal income docs; deal must DSCR.
Hard money
10% down · 12.0% · 12mo
- Down + closing
- —
- Monthly P&I
- —
- Monthly cashflow
- —
- DSCR
- —
- Eligible?
- —
Short-term bridge; refi at stabilization.
Rent comps 2 comps
| Address | Beds | Baths | Sqft | Rent | $/sqft | DOM | Units | Dist |
|---|---|---|---|---|---|---|---|---|
| 5302 E Burnte Peak St Unit 1322141P Nampa, ID | 6.0 | 2.5 | 2992 | $7,109 | $2.38 | 4d | 1 | 1.07mi |
| 5126 E Sylvan Hart Dr Unit 1322143P Nampa, ID | 5.0 | 2.5 | 2992 | $6,692 | $2.24 | 16d | 1 | 1.27mi |
HOA detail
- Monthly dues
- $75 · $900/yr
Listing history 9 events
-
2026-06-13statusdays on market $625,000 Pending 14 DOM
-
2026-06-10days on market $625,000 Active 12 DOM
-
2026-06-09days on market $625,000 Active 11 DOM
-
2026-06-08days on market $625,000 Active 10 DOM
-
2026-06-07days on market $625,000 Active 9 DOM
-
2026-06-03days on market $625,000 Active 5 DOM
-
2026-06-03days on market $625,000 Active 4 DOM
-
2026-06-01days on market $625,000 Active 3 DOM
-
2026-05-31days on market $625,000 Active 2 DOM
ⓘ Source: listings_history table (triggers on properties + properties_extension) + one-shot
backfill from property_details.listing_events for pre-trigger history.
Tax reassessment forecast ID · Resets to sale price
- Current annual tax
- $3,913 · $326/mo
- Projected year-2 tax
- $4,312 · $359/mo
- Expected delta
- +$400/yr (+$33/mo · 10.2%)
ⓘ Screening estimate from a state-policy table — verify with the county assessor before closing.
Climate risk First Street
- Flood 1/10 Low FEMA zone X (unshaded) · 0% chance over 30 yrs
- Wildfire 3/10 Moderate
- Heat 4/10 Moderate 7 d/yr ≥98°F today · 17 d/yr by 30 yrs out
- Wind 1/10 Low
- Air quality 8/10 Severe 12 unhealthy d/yr today · 18 by 30 yrs out
Nearby sold comps map
Loading sold comps map…
Walkable amenities ~0.75 mi
Loading nearby amenities…
Taxation est. · year 1
- Rental income
- $58,374
- − Mortgage interest
- −$35,010
- − Property taxes
- −$3,913
- − Insurance
- −$3,125
- − Repairs & maintenance
- −$4,670
- − Management
- −$4,670
- − HOA
- −$900
- − Depreciation
- −$18,182
- Taxable loss
- −$12,095
- Est. tax savings @ 24.0%
- +$2,903
- After-tax cash flow
- $1,749/yr
For passive investors: Depreciation is non-cash, so a rental often shows a tax loss while cash-flowing — sheltering income. Rental losses are passive: they offset passive income freely, and up to $25,000/yr can offset ordinary (W-2) income if you actively participate and your MAGI is under $100k (phasing out to $0 by $150k); unused losses carry forward. On sale, claimed depreciation is recaptured at up to 25%, and gains may owe capital-gains tax (a 1031 exchange can defer both). Figures are a year-1 estimate at your 24.0% rate — not tax advice; consult a CPA.
Schools (NCES district)
- District
- Vallivue School District
- NCES district ID
- 1600600
- Math proficiency
- 34% ▼ -9.00%
- Reading proficiency
- 56% ▼ -1.00%
- Median HH income
- $47,377
- Composite
- 38.3/100
- National rank
- #4229
- State rank
- #48 of 92 in ID
Livability — Nampa
- Score
- 72/100
- State rank
- #47
- US rank
- #6250
Category grades
Schools grade is shown separately in the Schools card above.
Census & demographics
- Census place
- Nampa, ID
- County
- Canyon County · 235,358 people
- City population
- 142,249
- Metro
- Boise City, ID
- Population (ZIP)
- 43,135
- Household income
- $76,682
- Rent vs Own
- Severe rent burden
- 683.0
Population outlook (Canyon County) Hauer SSP2
- Today (2025)
- 248,853 people
- By 2030
- 269,596 · +8.3%
- By 2040
- 311,081 · +25.0%
- By 2050
- 350,809 · +41.0%
- By 2075
- 441,884 · +77.6%
- By 2100
- 505,641 · +103.2%
Race, ethnicity, and origin ACS 2023
- Neighborhood character
- Predominantly White (71%)
- Race & ethnicity
- White 71% Hispanic / Latino 21% Two or more races 11% Black 2% Native American 1%
- Hispanic origin (detail)
- Mexican 18%
- Common ancestry
- Italian 4% Slovak 3% Lithuanian 2%
- Foreign-born
- 7% · Canada
- Languages at home
- 85% English-only · Spanish 12% Russian/Polish/Slavic 1%
Political lean MEDSL · Canyon
- 2024 margin
- Solid R (+46.6) · D 25.4% · R 72.0% · Other 2.5%
- 2008→2024 swing
- -11.4pp toward R · 2008: -35.2pp · 2024: -46.6pp
- All cycles
- 2024: R+46.6 2020: R+39.7 2016: R+41.8 2012: R+37.1 2008: R+35.2
Not yet ingested
- Civics
- —
Market trends
- HPI YoY
- ▼ -103.50%
- Current HPI
- 388.8148
- Rent YoY
- ▲ 3.44%
- Metro
- Boise City, ID
- State GDP YoY
- ▲ 4.51%
- F500 in state
- 6
Industry mix (Fortune 500 HQ in ID)
| Industry | F500 HQs | Revenue |
|---|---|---|
| Retail | 1 | $79B |
|
||
| Technology | 1 | $25B |
|
||
| Food / Agriculture | 1 | $6B |
|
||
Price history
+7.2% since first listed7 events — show timeline
- 2026-05-29 Listed $625,000 IMLS
- 2024-10-25 Listing Removed — IMLS
- 2024-10-16 Price Changed $685,000 IMLS
- 2024-09-18 Price Changed $699,000 IMLS
- 2024-08-30 Listed $710,000 IMLS
- 2021-10-26 Sold (MLS) — IMLS
- 2021-03-15 Listed $583,250 IMLS
Property tax history
+32.5%/yrLatest (2025): $3,913 · +0.1% YoY. Source: county tax records.
Cash-flow waterfall
monthlySold comps — $/sqft
last 12 mo · ≤1 miLoading sold comps…