2309 Primrose Ave · Fort Worth, TX
Flood risk 1/10 · Minimal
- FEMA flood zone
- X (unshaded)
- Chance of flooding over 30 yrs
- 0.0%
- Est. flood insurance / yr
- $507 – $1,088
Fire risk 1/10 · Minimal
- Est. fire insurance / yr
- $1,222 – $2,270
Heat risk 7/10 · Major
- Hot days now (above 109°F)
- 6 days/yr
- Hot days in 30 yrs
- 19 days/yr
Wind risk 6/10 · Moderate
- Chance of severe wind over 30 yrs
- 27.0%
Air-quality risk 4/10 · Minor
- Unhealthy air days now
- 4 days/yr
- Unhealthy air days in 30 yrs
- 5 days/yr
Risk factors via First Street. Map © Google.
Why this score? — see what drove the C+ grade
The composite is a weighted blend of 9 inputs, each scored 0–100. Each bar is that input's sub-score; the figure is the points it added to the 100-point composite (weight × sub-score).
- Cash flow +20.6/30.0
- ARV discount +15.0/15.0
- 1% rule +7.5/10.0
- DSCR +6.5/10.0
- Livability +4.0/5.0
- Rent growth +2.6/5.0
- Condition / age +2.5/5.0
- Schools +2.0/10.0
- Appreciation +0.0/10.0
$160,000
🖨 Deal sheet 📄 Offer letter ✓ Due diligence
Listing remarks
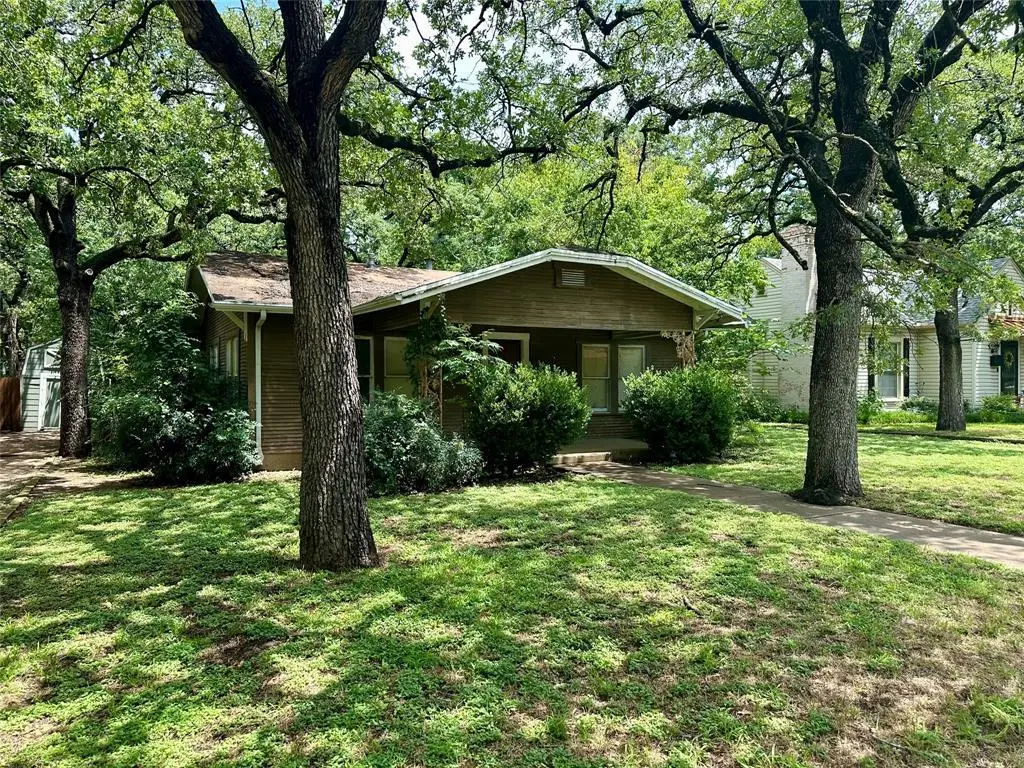
Offer deadline set for Wednesday, June 3rd at 11am. Seller may accept an offer prior to deadline. Rare investor opportunity in the historic Oakhurst neighborhood of Fort Worth. Situated on a heavily treed 10,800 sqft lot surrounded by charming sidewalks, quiet tree lined streets, and character rich historic homes, this 1937 property offers incredible potential for investors, builders, or renovation specialists. Conveniently located just minutes from Downtown Fort Worth, the Fort Worth Stockyards, Sundance Square, Top Golf, shopping, dining, entertainment, and major highways. Tax records reflect a 3-bedroom, 1 bathroom home with approximately 916 sqft plus an enclosed porch area bringing tot
Key facts
- Extensive renovation
- Heavily treed lot
- Existing hvac
Tags
Property features AI
Finance
- Other: Will not subdivide
- Financial info: Listing terms: Cash; Treat as clear loan type; No second mortgage
- HOA & community: No homeowners association
Exterior
- Parking: No garage, covered, or carport spaces listed; Other parking features
- Utilities: City water; City sewer; Not in a municipal utility district
- Home design: Single family residence; One story; Residential property
- Construction: Built in 1937; Composition roof; Pillar/post/pier foundation
- Exterior features: Chain-link fencing; Enclosed rear porch; Many trees on the lot
Interior
- Kitchen: No appliances included
- Bedrooms: 3 bedrooms (all on the main level)
- Flooring: See remarks for flooring details
- Bathrooms: 1 full bathroom
- Heating & cooling: Central heating; Central air conditioning
- Interior features: Natural woodwork; One living area; One dining area; 6 total rooms; Single-level home
- Laundry & utility: Utility room for laundry
Neighborhood map
What this means for you Summary
Snapshot
- This is a 3-bed/1.0-bath single-family listed at $160k.
Deal economics
- At list price, monthly cash flow is $213 ($3k/yr) — positive.
- The deal already cash-flows at list — no discount required.
- Meets the 1% rule at list price ($2k rent vs $160k).
- Cap rate 7.9% vs local median 3.9% in Fort Worth — top-decile yield for the area; either an underpriced asset or a hidden risk that comps aren't pricing in. Stress-test before assuming the spread holds.
Location & tenants
- Location reads 80/100 on livability (#49 in TX, #1,954 nationally) — a professional / high-income tenant draw. Strengths: amenities A+, cost of living A+, housing A+; Watch: crime F.
- Fort Worth ISD (urban): math 18% / reading 28% proficiency, ranked #742 of 826 in TX (top 90%) — low school quality limits family demand, transient renter base, plan for 1-2y turnover; 73% free/reduced lunch — lower-income household profile, screen leases tightly.
- Zoned schools: Oakhurst El (math 29% / reading 33%, grade F, #2,429 of 4,322 statewide, top 57%, 479 students, 89% FRL) — zoned schools average 89% FRL vs 73% district-wide (16 pts higher); higher-poverty schools than district average — tighter screening recommended.
- Market conditions: Rents flat; 71 active listings in the ZIP; 16 comparable units currently listed for rent nearby; rentals leasing fast (median 7d on market — plan ~1-2 weeks tenant-placement turnaround); 18,938 units permitted in Tarrant County in 2024 (8,336 in 5+ unit buildings).
- This rent runs 40% of the median local income ($60k/yr) — at the standard rent-burdened threshold; future hikes will face affordability resistance.
Forward outlook
- Local home prices are declining (-3.0%/yr); year-one equity from $1k of loan paydown is wiped out by about $5k of value loss. Plan a longer hold.
- Tarrant County population projected at +41% by 2050 — long-run rental-demand tailwind backs the buy-and-hold thesis.
Negotiation context
- Only 6 days on market — expect competitive offers; lowballing is unlikely to land.
- Current owner paid $27k; list at $160k implies a 502% gain — meaningful room to come down on a strong offer.
Risks & watch-outs
- Watch-outs: property tax is 3.4% of price; built in 1937 — expect roof / HVAC / electrical / plumbing capex.
- Climate carrying-cost: major wind risk, 27% chance of damaging wind over 30y; extreme-heat days projected 6→19/yr by 2055 (HVAC capex compounding) — expect insurance premiums to compound above CPI over the hold.
Questions for the listing agent
- Built in 1937 — when were the roof, HVAC, electrical panel, plumbing, and water heater last replaced?
- Property tax is high relative to price — has the assessment been appealed recently, and will the sale trigger a re-assessment?
- Is there a deadline driving the sale (1031 exchange, divorce, estate, relocation)? That informs how much negotiation room exists.
- Schools are D-rated, which usually means shorter tenancies and higher turnover. Who's the typical renter profile here, and what's been the actual vacancy rate?
- Crime grade is F in this area — have there been break-ins, vandalism, or insurance claims at this property in the last 3 years? What carrier currently insures it and at what premium?
- What's the average days-on-market for RENTAL listings here right now (not sales)? A rising rental-DOM trend means longer vacancies and softer asking-rent achievability than the comps imply.
- What's the recent tenant-quality profile in this submarket — average credit score on applications, eviction rate, late-payment / NSF rate, and stable-employment percentage? A property-management company in the area should have these aggregated.
- How much new for-sale + rental construction is in the pipeline within 1–3 miles? Heavy new supply typically softens prices + rents 12–24 months out; constrained supply supports both.
Investment metrics
- 1% rule
- 1.25% ✓
- Cap rate
- 7.89%
- Cash-on-cash
- 5.71%
- DSCR
- 1.25
- GRM
- 6.7
CMA / ARV
- ARV (on-the-fly)
- $209,764
- Comps found
- 12
Show comp detail 12 sales within ~0.75 mi
| Address | Dist | Beds/Ba | Sqft | Sold | Price | $/sf | Match |
|---|---|---|---|---|---|---|---|
| 2309 Primrose Ave | 0.00mi | 3/1.0 | 916 (0%) | 0mo | $160,000 | $175 | 100 |
| 2333 Bird St | 0.32mi | 2/1.0 (-1) | 867 (-5%) | 11mo | $209,900 | $242 | 62 |
| 2617 Marigold Ave | 0.29mi | 3/1.5 | 1,050 (+15%) | 2mo | $249,950 | $238 | 59 |
| 2020 Watauga Ct W | 0.53mi | 2/1.0 (-1) | 988 (+8%) | 9mo | $250,000 | $253 | 50 |
| 2117 Grace Ave | 0.63mi | 2/1.0 (-1) | 1,006 (+10%) | 0mo | $199,900 | $199 | 49 |
| 2518 Mclemore Ave | 0.59mi | 2/1.0 (-1) | 964 (+5%) | 16mo | $179,900 | $187 | 45 |
| 2408 Bird St | 0.35mi | 3/2.0 | 1,036 (+13%) | 21mo | $254,900 | $246 | 40 |
| 2072 W Lotus Ave | 0.59mi | 2/1.0 (-1) | 1,012 (+10%) | 15mo | $305,000 | $301 | 38 |
| 3032 Carnation Ave | 0.61mi | 2/1.0 (-1) | 976 (+7%) | 22mo | $177,000 | $181 | 38 |
| 2811 Springdale Rd | 0.62mi | 2/1.0 (-1) | 976 (+7%) | 23mo | $205,000 | $210 | 36 |
| 806 N Chandler Dr | 0.75mi | 2/1.0 (-1) | 1,028 (+12%) | 20mo | $235,000 | $229 | 23 |
| 1109 N Riverside Dr | 0.66mi | 2/1.0 (-1) | 1,046 (+14%) | 22mo | $200,000 | $191 | 22 |
Match score weights: distance 35% · size 25% · config 20% · recency 20%. Top-matched comps best support the ARV.
Projected returns pro-forma
-3.0% appreciation · 0.45% rent growth · sell at horizon
- IRR
- -10.8%
- Equity multiple
- 0.62×
- Total profit
- $-17,146
- Equity at exit
- $23,857
- IRR
- -6.5%
- Equity multiple
- 0.64×
- Total profit
- $-16,143
- Equity at exit
- $13,834
Cash invested: $44,800 (down + closing). Projections, not guarantees.
Landlord ↔ Tenant lean methodology
- Overall (STATE)
- 87 Strongly Landlord-Friendly
- State Texas
- 87 Strongly Landlord-Friendly · R+5
- County
- — inherits STATE
- City
- — inherits STATE
ZIP-level market 76111
- Home prices YoY
- -19.2%
- Rents YoY
- 0.5%
- Active inventory
- 71
- Price-to-rent
- 6.7×
Monthly cashflow live
- Estimated rent
- $1,996 high interval (Pro) →
- Mortgage (P&I)
- −$839
- Tax from tax record
- −$458 /mo · $5,494/yr
- Insurance
- −$67
- HOA
- −$0
- Vacancy / Maint / Mgmt
- −$419
- Net cashflow
- $213
Break-even live
UW: 25.0% down · 7.5% · 30yr · 1.5% tax · 5.0% vac · 8.0% maint · 8.0% mgmt
Financing live
Cash to close
- Down payment
- $40,000
- Closing costs
- $4,800
- Reserves months
- —
- Total cash needed
- —
Loan-product check · same deal, 3 products live
Conventional
25% down · 7.5% · 30yr
- Down + closing
- —
- Monthly P&I
- —
- Monthly cashflow
- —
- DSCR
- —
- Eligible?
- —
Personal DTI + credit; lowest rate.
DSCR
20% down · 8.5% · 30yr
- Down + closing
- —
- Monthly P&I
- —
- Monthly cashflow
- —
- DSCR
- —
- Eligible?
- —
No personal income docs; deal must DSCR.
Hard money
10% down · 12.0% · 12mo
- Down + closing
- —
- Monthly P&I
- —
- Monthly cashflow
- —
- DSCR
- —
- Eligible?
- —
Short-term bridge; refi at stabilization.
Rent comps 16 comps
| Address | Beds | Baths | Sqft | Rent | $/sqft | DOM | Units | Dist |
|---|---|---|---|---|---|---|---|---|
| 999 Scenic Hill Dr Fort Worth, TX | 2.0 | 1.0–2.5 | 1077 | $2,896 | $2.69 | 2d | 19 | 0.49mi |
| 2104 W Lotus Ave Fort Worth, TX | 2.0 | 1.0 | 1039 | $1,600 | $1.54 | 6d | 1 | 0.57mi |
| 1852 E Northside Dr Fort Worth, TX | 2.0 | 2.0 | 1083 | $2,055 | $1.90 | 19d | 1 | 0.58mi |
| 2413 Race St Fort Worth, TX | 2.0 | 1.0–2.0 | 849 | $1,949 | $2.30 | 2d | 13 | 0.61mi |
| 2901 Race St Fort Worth, TX | 1.0–2.0 | 1.0–2.0 | 869 | $1,300 | $1.50 | 6d | 1 | 0.74mi |
| 2900 Race St Fort Worth, TX | 2.0 | 1.0–2.0 | 959 | $1,899 | $1.98 | 2d | 21 | 0.78mi |
| 336 Oakhurst Scenic Dr Fort Worth, TX | 2.0 | 1.0–2.0 | 939 | $2,085 | $2.22 | 2d | 29 | 0.87mi |
| 3417 Clary Ave Fort Worth, TX | 2.0 | 1.0 | 1057 | $1,595 | $1.51 | 14d | 1 | 0.92mi |
| 2211 Barbell Ln Fort Worth, TX | 2.0 | 1.0 | 718 | $1,295 | $1.80 | 44d | 1 | 1.08mi |
| 2204 Salisbury Ave Fort Worth, TX | 2.0 | 1.0 | 910 | $1,400 | $1.54 | 24d | 1 | 1.25mi |
| 701 N Hampton St Fort Worth, TX | 1.0–2.0 | 1.0–2.0 | 866 | $2,351 | $2.71 | 2d | 25 | 1.36mi |
| 2001 E 4th St Fort Worth, TX | 2.0 | 1.0–2.0 | 872 | $2,759 | $3.16 | 2d | 121 | 1.39mi |
| 2001 E 4th St Fort Worth, TX | 2.0 | 1.0–2.0 | 872 | $2,724 | $3.12 | 21d | 42 | 1.39mi |
| 769 Samuels Ave Fort Worth, TX | 1.0–3.0 | 1.0–3.0 | 1113 | $2,708 | $2.43 | 3d | 27 | 1.40mi |
| 601 W Beach St Fort Worth, TX | 3.0 | 1.0 | 961 | $1,695 | $1.76 | 21d | 1 | 1.45mi |
| 637 Samuels Ave Fort Worth, TX | 2.0 | 1.0–2.0 | 1045 | $2,544 | $2.43 | 2d | 17 | 1.49mi |
Listing history 9 events
-
2026-06-04status $160,000 Pending 6 DOM
-
2026-06-03days on market $160,000 Active 6 DOM
-
2026-06-02days on market $160,000 Active 5 DOM
-
2026-06-01days on market $160,000 Active 4 DOM
-
2026-05-31days on market $160,000 Active 3 DOM
-
2026-05-28$160,000 Active
-
1999-08-26soldstatus
-
1999-04-21soldstatus
-
1997-10-09soldstatus $26,600
ⓘ Source: listings_history table (triggers on properties + properties_extension) + one-shot
backfill from property_details.listing_events for pre-trigger history.
Tax reassessment forecast TX · Resets to sale price
- Current annual tax
- $5,494 · $458/mo
- Projected year-2 tax
- $5,494 · $458/mo
- Expected delta
- $0/yr ($0/mo · 0.0%)
ⓘ Screening estimate from a state-policy table — verify with the county assessor before closing.
Climate risk First Street
- Flood 1/10 Low FEMA zone X (unshaded) · 0% chance over 30 yrs
- Wildfire 1/10 Low
- Heat 7/10 Severe 6 d/yr ≥109°F today · 19 d/yr by 30 yrs out
- Wind 6/10 Major 27% chance of damaging wind over 30 yrs
- Air quality 4/10 Moderate 4 unhealthy d/yr today · 5 by 30 yrs out
Nearby sold comps map
Loading sold comps map…
Walkable amenities ~0.75 mi
Loading nearby amenities…
Taxation est. · year 1
- Rental income
- $23,952
- − Mortgage interest
- −$8,962
- − Property taxes
- −$5,494
- − Insurance
- −$800
- − Repairs & maintenance
- −$1,916
- − Management
- −$1,916
- − Depreciation
- −$4,655
- Taxable income
- $209
- Est. tax owed @ 24.0%
- −$50
- After-tax cash flow
- $2,510/yr
For passive investors: Depreciation is non-cash, so a rental often shows a tax loss while cash-flowing — sheltering income. Rental losses are passive: they offset passive income freely, and up to $25,000/yr can offset ordinary (W-2) income if you actively participate and your MAGI is under $100k (phasing out to $0 by $150k); unused losses carry forward. On sale, claimed depreciation is recaptured at up to 25%, and gains may owe capital-gains tax (a 1031 exchange can defer both). Figures are a year-1 estimate at your 24.0% rate — not tax advice; consult a CPA.
Schools (NCES district)
- District
- Fort Worth ISD
- NCES district ID
- 4819700
- Math proficiency
- 18% ▼ -16.00%
- Reading proficiency
- 28% ▼ -6.00%
- Median HH income
- $42,109
- Composite
- 19.61/100
- National rank
- #8753
- State rank
- #742 of 826 in TX
Livability — Fort Worth
- Score
- 80/100
- State rank
- #49
- US rank
- #1954
Category grades
Schools grade is shown separately in the Schools card above.
Census & demographics
- Census place
- Fort Worth, TX
- County
- Tarrant County · 2,033,669 people
- City population
- 911,619
- Metro
- Dallas-Fort Worth-Arlington, TX
- Population (ZIP)
- 20,989
- Household income
- $60,194
- Rent vs Own
- Severe rent burden
- 616.0
Population outlook (Tarrant County) Hauer SSP2
- Today (2025)
- 2,380,417 people
- By 2030
- 2,578,900 · +8.3%
- By 2040
- 2,974,995 · +25.0%
- By 2050
- 3,350,489 · +40.8%
- By 2075
- 4,216,909 · +77.2%
- By 2100
- 4,741,527 · +99.2%
Race, ethnicity, and origin ACS 2023
- Neighborhood character
- Predominantly Hispanic (67%)
- Race & ethnicity
- Hispanic / Latino 67% White 24% Two or more races 24% Black 4% Asian 3% Native American 1%
- Hispanic origin (detail)
- Mexican 62%
- Common ancestry
- Slovak 1%
- Foreign-born
- 25% · Canada, Vietnam
- Languages at home
- 45% English-only · Spanish 52% Other Asian/Pacific 1% Vietnamese 1%
Political lean MEDSL · Tarrant
- 2024 margin
- Lean R (+5.1) · D 46.7% · R 51.9% · Other 1.4%
- 2008→2024 swing
- +6.6pp toward D · 2008: -11.7pp · 2024: -5.1pp
- All cycles
- 2024: R+5.1 2020: D+0.2 2016: R+8.7 2012: R+15.7 2008: R+11.7
Not yet ingested
- Civics
- —
Market trends
- HPI YoY
- ▼ -74.75%
- Current HPI
- 315.1072
- Rent YoY
- ▲ 0.45%
- Metro
- Dallas-Fort Worth-Arlington, TX
- State GDP YoY
- ▲ 3.95%
- F500 in state
- 110
Industry mix (Fortune 500 HQ in TX)
| Industry | F500 HQs | Revenue |
|---|---|---|
| Energy | 16 | $1,198B |
|
||
| Technology | 5 | $198B |
|
||
| Engineering / Construction | 4 | $72B |
|
||
| Energy Services | 3 | $60B |
|
||
| Utilities | 3 | $41B |
|
||
| Healthcare | 2 | $330B |
|
||
Price history
+501.5% since first listed4 events — show timeline
- 2026-05-28 Listed $160,000 NTREIS
- 1999-08-26 Sold (Public Records) — Public Records
- 1999-04-21 Sold (Public Records) — Public Records
- 1997-10-09 Sold (Public Records) $26,600 Public Records
Property tax history
+6.5%/yrLatest (2025): $5,494 · -2.4% YoY. Source: county tax records.
Cash-flow waterfall
monthlySold comps — $/sqft
last 12 mo · ≤1 miLoading sold comps…