205 S Aspen Ct #3 · Howland Center, OH
Flood risk 1/10 · Minimal
- FEMA flood zone
- X (unshaded)
- Chance of flooding over 30 yrs
- 0.0%
- Est. flood insurance / yr
- $507 – $1,088
Fire risk 1/10 · Minimal
- Est. fire insurance / yr
- $713 – $1,323
Heat risk 3/10 · Minor
- Hot days now (above 96°F)
- 7 days/yr
- Hot days in 30 yrs
- 17 days/yr
Wind risk 1/10 · Minimal
- Chance of severe wind over 30 yrs
- —
Air-quality risk 3/10 · Minor
- Unhealthy air days now
- 2 days/yr
- Unhealthy air days in 30 yrs
- 5 days/yr
Risk factors via First Street. Map © Google.
Why this score? — see what drove the C+ grade
The composite is a weighted blend of 9 inputs, each scored 0–100. Each bar is that input's sub-score; the figure is the points it added to the 100-point composite (weight × sub-score).
- Cash flow +24.6/30.0
- DSCR +7.9/10.0
- ARV discount +7.5/15.0
- 1% rule +7.4/10.0
- Schools +5.3/10.0
- Livability +3.8/5.0
- Rent growth +2.5/5.0
- Condition / age +2.5/5.0
- Appreciation +0.0/10.0
$185,000
🖨 Deal sheet (PDF) 📄 Offer letter ✓ Due diligence
Listing remarks MLS
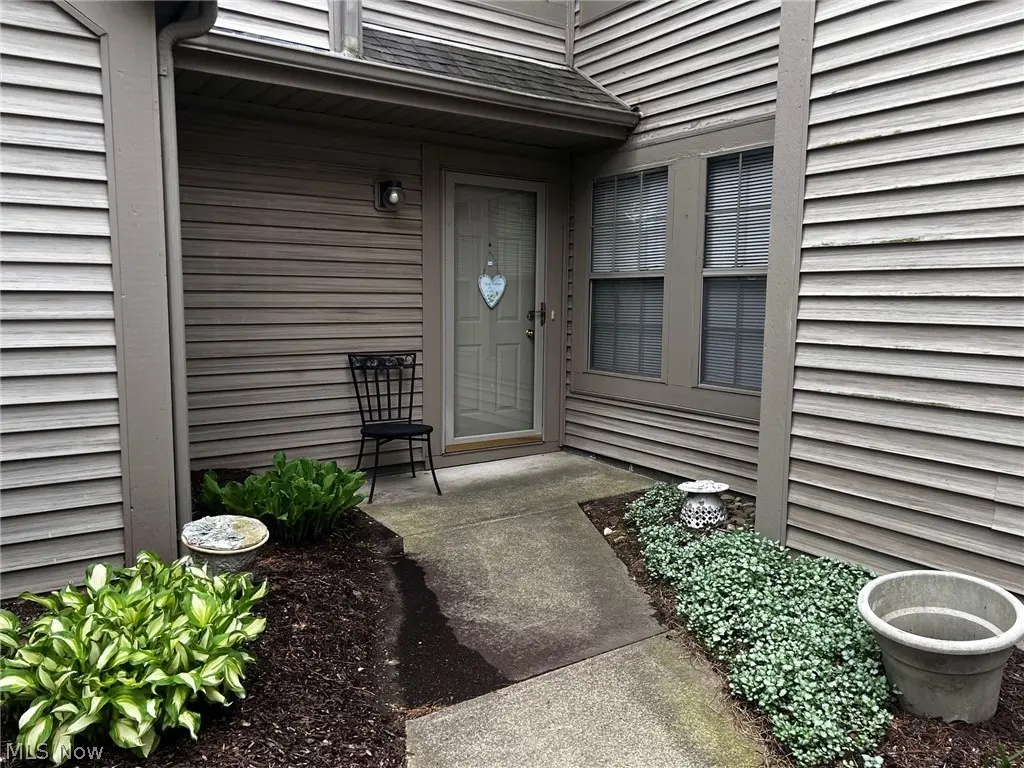
Absolutely a beautiful condo. Open floor plan. New carpet in living room, dining room and 2 bedrooms. Interior painted in summer 2007. This is a first floor ranch with attached garage.
Key facts
- Open floor plan
- Private deck area
- Gas fireplace
Tags
Property features AI
Finance
- Financial info: Pets allowed
- HOA & community: $190 monthly association fee; Association covers management, insurance, grounds and structure maintenance, recreation facilities, reserve fund, snow removal, and trash; Recreation amenities include pool, clubhouse, and fitness center
Exterior
- Parking: Attached garage (1 car); Driveway; Garage faces front; Garage door opener
- Security: Smoke detector(s)
- Utilities: Public water; Public sewer
- Home design: Single-story home; Entry level: 1; Vinyl siding; Asphalt roof
- Construction: Vinyl siding construction; Asphalt roof; Year built per public records
- Exterior features: Deck; Front porch; Community pool; Common grounds; Clubhouse; Fitness center; Street lights
Interior
- Kitchen: All appliances remain; Pantry; Breakfast bar; Dishwasher; Range; Microwave; Refrigerator; Disposal; Tile counters; Laminate flooring in kitchen
- Bedrooms: Two main-level bedrooms with walk-in closets
- Flooring: Carpet in bedrooms and great room; Laminate in kitchen
- Bathrooms: Two full bathrooms (both on the main level)
- Heating & cooling: Forced air heating (gas); Central air conditioning
- Interior features: Breakfast bar; Entrance foyer; Primary bedroom on main level; Pantry; Tile counters; Walk-in closets; Gas fireplace in great room; Fireplace
- Laundry & utility: Main-level laundry; Washer; Dryer
Neighborhood map
What this means for you Summary
Snapshot
- This is a 2-bed/1.5-bath condo listed at $185k.
Deal economics
- At list price, monthly cash flow is $383 ($5k/yr) — positive.
- The deal already cash-flows at list — no discount required.
- Meets the 1% rule at list price ($2k rent vs $185k).
- Cap rate 8.8% vs local median 3.9% in Howland Center — top-decile yield for the area; either an underpriced asset or a hidden risk that comps aren't pricing in. Stress-test before assuming the spread holds.
Location & tenants
- Location reads 76/100 on livability (#207 in OH, #3,283 nationally) — a middle-class / working-renter tenant base. Strengths: cost of living A+, housing A+, health & safety A+; Watch: amenities F, commute F.
- Howland Local (suburban): math 59% / reading 65% proficiency, ranked #260 of 656 in OH (top 40%) — acceptable for families but not a draw, mixed tenant base, ~2y average lease.
- Zoned schools: Mines Elementary School (math 67% / reading 58%, grade B, #580 of 1,584 statewide, top 37%, 330 students, 41% FRL); Howland Middle School (math 56% / reading 66%, grade B+, #252 of 654 statewide, top 39%, 766 students, 38% FRL); Howland High School (math 58% / reading 74%, grade B, #155 of 781 statewide, top 20%, 742 students, 38% FRL).
- Market conditions: 92 active listings in the ZIP; 1 comparable units currently listed for rent nearby; 129 units permitted in Trumbull County in 2024 (0 in 5+ unit buildings).
- This rent runs 42% of the median local income ($65k/yr) — at the standard rent-burdened threshold; future hikes will face affordability resistance.
Forward outlook
- Local home prices are declining (-3.0%/yr); year-one equity from $1k of loan paydown is wiped out by about $6k of value loss. Plan a longer hold.
- Trumbull County population projected at -22% by 2050 — secular population decline; favor cash flow + early exit over multi-decade hold.
Negotiation context
- Only 9 days on market — expect competitive offers; lowballing is unlikely to land.
- 7 sale attempts since 25y ago with the ask held roughly flat each time — persistent listings suggest the price (not the market) is what's stuck; bring a comps-based counter.
Questions for the listing agent
- What does the HOA fee cover, when was the last increase, and are there any pending special assessments or reserve-fund shortfalls?
- Any open or pending special assessments — roof, HVAC, plumbing, elevator, façade? What's the per-unit balance and payoff schedule, and is the seller paying it off at close or rolling it to the buyer?
- Is there a deadline driving the sale (1031 exchange, divorce, estate, relocation)? That informs how much negotiation room exists.
- Schools are B-rated — typically a magnet for longer-tenancy family renters. What's the average tenant stay here, and is there a school-zone premium baked into asking?
- What's the average days-on-market for RENTAL listings here right now (not sales)? A rising rental-DOM trend means longer vacancies and softer asking-rent achievability than the comps imply.
- What's the recent tenant-quality profile in this submarket — average credit score on applications, eviction rate, late-payment / NSF rate, and stable-employment percentage? A property-management company in the area should have these aggregated.
- How much new apartment / multifamily construction is in the pipeline within 1–3 miles? Heavy new supply (>2% of stock underway) typically softens rents 12–24 months out; light construction supports rent growth.
Investment metrics
- 1% rule
- 1.24% ✓
- Cap rate
- 8.78%
- Cash-on-cash
- 8.87%
- DSCR
- 1.39
- GRM
- 6.7
CMA / ARV
No comps found within radius.
Projected returns pro-forma
-3.0% appreciation · 3.0% rent growth · sell at horizon
- IRR
- -2.8%
- Equity multiple
- 0.89×
- Total profit
- $-5,463
- Equity at exit
- $27,584
- IRR
- 7.0%
- Equity multiple
- 1.52×
- Total profit
- $27,171
- Equity at exit
- $15,995
Cash invested: $51,800 (down + closing). Projections, not guarantees.
Landlord ↔ Tenant lean methodology
- Overall (STATE)
- 73 Landlord-Friendly
- State Ohio
- 73 Landlord-Friendly · R+6
- County
- — inherits STATE
- City
- — inherits STATE
ZIP-level market 44484
- Home prices YoY
- -17.5%
- Active inventory
- 92
- Price-to-rent
- 6.7×
Monthly cashflow live
- Estimated rent
- $2,300 medium interval (Pro) →
- Mortgage (P&I)
- −$970
- Tax from tax record
- −$197 /mo · $2,363/yr
- Insurance
- −$77
- HOA
- −$190
- Lot rent
- −$0
- Vacancy / Maint / Mgmt
- −$483
- Net cashflow
- $383
Break-even live
Sensitivity live
| Price | -10% $488 | -5% $435 | +0% $383 | +5% $330 | +10% $278 |
|---|---|---|---|---|---|
| Rent | -10% $201 | -5% $292 | +0% $383 | +5% $474 | +10% $565 |
| Rate | -1.0pp $476 | -0.5pp $430 | base $383 | +0.5pp $335 | +1.0pp $286 |
UW: 25.0% down · 7.5% · 30yr · 1.5% tax · 5.0% vac · 8.0% maint · 8.0% mgmt
Financing live
Cash to close
- Down payment
- $46,250
- Closing costs
- $5,550
- Reserves months
- —
- Total cash needed
- —
Loan-product check · same deal, 3 products live
Conventional
25% down · 7.5% · 30yr
- Down + closing
- —
- Monthly P&I
- —
- Monthly cashflow
- —
- DSCR
- —
- Eligible?
- —
Personal DTI + credit; lowest rate.
DSCR
20% down · 8.5% · 30yr
- Down + closing
- —
- Monthly P&I
- —
- Monthly cashflow
- —
- DSCR
- —
- Eligible?
- —
No personal income docs; deal must DSCR.
Hard money
10% down · 12.0% · 12mo
- Down + closing
- —
- Monthly P&I
- —
- Monthly cashflow
- —
- DSCR
- —
- Eligible?
- —
Short-term bridge; refi at stabilization.
Rent comps 1 comps
| Address | Beds | Baths | Sqft | Rent | $/sqft | DOM | Units | Dist |
|---|---|---|---|---|---|---|---|---|
| 300 Pegotty Ct NE Warren, OH | 3.0 | 2.5 | 1820 | $2,300 | $1.26 | 16d | 1 | 0.91mi |
HOA detail condo
- Monthly dues
- $190 · $2,280/yr
- Assessments
- None detected in remarks — confirm with the listing agent.
Listing history 19 events
-
2026-05-18status Pending 771-char remark
-
2026-05-13status Active 771-char remark
-
2026-05-04status Pending 771-char remark
-
2026-04-30$185,000 Active 771-char remark
-
2008-06-12soldstatus $125,000
-
2008-06-11soldstatus $125,000 184-char remark
Show marketing remark (184 chars)
Absolutely a beautiful condo. Open floor plan. New carpet in living room, dining room and 2 bedrooms. Interior painted in summer 2007. This is a first floor ranch with attached garage.
-
2008-06-03historical 184-char remark
Show marketing remark (184 chars)
Absolutely a beautiful condo. Open floor plan. New carpet in living room, dining room and 2 bedrooms. Interior painted in summer 2007. This is a first floor ranch with attached garage.
-
2007-11-04$133,900 184-char remark
Show marketing remark (184 chars)
Absolutely a beautiful condo. Open floor plan. New carpet in living room, dining room and 2 bedrooms. Interior painted in summer 2007. This is a first floor ranch with attached garage.
-
2005-07-19soldstatus $118,250
Show marketing remark (388 chars)
First Floor Condo. .. Wonderfully Open & Bright!New Carpeting in Dining room & Living room (5-05), Tiled Countertops & Backsplash, New Sink & Faucet, All Appliances stay, Large walk-in closet & Ceiling Fan in Master Bedroom. .. Skylight in Master Bath. .. Drapes in Dining room & Master Bedroom do not stay. .. Chandelier in Dining room does not stay
-
2005-07-18soldstatus $118,250
-
2005-05-31$124,900
Show marketing remark (388 chars)
First Floor Condo. .. Wonderfully Open & Bright!New Carpeting in Dining room & Living room (5-05), Tiled Countertops & Backsplash, New Sink & Faucet, All Appliances stay, Large walk-in closet & Ceiling Fan in Master Bedroom. .. Skylight in Master Bath. .. Drapes in Dining room & Master Bedroom do not stay. .. Chandelier in Dining room does not stay
-
2003-01-27soldstatus $99,000
-
2002-12-14historical
-
2002-06-18$105,000
-
2002-05-15historical
-
2001-11-20$115,000
-
2001-08-22historical
-
2001-02-22$118,000
-
1999-09-21soldstatus $97,000
ⓘ Source: listings_history table (triggers on properties + properties_extension) + one-shot
backfill from property_details.listing_events for pre-trigger history.
Tax reassessment forecast OH · Partial reset (capped growth)
- Current annual tax
- $2,363 · $197/mo
- Projected year-2 tax
- $2,624 · $219/mo
- Expected delta
- +$262/yr (+$22/mo · 11.1%)
ⓘ Screening estimate from a state-policy table — verify with the county assessor before closing.
Climate risk First Street
- Flood 1/10 Low FEMA zone X (unshaded) · 0% chance over 30 yrs
- Wildfire 1/10 Low
- Heat 3/10 Moderate 7 d/yr ≥96°F today · 17 d/yr by 30 yrs out
- Wind 1/10 Low
- Air quality 3/10 Moderate 2 unhealthy d/yr today · 5 by 30 yrs out
Nearby sold comps map
Loading sold comps map…
Walkable amenities ~0.75 mi
Loading nearby amenities…
Taxation est. · year 1
- Rental income
- $27,600
- − Mortgage interest
- −$10,363
- − Property taxes
- −$2,363
- − Insurance
- −$925
- − Repairs & maintenance
- −$2,208
- − Management
- −$2,208
- − HOA
- −$2,280
- − Depreciation
- −$5,382
- Taxable income
- $1,871
- Est. tax owed @ 24.0%
- −$449
- After-tax cash flow
- $4,145/yr
For passive investors: Depreciation is non-cash, so a rental often shows a tax loss while cash-flowing — sheltering income. Rental losses are passive: they offset passive income freely, and up to $25,000/yr can offset ordinary (W-2) income if you actively participate and your MAGI is under $100k (phasing out to $0 by $150k); unused losses carry forward. On sale, claimed depreciation is recaptured at up to 25%, and gains may owe capital-gains tax (a 1031 exchange can defer both). Figures are a year-1 estimate at your 24.0% rate — not tax advice; consult a CPA.
Schools (NCES district)
- District
- Howland Local
- NCES district ID
- 3905016
- Math proficiency
- 59% ▼ -17.00%
- Reading proficiency
- 65% ▼ -13.00%
- Median HH income
- $49,022
- Composite
- 52.63/100
- National rank
- #1556
- State rank
- #260 of 656 in OH
Livability — Howland Center
- Score
- 76/100
- State rank
- #207
- US rank
- #3283
Category grades
Schools grade is shown separately in the Schools card above.
Census & demographics
- County
- Trumbull · 193,293 people
- City population
- 21,634
- Metro
- Youngstown-Warren, OH
- Population (ZIP)
- 21,634
- Household income
- $65,435
- Rent vs Own
- Severe rent burden
- 6.7
Population outlook (Trumbull County) Hauer SSP2
- Today (2025)
- 191,696 people
- By 2030
- 184,015 · -4.0%
- By 2040
- 166,810 · -13.0%
- By 2050
- 149,857 · -21.8%
- By 2075
- 115,769 · -39.6%
- By 2100
- 83,617 · -56.4%
Race, ethnicity, and origin ACS 2023
- Neighborhood character
- Predominantly White (84%)
- Race & ethnicity
- White 84% Black 8% Two or more races 5% Hispanic / Latino 3% Asian 2%
- Common ancestry
- Romanian 3% Lithuanian 2% Serbian 1%
- Foreign-born
- 3% · China, Canada
- Languages at home
- 96% English-only · Other Indo-European 2% Other Asian/Pacific 1% Spanish 1%
Political lean MEDSL · Trumbull
- 2024 margin
- R (+16.8) · D 41.2% · R 58.0%
- 2008→2024 swing
- -39.2pp toward R · 2008: 22.4pp · 2024: -16.8pp
- All cycles
- 2024: R+16.8 2020: R+10.6 2016: R+6.4 2012: D+22.2 2008: D+22.4
Not yet ingested
- Civics
- —
Market trends
- HPI YoY
- ▼ -46.24%
- Current HPI
- 217.6603
- Rent YoY
- —
- Metro
- —
- State GDP YoY
- ▲ 1.98%
- F500 in state
- 48
Industry mix (Fortune 500 HQ in OH)
| Industry | F500 HQs | Revenue |
|---|---|---|
| Insurance | 3 | $145B |
|
||
| Industrial Machinery | 3 | $49B |
|
||
| Financial Services | 3 | $24B |
|
||
| Consumer Goods | 2 | $93B |
|
||
| Aerospace / Defense | 2 | $47B |
|
||
| Utilities | 2 | $33B |
|
||
Price history
+80.4% since first listed21 events — show timeline
- 2026-05-29 Sold (Public Records) $175,000 Public Records
- 2026-05-29 Sold (MLS) $175,000 MLSNOW
- 2026-05-18 Pending — MLSNOW
- 2026-05-13 Relisted — MLSNOW
- 2026-05-04 Pending — MLSNOW
- 2026-04-30 Listed $185,000 MLSNOW
- 2008-06-12 Sold (Public Records) $125,000 Public Records
- 2008-06-11 Sold (MLS) $125,000 MLSNOW
- 2008-06-03 Listing Removed — MLSNOW
- 2007-11-04 Listed $133,900 MLSNOW
- 2005-07-19 Sold (MLS) $118,250 MLSNOW
- 2005-07-18 Sold (Public Records) $118,250 Public Records
- 2005-05-31 Listed $124,900 MLSNOW
- 2003-01-27 Sold (Public Records) $99,000 Public Records
- 2002-12-14 Listing Removed — MLSNOW
- 2002-06-18 Listed $105,000 MLSNOW
- 2002-05-15 Listing Removed — MLSNOW
- 2001-11-20 Listed $115,000 MLSNOW
- 2001-08-22 Listing Removed — MLSNOW
- 2001-02-22 Listed $118,000 MLSNOW
- 1999-09-21 Sold (Public Records) $97,000 Public Records
Property tax history
+5.1%/yrLatest (2025): $2,363 · -0.1% YoY. Source: county tax records.
Cash-flow waterfall
monthlySold comps — $/sqft
last 12 mo · ≤1 miLoading sold comps…