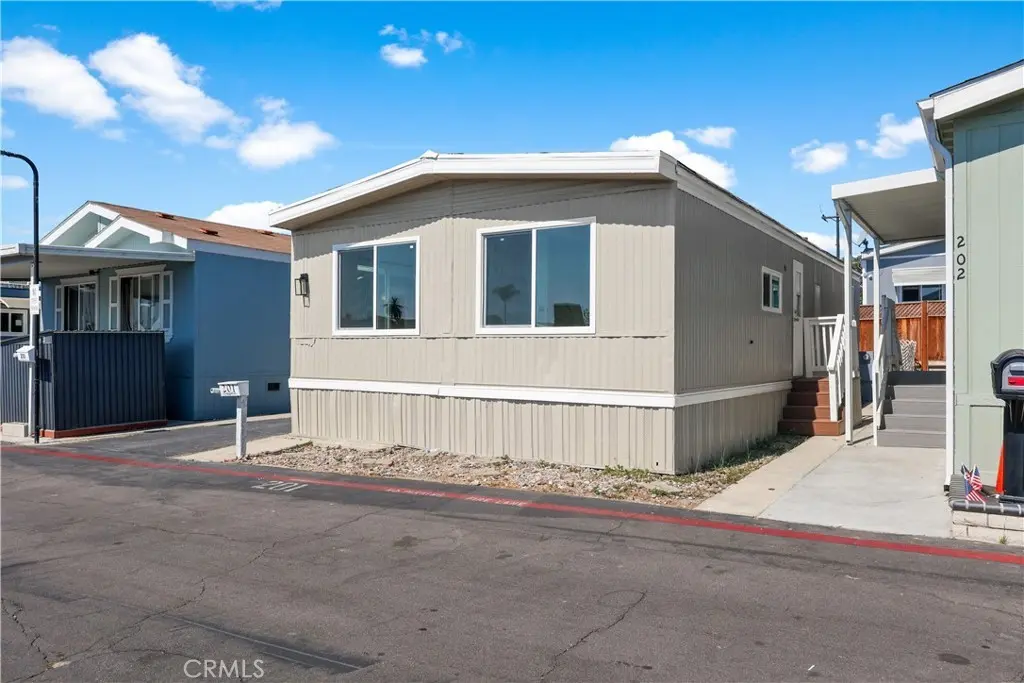
23701 Western Ave #201 · Torrance, CA
Flood risk 1/10 · Minimal
- FEMA flood zone
- X (unshaded)
- Chance of flooding over 30 yrs
- 0.0%
- Est. flood insurance / yr
- $507 – $1,088
Fire risk 1/10 · Minimal
- Est. fire insurance / yr
- $659 – $1,223
Heat risk 3/10 · Minor
- Hot days now (above 86°F)
- 7 days/yr
- Hot days in 30 yrs
- 22 days/yr
Wind risk 1/10 · Minimal
- Chance of severe wind over 30 yrs
- —
Air-quality risk 5/10 · Moderate
- Unhealthy air days now
- 7 days/yr
- Unhealthy air days in 30 yrs
- 7 days/yr
Risk factors via First Street. Map © Google.
Why this score? — see what drove the B grade
The composite is a weighted blend of 9 inputs, each scored 0–100. Each bar is that input's sub-score; the figure is the points it added to the 100-point composite (weight × sub-score).
- Cash flow +30.0/30.0
- 1% rule +10.0/10.0
- DSCR +10.0/10.0
- ARV discount +7.5/15.0
- Schools +5.9/10.0
- Livability +3.8/5.0
- Rent growth +3.3/5.0
- Condition / age +2.5/5.0
- Appreciation +0.0/10.0
$146,900
🖨 Deal sheet 📄 Offer letter ✓ Due diligence
Listing remarks
Welcome to your perfect opportunity to stay in the desirable City of Torrance! This fully renovated 3-bedroom, 2-bathroom mobile home in the sought-after Knolls Lodge community is completely move-in ready and waiting for you. No need to worry about repairs, updates, or renovations—everything has been meticulously completed so you can simply unpack your belongings and start enjoying your new home from day one. This home has been completely transformed with premium upgrades including brand new flooring throughout, new energy-efficient windows, new doors, modern kitchen cabinets, and elegant quartz countertops. Every detail has been thoughtfully updated to provide you with a fresh, conte
Key facts
- Fully renovated
- Two swimming pools
- Premium upgrades
Tags
Property features AI
Finance
- Other: Listing handled by Pellego, Inc.; listing team: The Gutierrez Group
- Financial info: Monthly land lease approximately $2,300 (park-reported); Rent includes water and trash
- HOA & community: Land lease in a park (Knolls Lodge) with manager approval required; Park amenities include sidewalks and a community pool
Exterior
- Parking: Uncovered parking available; Parking included (in mobile park)
- Security: Carbon monoxide and smoke detectors
- Utilities: Public sewer; District/public water; Electricity connected; Water connected; Sewer connected
- Home design: Single-story mobile home; Raised foundation; Mobile home remains on site; Mobile dimensions approximately 20' x 45'; Total of one story; Property condition ranges from fixer to turnkey; updated/remodeled areas
- Construction: Raised foundation; Siding skirt
- Exterior features: Wood fencing; Community pool; Siding skirting; Rectangular lot shape; Has a view
Interior
- Kitchen: Microwave; Propane range; Range/stove hood; Kitchen open to family room; Quartz counters
- Bedrooms: Single-level layout (one story)
- Flooring: Vinyl flooring
- Bathrooms: Two full bathrooms; Upgraded and remodeled baths with quartz counters and walk-in shower
- Heating & cooling: Fireplace heating; Central cooling
- Interior features: Quartz counters throughout; Recessed lighting; Open floor plan; Sliding glass door(s); Double pane windows; Carbon monoxide and smoke detectors
- Laundry & utility: Laundry area in kitchen; Stackable washer/dryer hookup
Neighborhood map
What this means for you Summary
Snapshot
- This is a 3-bed/2.0-bath manufactured listed at $147k.
Deal economics
- At list price, monthly cash flow is $1k ($17k/yr) — positive.
- The deal already cash-flows at list — no discount required.
- Meets the 1% rule at list price ($3k rent vs $147k).
- Recommended offer: $142k (3.0% below list) — sets the bar for market timing.
- Cap rate 18.0% vs local median 2.1% in Torrance — top-decile yield for the area; either an underpriced asset or a hidden risk that comps aren't pricing in. Stress-test before assuming the spread holds.
Location & tenants
- Location reads 76/100 on livability (#95 in CA, #3,501 nationally) — a middle-class / working-renter tenant base. Strengths: amenities A+, commute A+, employment A+; Watch: health & safety C-, crime D+, cost of living F.
- Torrance Unified (urban): math 62% / reading 67% proficiency, ranked #150 of 1,400 in CA (top 11%) — acceptable for families but not a draw, mixed tenant base, ~2y average lease; only 20% free/reduced lunch — higher-income household profile.
- Zoned schools: John Adams Elementary (357 students, 31% FRL); Torrance High (1,999 students, 30% FRL).
- Market conditions: Rents rising (+3.2%/yr); 96 active listings in the ZIP; 40 comparable units currently listed for rent nearby; rentals lingering (median 44d on market — plan ~5-8 weeks vacancy on turnover, expect pricing pressure); 50% of comp listings sitting > 30 days — soft ceiling on asking rent; solid renter incomes; 19,697 units permitted in Los Angeles County in 2024 (9,426 in 5+ unit buildings).
- This rent runs 40% of the median local income ($93k/yr) — at the standard rent-burdened threshold; future hikes will face affordability resistance.
Forward outlook
- Local home prices are declining (-3.0%/yr); year-one equity from $1k of loan paydown is wiped out by about $4k of value loss. Plan a longer hold.
- Los Angeles County population projected at +9% by 2050 — modest demand growth; plan on rents tracking national, not racing it.
- At projected returns (-3.0% appreciation + 3.2% rent growth), your $41k cash investment doubles in ~3 years — after that, you're playing with house money.
Negotiation context
- It's been on market 47 days — a 3% lower offer ($142k) is reasonable based on typical stale-listing flexibility.
- 6 sale attempts since 29y ago with the ask held roughly flat each time — persistent listings suggest the price (not the market) is what's stuck; bring a comps-based counter.
- Current owner paid $55k; list at $147k implies a 167% gain — meaningful room to come down on a strong offer.
Questions for the listing agent
- It's been on market 47 days. Have you received any prior offers? Is the seller open to a 3% concession, seller financing, or rate buy-down credit?
- Built in 1972 — when were the roof, HVAC, electrical panel, plumbing, and water heater last replaced?
- Is there a deadline driving the sale (1031 exchange, divorce, estate, relocation)? That informs how much negotiation room exists.
- Schools are A-rated — typically a magnet for longer-tenancy family renters. What's the average tenant stay here, and is there a school-zone premium baked into asking?
- Crime grade is D in this area — have there been break-ins, vandalism, or insurance claims at this property in the last 3 years? What carrier currently insures it and at what premium?
- What's the average days-on-market for RENTAL listings here right now (not sales)? A rising rental-DOM trend means longer vacancies and softer asking-rent achievability than the comps imply.
- What's the recent tenant-quality profile in this submarket — average credit score on applications, eviction rate, late-payment / NSF rate, and stable-employment percentage? A property-management company in the area should have these aggregated.
- How much new for-sale + rental construction is in the pipeline within 1–3 miles? Heavy new supply typically softens prices + rents 12–24 months out; constrained supply supports both.
Investment metrics
- 1% rule
- 2.11% ✓
- Cap rate
- 18.03%
- Cash-on-cash
- 41.91%
- DSCR
- 2.86
- GRM
- 3.9
CMA / ARV
- ARV (median comp)
- $78,460
- List price
- $146,900
- Delta
- 87.23%
- Verdict
- OVERPRICED
- Comps
- 12 within 1.0 mi
Show comp detail 12 sales within ~0.75 mi
| Address | Dist | Beds/Ba | Sqft | Sold | Price | $/sf | Match |
|---|---|---|---|---|---|---|---|
| 23701 S Western Ave #259 | 0.01mi | 2/1.0 (-1) | 900 (+2%) | 2mo | $42,500 | $47 | 85 |
| 23701 S Western Ave #130 | 0.01mi | 2/2.0 (-1) | 846 (-4%) | 4mo | $184,201 | $218 | 85 |
| 23701 S Western Ave #45 | 0.01mi | 2/2.0 (-1) | 840 (-4%) | 6mo | $69,900 | $83 | 82 |
| 23701 S Western #247 | 0.01mi | 2/1.0 (-1) | 950 (+8%) | 6mo | $39,000 | $41 | 72 |
| 23701 S Western Ave #200 | 0.01mi | 2/2.0 (-1) | 936 (+6%) | 15mo | $130,000 | $139 | 72 |
| 23701 S Western Ave #245 | 0.01mi | 3/2.0 | 960 (+9%) | 16mo | $145,000 | $151 | 72 |
| 23701 Western #258 | 0.01mi | 3/1.0 | 960 (+9%) | 11mo | $73,000 | $76 | 71 |
| 23701 S Western Ave #136 | 0.01mi | 2/2.0 (-1) | 800 (-9%) | 12mo | $73,000 | $91 | 70 |
| 23701 S Western Ave #213 | 0.01mi | 3/2.0 | 1,009 (+15%) | 15mo | $149,600 | $148 | 62 |
| 2103 245th St #7 | 0.62mi | 2/2.0 (-1) | 852 (-3%) | 1mo | $225,000 | $264 | 60 |
| 23701 S Western Ave #241 | 0.01mi | 3/2.0 | 1,000 (+14%) | 22mo | $155,000 | $155 | 59 |
| 24200 Walnut Ave #69 | 0.22mi | 2/1.0 (-1) | 960 (+9%) | 24mo | $125,000 | $130 | 46 |
Match score weights: distance 35% · size 25% · config 20% · recency 20%. Top-matched comps best support the ARV.
Projected returns pro-forma
-3.0% appreciation · 3.25% rent growth · sell at horizon
- IRR
- 38.9%
- Equity multiple
- 2.67×
- Total profit
- $68,526
- Equity at exit
- $21,903
- IRR
- 45.4%
- Equity multiple
- 5.40×
- Total profit
- $180,912
- Equity at exit
- $12,701
Cash invested: $41,132 (down + closing). Projections, not guarantees.
Landlord ↔ Tenant lean methodology
- Overall (STATE)
- 18 Strongly Tenant-Friendly
- State California
- 18 Strongly Tenant-Friendly · D+13
- County
- — inherits STATE
- City
- — inherits STATE
ZIP-level market 90501
- Rents YoY
- 3.2%
- Active inventory
- 96
- Price-to-rent
- 3.9×
Monthly cashflow live
- Estimated rent
- $3,104 high interval (Pro) →
- Mortgage (P&I)
- −$770
- Tax est. 1.5%
- −$184 /mo · $2,204/yr
- Insurance
- −$61
- HOA
- −$0
- Vacancy / Maint / Mgmt
- −$652
- Net cashflow
- $1,437
Break-even live
UW: 25.0% down · 7.5% · 30yr · 1.5% tax · 5.0% vac · 8.0% maint · 8.0% mgmt
Financing live
Cash to close
- Down payment
- $36,725
- Closing costs
- $4,407
- Reserves months
- —
- Total cash needed
- —
Loan-product check · same deal, 3 products live
Conventional
25% down · 7.5% · 30yr
- Down + closing
- —
- Monthly P&I
- —
- Monthly cashflow
- —
- DSCR
- —
- Eligible?
- —
Personal DTI + credit; lowest rate.
DSCR
20% down · 8.5% · 30yr
- Down + closing
- —
- Monthly P&I
- —
- Monthly cashflow
- —
- DSCR
- —
- Eligible?
- —
No personal income docs; deal must DSCR.
Hard money
10% down · 12.0% · 12mo
- Down + closing
- —
- Monthly P&I
- —
- Monthly cashflow
- —
- DSCR
- —
- Eligible?
- —
Short-term bridge; refi at stabilization.
Rent comps 40 comps
| Address | Beds | Baths | Sqft | Rent | $/sqft | DOM | Units | Dist |
|---|---|---|---|---|---|---|---|---|
| 2124 W 238th St Unit A Torrance, CA | 2.0 | 2.0 | 750 | $3,600 | $4.80 | 17d | 1 | 0.48mi |
| 2128 W 238th St Unit A Torrance, CA | 2.0 | 2.0 | 750 | $3,500 | $4.67 | 43d | 1 | 0.48mi |
| 2174 1st St Unit 237th St unit Torrance, CA | 2.0 | 1.0 | 800 | $2,500 | $3.12 | 24d | 1 | 0.56mi |
| 1802 247th St Unit 1802 Lomita, CA | 2.0 | 1.0 | 800 | $3,200 | $4.00 | 43d | 1 | 0.64mi |
| 24636 Eshelman Ave Lomita, CA | 2.0 | 1.0 | 950 | $2,950 | $3.11 | 5d | 1 | 0.66mi |
| 24638 Eshelman Ave Unit 1/4 Lomita, CA | 2.0 | 1.0 | 950 | $2,950 | $3.11 | 43d | 1 | 0.66mi |
| 1311 Sepulveda Blvd Torrance, CA | 2.0 | 2.0 | 1050 | $3,650 | $3.48 | 20d | 1 | 0.67mi |
| 1567 W 228th St Torrance, CA | 2.0 | 2.0 | 990 | $3,200 | $3.23 | 43d | 1 | 0.68mi |
| 1657 W 227th St Apt 1 Torrance, CA | 2.0 | 1.0 | 575 | $2,150 | $3.74 | 43d | 1 | 0.73mi |
| 1612 226th St Unit B Torrance, CA | 2.0 | 1.0 | 850 | $2,650 | $3.12 | 43d | 1 | 0.78mi |
| 2757 Andreo Ave Torrance, CA | 2.0 | 2.0 | 1100 | $3,295 | $3.00 | 43d | 1 | 0.81mi |
| 2757 Andreo Ave Unit 6 Torrance, CA | 2.0 | 2.0 | 1100 | $2,933 | $2.67 | 3d | 1 | 0.81mi |
| 2757 Andreo Ave Unit 5 Torrance, CA | 2.0 | 2.0 | 1100 | $2,933 | $2.67 | 22d | 1 | 0.81mi |
| 2757 Andreo Ave Unit 3 Torrance, CA | 2.0 | 2.0 | 1100 | $2,933 | $2.67 | 11d | 1 | 0.81mi |
| 2757 Andreo Ave Unit 3 Torrance, CA | 2.0 | 1.5 | 1100 | $2,933 | $2.67 | 3d | 1 | 0.81mi |
| 2757 Andreo Ave Unit 5 Torrance, CA | 2.0 | 1.5 | 1100 | $2,993 | $2.72 | 11d | 1 | 0.81mi |
| 1318 W 227th St Torrance, CA | 2.0 | 1.0 | 640 | $2,250 | $3.52 | 43d | 1 | 0.88mi |
| 1318 W 227th St Torrance, CA | 2.0 | 1.0 | 640 | $2,250 | $3.52 | 1d | 1 | 0.88mi |
| 1533 Plaza del Amo Unit 4 Torrance, CA | 2.0 | 1.0 | 978 | $2,650 | $2.71 | 4d | 1 | 0.88mi |
| 25110 Eshelman Ave Lomita, CA | 2.0 | 1.5 | 800 | $2,245 | $2.81 | 10d | 1 | 0.95mi |
| 24836 Narbonne Ave Lomita, CA | 2.0 | 1.0 | 740 | $2,995 | $4.05 | 43d | 1 | 0.96mi |
| 1332 W 225th St Unit 1 Torrance, CA | 2.0 | 1.0 | 900 | $2,095 | $2.33 | 43d | 1 | 0.98mi |
| 2758 Orange Ave Unit 10 Torrance, CA | 2.0 | 1.5 | 950 | $2,800 | $2.95 | 13d | 1 | 0.99mi |
| 2457 Lomita Blvd Lomita, CA | 2.0 | 1.0–2.0 | 878 | $5,036 | $5.74 | 2d | 14 | 1.02mi |
| 2308 Cabrillo Ave Apt 8 Torrance, CA | 2.0 | 2.0 | 950 | $2,200 | $2.32 | 7d | 1 | 1.06mi |
| 24410 Crenshaw Blvd Torrance, CA | 2.0 | 2.0 | 1010 | $2,795 | $2.77 | 4d | 1 | 1.10mi |
| 2525 W 235th St Unit 10656A Torrance, CA | 2.0 | 1.5 | 1073 | $4,210 | $3.92 | 43d | 1 | 1.11mi |
| 2545 W 235th St Torrance, CA | 2.0 | 1.0–1.5 | 984 | $3,325 | $3.38 | 3d | 5 | 1.15mi |
| 1611 W 221st St Torrance, CA | 2.0 | 1.5 | 650 | $2,600 | $4.00 | 43d | 1 | 1.19mi |
| 806 Coriander Dr Unit H Torrance, CA | 2.0 | 2.0 | 829 | $2,500 | $3.02 | 24d | 1 | 1.22mi |
| 1800 255th St Unit 1812-A Lomita, CA | 2.0 | 1.0 | 750 | $2,145 | $2.86 | 43d | 1 | 1.23mi |
| 2585 W 235th St Unit 10599A Torrance, CA | 2.0 | 1.0 | 896 | $3,880 | $4.33 | 43d | 1 | 1.24mi |
| 817 W 232nd St Unit G Torrance, CA | 2.0 | 1.5 | 900 | $3,250 | $3.61 | 18d | 1 | 1.24mi |
| 1648 255th St W Harbor City, CA | 2.0 | 2.0 | 800 | $3,400 | $4.25 | 43d | 1 | 1.24mi |
| 23318 Sesame St Unit H Torrance, CA | 2.0 | 2.0 | 852 | $2,595 | $3.05 | 22d | 1 | 1.27mi |
| 1903 Cabrillo Ave Unit C Torrance, CA | 2.0 | 1.0 | 700 | $2,700 | $3.86 | 43d | 1 | 1.31mi |
| 2635 W 235th St Unit 8890A Torrance, CA | 2.0 | 1.5 | 1073 | $4,120 | $3.84 | 43d | 1 | 1.31mi |
| 2639 W 235th St Unit 11270A Torrance, CA | 2.0 | 2.0 | 1073 | $4,260 | $3.97 | 43d | 1 | 1.33mi |
| 2655 W 235th St Unit 11106A Torrance, CA | 2.0 | 1.0 | 997 | $4,170 | $4.18 | 43d | 1 | 1.36mi |
| 1565 W 218th St Torrance, CA | 2.0 | 1.0 | 728 | $2,700 | $3.71 | 43d | 1 | 1.43mi |
Listing history 25 events
-
2026-06-18days on market $146,900 Active 47 DOM
-
2026-06-17days on market $146,900 Active 46 DOM
-
2026-06-16days on market $146,900 Active 45 DOM
-
2026-06-15days on market $146,900 Active 44 DOM
-
2026-06-13days on market $146,900 Active 42 DOM
-
2026-06-13days on market $146,900 Active 41 DOM
-
2026-06-09days on market $146,900 Active 38 DOM
-
2026-06-08days on market $146,900 Active 37 DOM
-
2026-06-07days on market $146,900 Active 36 DOM
-
2026-06-04days on market $146,900 Active 33 DOM
-
2026-06-03days on market $146,900 Active 32 DOM
-
2026-06-02days on market $146,900 Active 31 DOM
-
2026-06-01days on market $146,900 Active 30 DOM
-
2026-05-31days on market $146,900 Active 29 DOM
-
2026-05-02$146,900 Active 1283-char remark
-
2026-04-20historical
-
2026-02-11$147,000 Active
-
2025-10-19status Active
-
2025-09-04status Pending Sale
-
2025-08-15$149,800 Active
-
2025-03-14soldstatus $55,000 Closed Sale
-
2025-02-03historical
-
2025-02-03$30,000
-
1997-04-01historical
-
1997-02-25$19,900
ⓘ Source: listings_history table (triggers on properties + properties_extension) + one-shot
backfill from property_details.listing_events for pre-trigger history.
Climate risk First Street
- Flood 1/10 Low FEMA zone X (unshaded) · 0% chance over 30 yrs
- Wildfire 1/10 Low
- Heat 3/10 Moderate 7 d/yr ≥86°F today · 22 d/yr by 30 yrs out
- Wind 1/10 Low
- Air quality 5/10 Major 7 unhealthy d/yr today · 7 by 30 yrs out
Nearby sold comps map
Loading sold comps map…
Walkable amenities ~0.75 mi
Loading nearby amenities…
Taxation est. · year 1
- Rental income
- $37,243
- − Mortgage interest
- −$8,229
- − Property taxes
- −$2,204
- − Insurance
- −$734
- − Repairs & maintenance
- −$2,979
- − Management
- −$2,979
- − Depreciation
- −$4,273
- Taxable income
- $15,844
- Est. tax owed @ 24.0%
- −$3,803
- After-tax cash flow
- $13,437/yr
For passive investors: Depreciation is non-cash, so a rental often shows a tax loss while cash-flowing — sheltering income. Rental losses are passive: they offset passive income freely, and up to $25,000/yr can offset ordinary (W-2) income if you actively participate and your MAGI is under $100k (phasing out to $0 by $150k); unused losses carry forward. On sale, claimed depreciation is recaptured at up to 25%, and gains may owe capital-gains tax (a 1031 exchange can defer both). Figures are a year-1 estimate at your 24.0% rate — not tax advice; consult a CPA.
Schools (NCES district)
- District
- Torrance Unified
- NCES district ID
- 0639420
- Math proficiency
- 62% ▲ 2.00%
- Reading proficiency
- 67% ▬ 0.00%
- Median HH income
- $78,640
- Composite
- 58.96/100
- National rank
- #1969
- State rank
- #150 of 1400 in CA
Livability — Torrance
- Score
- 76/100
- State rank
- #95
- US rank
- #3501
Category grades
Schools grade is shown separately in the Schools card above.
Census & demographics
- Census place
- Torrance, CA
- County
- Los Angeles County · 9,444,647 people
- City population
- 153,473
- Metro
- Los Angeles-Long Beach-Anaheim, CA
- Population (ZIP)
- 41,787
- Household income
- $92,923
- Rent vs Own
- Severe rent burden
- 1972.0
Population outlook (Los Angeles County) Hauer SSP2
- Today (2025)
- 10,940,515 people
- By 2030
- 11,256,481 · +2.9%
- By 2040
- 11,729,929 · +7.2%
- By 2050
- 11,948,407 · +9.2%
- By 2075
- 11,818,114 · +8.0%
- By 2100
- 10,842,928 · -0.9%
Race, ethnicity, and origin ACS 2023
- Neighborhood character
- Diverse neighborhood (Simpson 0.70)
- Race & ethnicity
- Hispanic / Latino 43% Asian 27% White 20% Two or more races 15% Black 5%
- Hispanic origin (detail)
- Mexican 34%
- Common ancestry
- Slovak 1% Lithuanian 1% British 1%
- Foreign-born
- 33% · Canada, South Korea, China
- Languages at home
- 46% English-only · Spanish 32% Other Asian/Pacific 5% Korean 5%
Political lean MEDSL · Los Angeles
- 2024 margin
- Solid D (+32.9) · D 64.8% · R 31.9% · Other 3.3%
- 2008→2024 swing
- -7.4pp toward R · 2008: 40.4pp · 2024: 32.9pp
- All cycles
- 2024: D+32.9 2020: D+44.2 2016: D+48.0 2012: D+40.0 2008: D+40.4
Not yet ingested
- Civics
- —
Market trends
- HPI YoY
- ▼ -755.95%
- Current HPI
- 334.9041
- Rent YoY
- ▲ 3.25%
- Metro
- Los Angeles-Long Beach-Anaheim, CA
- State GDP YoY
- ▲ 3.21%
- F500 in state
- 116
Industry mix (Fortune 500 HQ in CA)
| Industry | F500 HQs | Revenue |
|---|---|---|
| Technology | 27 | $1,492B |
|
||
| Financial Services | 3 | $174B |
|
||
| Retail | 3 | $44B |
|
||
| Insurance | 3 | $26B |
|
||
| Media / Entertainment | 2 | $115B |
|
||
| Pharmaceuticals / Biotech | 2 | $62B |
|
||
Price history
+638.2% since first listed11 events — show timeline
- 2026-05-02 Listed $146,900 CRMLS
- 2026-04-20 Listing Removed — CRMLS
- 2026-02-11 Listed $147,000 CRMLS
- 2025-10-19 Relisted — CRMLS
- 2025-09-04 Pending — CRMLS
- 2025-08-15 Listed $149,800 CRMLS
- 2025-03-14 Sold (MLS) $55,000 CRMLS
- 2025-02-03 Listing Removed — CRMLS
- 2025-02-03 Listed $30,000 CRMLS
- 1997-04-01 Listing Removed — CRMLS
- 1997-02-25 Listed $19,900 CRMLS
Cash-flow waterfall
monthlySold comps — $/sqft
last 12 mo · ≤1 miLoading sold comps…