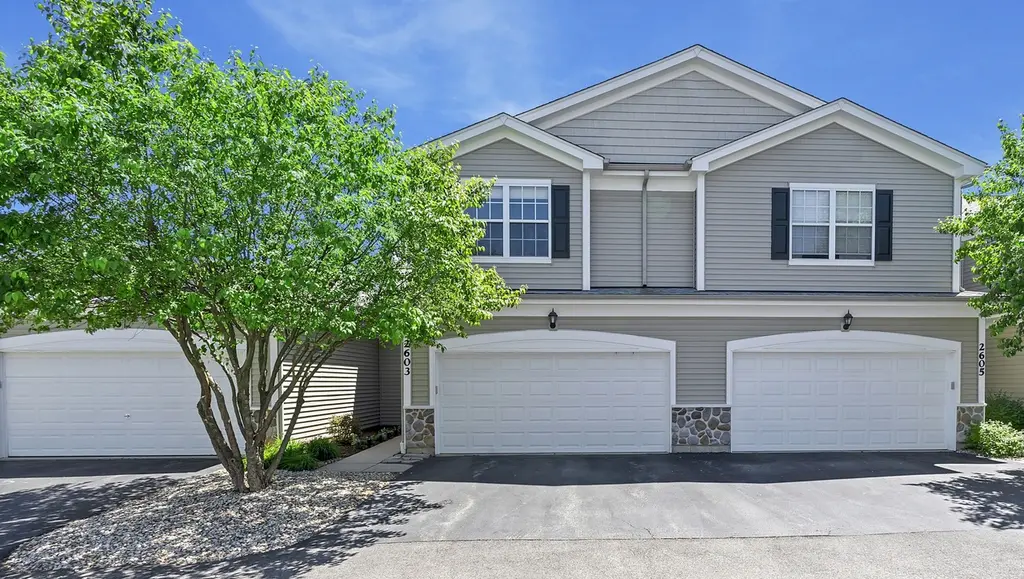
2603 Kendall Xing · Johnsburg, IL
Flood risk 1/10 · Minimal
- FEMA flood zone
- X (unshaded)
- Chance of flooding over 30 yrs
- 0.0%
- Est. flood insurance / yr
- $473 – $860
Fire risk 1/10 · Minimal
- Est. fire insurance / yr
- $804 – $1,492
Heat risk 2/10 · Minimal
- Hot days now (above 100°F)
- 7 days/yr
- Hot days in 30 yrs
- 14 days/yr
Wind risk 2/10 · Minimal
- Chance of severe wind over 30 yrs
- —
Air-quality risk 2/10 · Minimal
- Unhealthy air days now
- 1 days/yr
- Unhealthy air days in 30 yrs
- 1 days/yr
Risk factors via First Street. Map © Google.
Why this score? — see what drove the F grade
The composite is a weighted blend of 9 inputs, each scored 0–100. Each bar is that input's sub-score; the figure is the points it added to the 100-point composite (weight × sub-score).
- Appreciation +10.0/10.0
- Cash flow +6.4/30.0
- Livability +4.0/5.0
- 1% rule +3.4/10.0
- ARV discount +2.6/15.0
- Rent growth +2.5/5.0
- Condition / age +2.5/5.0
- Schools +2.2/10.0
- DSCR +0.7/10.0
$299,900
🖨 Deal sheet (PDF) 📄 Offer letter ✓ Due diligence
Listing remarks MLS
ABSOLUTLEY FABULOUS 3 BEDS / 2.2 BATHS CONNEMARA MODEL TOWN HOME WITH FULL FINISHED ENGLISH BASEMENT WITH VIEWS OF THE WETLANDS. This Open Floor Concept home has an Oversized Living Room with Brazilian Cherry Hardwood Floors, Eat-In Kitchen w/ Island, Large Master Bedroom w/ Master Bath w/ Dual Sinks and Walk-In Closet, 2 Generous Sized Additional Bedrooms on the 2nd Floor, Full Finished Basement w/ Half Bath, Washer and Dryer, 2 Car Garage, Beautiful views of the Wetlands from your Deck, Johnsburg Schools, Must See!
Key facts
- Hardwood floor
- New appliances
- Private full bath
Tags
Property features AI
Finance
- Other: Four-unit building; Approximately 2,245 total finished/unfinished square feet (1,609 main); Below-grade finished area present (~636)
- HOA & community: Monthly association fee of $400; HOA fee covers insurance, exterior maintenance, lawn care, and snow removal; Managed by off-site manager; Pets allowed (cats and dogs), maximum pet weight 100 lbs
Exterior
- Parking: Attached garage (owned) with garage door opener; Asphalt driveway; Two garage parking spaces (two total parking spaces)
- Utilities: Public water; Public sewer; Electric service with circuit breakers and 100 amp service
- Home design: Attached single property; Two-story townhouse; Entry level is 1st floor; Model: CONNEMARA
- Construction: Built approximately 16–20 years ago; Vinyl siding and brick exterior; Asphalt roof; Concrete perimeter foundation
- Exterior features: Common grounds; School bus service available
Interior
- Kitchen: Range; Microwave; Dishwasher; Refrigerator; Kitchen with ceramic tile flooring
- Bedrooms: Three bedrooms (master on second level; additional bedrooms on second level)
- Flooring: Hardwood flooring in main living areas; Carpet in most bedrooms and basement family room; Ceramic tile in kitchen, dining room, and laundry
- Bathrooms: Two full bathrooms; Two half bathrooms; Basement contains a bathroom
- Heating & cooling: Natural gas forced-air heating; Central air conditioning
- Interior features: Seven total rooms; Finished full basement
- Laundry & utility: Washer and dryer included; Washer hookup in unit; Laundry closet (basement)
Neighborhood map
What this means for you Summary
Snapshot
- This is a 3-bed/3.0-bath townhouse listed at $300k.
Deal economics
- At list price, monthly cash flow is $-515 ($-6k/yr) — negative.
- To cash-flow at today's rent, offer at most $209k (30.3% below list).
- To meet the 1% rule (rent ≥ 1% of price), the offer needs to be $251k (16.4% below list).
- Recommended offer: $209k (30.3% below list) — sets the bar for cash-flow.
- Cap rate 4.2% vs local median 2.9% in Johnsburg — top-decile yield for the area; either an underpriced asset or a hidden risk that comps aren't pricing in. Stress-test before assuming the spread holds.
Location & tenants
- Location reads 80/100 on livability (#111 in IL, #1,796 nationally) — a professional / high-income tenant draw. Strengths: crime A+, employment A+, housing A+; Watch: cost of living C-, amenities F, commute F.
- Johnsburg CUSD 12 (suburban): math 22% / reading 21% proficiency, ranked #321 of 620 in IL (top 52%) — low school quality limits family demand, transient renter base, plan for 1-2y turnover; only 19% free/reduced lunch — higher-income household profile.
- Zoned schools: Ringwood School Primary Ctr (433 students, 0% FRL); Johnsburg Jr High School (math 23% / reading 26%, grade F, #332 of 665 statewide, top 55%, 344 students, 0% FRL); Johnsburg High School (math 27% / reading 32%, grade F, #187 of 693 statewide, top 30%, 560 students, 0% FRL) — zoned schools average 0% FRL vs 19% district-wide (19 pts lower); this property's tenant base skews higher-income than the district average.
- Market conditions: 151 active listings in the ZIP; 7 comparable units currently listed for rent nearby; rentals leasing fast (median 3d on market — plan ~1-2 weeks tenant-placement turnaround); 1,595 units permitted in McHenry County in 2024 (485 in 5+ unit buildings).
Forward outlook
- In year one you build about $32k of equity ($2k loan paydown + $30k appreciation (10.0% local appreciation)).
- McHenry County population projected at -12% by 2050 — secular population decline; favor cash flow + early exit over multi-decade hold.
- By year 2, paydown + projected appreciation supports a ~$52k cash-out refi (75% LTV) — recoverable capital for the next deal without selling this one.
Negotiation context
- Only 13 days on market — expect competitive offers; lowballing is unlikely to land.
- 6 sale attempts since 7y ago with the ask held roughly flat each time — persistent listings suggest the price (not the market) is what's stuck; bring a comps-based counter.
- Current owner paid $230k; 30% above their basis — modest negotiation headroom, anchor on the comps not their cost.
Questions for the listing agent
- What do current leases actually rent for vs. the listed asking? Can we see a recent rent roll and the last 12 months of T-12 income?
- What does the HOA fee cover, when was the last increase, and are there any pending special assessments or reserve-fund shortfalls?
- Is there a deadline driving the sale (1031 exchange, divorce, estate, relocation)? That informs how much negotiation room exists.
- The area grade is low — what's the realistic commute time and amenity access for the typical tenant pool here? Any planned neighborhood developments (good or bad) we should know about?
- What's the average days-on-market for RENTAL listings here right now (not sales)? A rising rental-DOM trend means longer vacancies and softer asking-rent achievability than the comps imply.
- What's the recent tenant-quality profile in this submarket — average credit score on applications, eviction rate, late-payment / NSF rate, and stable-employment percentage? A property-management company in the area should have these aggregated.
- How much new for-sale + rental construction is in the pipeline within 1–3 miles? Heavy new supply typically softens prices + rents 12–24 months out; constrained supply supports both.
Investment metrics
- 1% rule
- 0.84% ✗
- Cap rate
- 4.23%
- Cash-on-cash
- -7.36%
- DSCR
- 0.67
- GRM
- 10.0
CMA / ARV
- ARV (on-the-fly)
- $270,312
- Comps found
- 9
Show comp detail 9 sales within ~0.75 mi
| Address | Dist | Beds/Ba | Sqft | Sold | Price | $/sf | Match |
|---|---|---|---|---|---|---|---|
| 2706 Kendall Xing | 0.09mi | 3/2.5 | 1,640 (+2%) | 4mo | $275,000 | $168 | 88 |
| 2704 Kendall Xing #2704 | 0.09mi | 3/3.5 | 1,640 (+2%) | 10mo | $300,000 | $183 | 83 |
| 2733 Kendall Xing | 0.13mi | 3/2.5 | 1,609 (0%) | 11mo | $280,000 | $174 | 83 |
| 2805 Payton Xing | 0.21mi | 3/2.5 | 1,696 (+5%) | 10mo | $300,000 | $177 | 71 |
| 2904 Payton Xing | 0.27mi | 3/2.5 | 1,728 (+7%) | 5mo | $275,000 | $159 | 69 |
| 2722 Evergreen Cir | 0.72mi | 3/2.5 | 1,500 (-7%) | 3mo | $270,000 | $180 | 51 |
| 2510 Evergreen Cir | 0.65mi | 2/1.5 (-1) | 1,660 (+3%) | 20mo | $235,000 | $142 | 37 |
| 2636 Evergreen Cir | 0.73mi | 3/2.5 | 1,500 (-7%) | 23mo | $248,000 | $165 | 33 |
| 2624 Evergreen Cir | 0.73mi | 2/1.5 (-1) | 1,742 (+8%) | 11mo | $278,000 | $160 | 32 |
Match score weights: distance 35% · size 25% · config 20% · recency 20%. Top-matched comps best support the ARV.
Projected returns pro-forma
10.0% appreciation · 3.0% rent growth · sell at horizon
- IRR
- 19.1%
- Equity multiple
- 2.56×
- Total profit
- $130,838
- Equity at exit
- $270,174
- IRR
- 17.7%
- Equity multiple
- 5.90×
- Total profit
- $411,677
- Equity at exit
- $582,640
Cash invested: $83,972 (down + closing). Projections, not guarantees.
Landlord ↔ Tenant lean methodology
- Overall (STATE)
- 43 Moderately Tenant-Leaning
- State Illinois
- 43 Moderately Tenant-Leaning · D+7
- County
- — inherits STATE
- City
- — inherits STATE
ZIP-level market 60051
- Home prices YoY
- 4.9%
- Active inventory
- 151
- Price-to-rent
- 10.0×
Monthly cashflow live
- Estimated rent
- $2,508 high interval (Pro) →
- Mortgage (P&I)
- −$1,573
- Tax from tax record
- −$398 /mo · $4,781/yr
- Insurance
- −$125
- HOA
- −$400
- Vacancy / Maint / Mgmt
- −$527
- Net cashflow
- $-515
Break-even live
Sensitivity live
| Price | -10% $-345 | -5% $-430 | +0% $-515 | +5% $-600 | +10% $-685 |
|---|---|---|---|---|---|
| Rent | -10% $-713 | -5% $-614 | +0% $-515 | +5% $-416 | +10% $-317 |
| Rate | -1.0pp $-364 | -0.5pp $-439 | base $-515 | +0.5pp $-593 | +1.0pp $-672 |
UW: 25.0% down · 7.5% · 30yr · 1.5% tax · 5.0% vac · 8.0% maint · 8.0% mgmt
Financing live
Cash to close
- Down payment
- $74,975
- Closing costs
- $8,997
- Reserves months
- —
- Total cash needed
- —
Loan-product check · same deal, 3 products live
Conventional
25% down · 7.5% · 30yr
- Down + closing
- —
- Monthly P&I
- —
- Monthly cashflow
- —
- DSCR
- —
- Eligible?
- —
Personal DTI + credit; lowest rate.
DSCR
20% down · 8.5% · 30yr
- Down + closing
- —
- Monthly P&I
- —
- Monthly cashflow
- —
- DSCR
- —
- Eligible?
- —
No personal income docs; deal must DSCR.
Hard money
10% down · 12.0% · 12mo
- Down + closing
- —
- Monthly P&I
- —
- Monthly cashflow
- —
- DSCR
- —
- Eligible?
- —
Short-term bridge; refi at stabilization.
Rent comps 7 comps
| Address | Beds | Baths | Sqft | Rent | $/sqft | DOM | Units | Dist |
|---|---|---|---|---|---|---|---|---|
| 3415 Blake Rd McHenry, IL | 3.0 | 1.0–2.0 | 926 | $2,338 | $2.52 | 0d | 19 | 0.39mi |
| 2554 Evergreen Cir Unit 2554 McHenry, IL | 3.0 | 2.5 | 1500 | $2,300 | $1.53 | 17d | 1 | 0.70mi |
| 2554 Evergreen Cir Unit 2554 McHenry, IL | 3.0 | 2.5 | 1500 | $2,350 | $1.57 | 0d | 1 | 0.70mi |
| 4218 Parkway Ave McHenry, IL | 4.0 | 1.0 | 1056 | $2,350 | $2.23 | 45d | 1 | 1.16mi |
| 3317 Pearl St McHenry, IL | 3.0 | 2.0 | 1750 | $2,150 | $1.23 | 3d | 1 | 1.32mi |
| 3317 Pearl St Unit NA McHenry, IL | 3.0 | 2.0 | 1750 | $2,095 | $1.20 | 0d | 1 | 1.32mi |
| 3407 Venice Ave Unit 1374787P McHenry, IL | 3.0 | 2.0 | 1991 | $4,970 | $2.50 | 3d | 1 | 1.46mi |
HOA detail
- Monthly dues
- $400 · $4,800/yr
Listing history 9 events
-
2026-06-21days on market $299,900 Active 13 DOM
-
2026-06-18days on market $299,900 Active 10 DOM
-
2026-06-17days on market $299,900 Active 9 DOM
-
2026-06-16days on market $299,900 Active 8 DOM
-
2026-06-15days on market $299,900 Active 7 DOM
-
2026-06-13days on market $299,900 Active 5 DOM
-
2026-06-13days on market $299,900 Active 4 DOM
-
2026-06-09remarks 699-char remark
-
2026-06-09$299,900 Active 1 DOM
ⓘ Source: listings_history table (triggers on properties + properties_extension) + one-shot
backfill from property_details.listing_events for pre-trigger history.
Tax reassessment forecast IL · Partial reset (capped growth)
- Current annual tax
- $4,781 · $398/mo
- Projected year-2 tax
- $5,794 · $483/mo
- Expected delta
- +$1,013/yr (+$84/mo · 21.2%)
ⓘ Screening estimate from a state-policy table — verify with the county assessor before closing.
Climate risk First Street
- Flood 1/10 Low FEMA zone X (unshaded) · 0% chance over 30 yrs
- Wildfire 1/10 Low
- Heat 2/10 Low 7 d/yr ≥100°F today · 14 d/yr by 30 yrs out
- Wind 2/10 Low
- Air quality 2/10 Low 1 unhealthy d/yr today · 1 by 30 yrs out
Nearby sold comps map
Loading sold comps map…
Walkable amenities ~0.75 mi
Loading nearby amenities…
Taxation est. · year 1
- Rental income
- $30,094
- − Mortgage interest
- −$16,799
- − Property taxes
- −$4,781
- − Insurance
- −$1,500
- − Repairs & maintenance
- −$2,408
- − Management
- −$2,408
- − HOA
- −$4,800
- − Depreciation
- −$8,724
- Taxable loss
- −$11,325
- Est. tax savings @ 24.0%
- +$2,718
- After-tax cash flow
- $-3,461/yr
For passive investors: Depreciation is non-cash, so a rental often shows a tax loss while cash-flowing — sheltering income. Rental losses are passive: they offset passive income freely, and up to $25,000/yr can offset ordinary (W-2) income if you actively participate and your MAGI is under $100k (phasing out to $0 by $150k); unused losses carry forward. On sale, claimed depreciation is recaptured at up to 25%, and gains may owe capital-gains tax (a 1031 exchange can defer both). Figures are a year-1 estimate at your 24.0% rate — not tax advice; consult a CPA.
Schools (NCES district)
- District
- Johnsburg CUSD 12
- NCES district ID
- 1720490
- Math proficiency
- 22% ▼ -18.00%
- Reading proficiency
- 21% ▼ -18.00%
- Median HH income
- $79,626
- Composite
- 22.0/100
- National rank
- #8206
- State rank
- #321 of 620 in IL
Livability — Johnsburg
- Score
- 80/100
- State rank
- #111
- US rank
- #1796
Category grades
Schools grade is shown separately in the Schools card above.
Census & demographics
- Census place
- Johnsburg, IL
- Population (ZIP)
- 23,931
Population outlook (McHenry County) Hauer SSP2
- Today (2025)
- 305,342 people
- By 2030
- 301,491 · -1.3%
- By 2040
- 288,211 · -5.6%
- By 2050
- 268,430 · -12.1%
- By 2075
- 226,209 · -25.9%
- By 2100
- 181,247 · -40.6%
Race, ethnicity, and origin ACS 2023
- Neighborhood character
- Predominantly White (84%)
- Race & ethnicity
- White 84% Hispanic / Latino 10% Two or more races 6% Asian 2%
- Hispanic origin (detail)
- Mexican 8%
- Common ancestry
- Romanian 12% Slovak 2% Lithuanian 2%
- Foreign-born
- 5% · Canada
- Languages at home
- 92% English-only · Spanish 5% Other Indo-European 2% Russian/Polish/Slavic 1%
Political lean MEDSL · McHenry
- 2024 margin
- Lean R (+5.3) · D 46.6% · R 51.9% · Other 1.5%
- 2008→2024 swing
- -10.6pp toward R · 2008: 5.3pp · 2024: -5.3pp
- All cycles
- 2024: R+5.3 2020: R+2.5 2016: R+8.1 2012: R+8.8 2008: D+5.3
Not yet ingested
- Civics
- —
Market trends
- HPI YoY
- ▲ 28.50%
- Current HPI
- 612.07
- Rent YoY
- —
- Metro
- —
- State GDP YoY
- ▲ 1.59%
- F500 in state
- 60
Industry mix (Fortune 500 HQ in IL)
| Industry | F500 HQs | Revenue |
|---|---|---|
| Insurance | 4 | $201B |
|
||
| Consumer Goods | 4 | $87B |
|
||
| Industrial Machinery | 3 | $64B |
|
||
| Healthcare | 2 | $55B |
|
||
| Retail / Pharmacy | 1 | $148B |
|
||
| Agriculture / Food | 1 | $86B |
|
||
Price history
+72.5% since first listed20 events — show timeline
- 2026-06-08 Listed $299,900 MRED as Distributed by MLS Grid
- 2022-09-20 Sold (Public Records) $230,000 Public Records
- 2022-09-16 Sold (MLS) $230,000 MRED as Distributed by MLS Grid
- 2022-08-04 Contingent — MRED as Distributed by MLS Grid
- 2022-07-18 Listed $225,000 MRED as Distributed by MLS Grid
- 2020-04-23 Sold (Public Records) $200,400 Public Records
- 2020-03-30 Sold (MLS) $167,000 MRED as Distributed by MLS Grid
- 2020-01-23 Relisted — MRED as Distributed by MLS Grid
- 2020-01-23 Listing Removed — MRED as Distributed by MLS Grid
- 2020-01-22 Relisted — MRED as Distributed by MLS Grid
- 2020-01-22 Contingent — MRED as Distributed by MLS Grid
- 2020-01-22 Relisted — MRED as Distributed by MLS Grid
- 2019-11-07 Contingent — MRED as Distributed by MLS Grid
- 2019-11-01 Price Changed $149,900 MRED as Distributed by MLS Grid
- 2019-10-26 Price Changed $159,900 MRED as Distributed by MLS Grid
- 2019-10-23 Price Changed $164,900 MRED as Distributed by MLS Grid
- 2019-10-20 Price Changed $166,900 MRED as Distributed by MLS Grid
- 2019-10-08 Price Changed $167,900 MRED as Distributed by MLS Grid
- 2019-09-29 Price Changed $169,900 MRED as Distributed by MLS Grid
- 2019-09-11 Listed $173,900 MRED as Distributed by MLS Grid
Property tax history
+4.1%/yrLatest (2024): $4,781 · +2.8% YoY. Source: county tax records.
Cash-flow waterfall
monthlySold comps — $/sqft
last 12 mo · ≤1 miLoading sold comps…