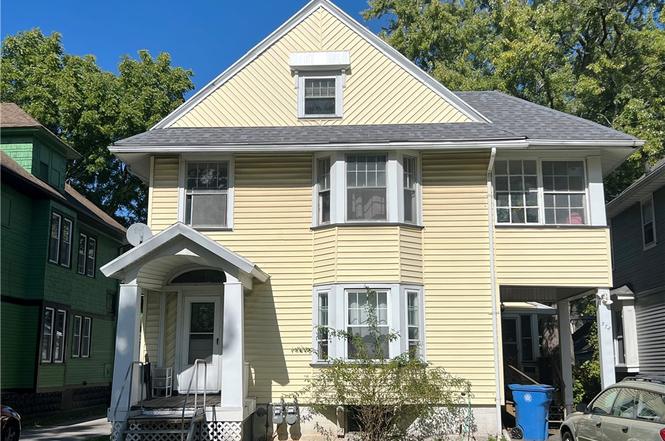
372 Lake View Park St · Rochester, NY
Flood risk 1/10 · Minimal
- FEMA flood zone
- X (unshaded)
- Chance of flooding over 30 yrs
- 0.0%
- Est. flood insurance / yr
- $473 – $860
Fire risk 1/10 · Minimal
- Est. fire insurance / yr
- $691 – $1,283
Heat risk 2/10 · Minimal
- Hot days now (above 96°F)
- 7 days/yr
- Hot days in 30 yrs
- 15 days/yr
Wind risk 1/10 · Minimal
- Chance of severe wind over 30 yrs
- —
Air-quality risk 2/10 · Minimal
- Unhealthy air days now
- 1 days/yr
- Unhealthy air days in 30 yrs
- 2 days/yr
Risk factors via First Street. Map © Google.
Why this score? — see what drove the B- grade
The composite is a weighted blend of 9 inputs, each scored 0–100. Each bar is that input's sub-score; the figure is the points it added to the 100-point composite (weight × sub-score).
- Cash flow +26.8/30.0
- ARV discount +12.4/15.0
- DSCR +9.2/10.0
- 1% rule +7.2/10.0
- Livability +3.8/5.0
- Rent growth +2.5/5.0
- Condition / age +2.5/5.0
- Appreciation +2.2/10.0
- Schools +1.9/10.0
$124,900
🖨 Deal sheet 📄 Offer letter ✓ Due diligence
Listing remarks MLS
Duplex on Lake View Park which is a very spacious (former race track) street with lots of beautiful homes. Priced $10,000 below assessed value for quick sale. New CofO to be provided. Off street parking.
Key facts
- Strong cash flow
- Separate utilities
- Tree-lined streets
Tags
Neighborhood map
What this means for you Summary
Snapshot
- This is a 4-bed/2.0-bath townhouse listed at $125k.
Deal economics
- At list price, monthly cash flow is $343 ($4k/yr) — positive.
- The deal already cash-flows at list — no discount required.
- Meets the 1% rule at list price ($2k rent vs $125k).
- Recommended offer: $117k (6.0% below list) — sets the bar for market timing.
Location & tenants
- Location reads 76/100 on livability (#222 in NY, #3,482 nationally) — a middle-class / working-renter tenant base. Strengths: commute A+, cost of living A+, housing A+; Watch: schools D+, crime F, employment F.
- Rochester City School District (urban): math 21% / reading 26% proficiency, ranked #589 of 590 in NY (top 100%) — low school quality limits family demand, transient renter base, plan for 1-2y turnover; 82% free/reduced lunch — lower-income household profile, screen leases tightly.
- Market conditions: 71 active listings in the ZIP; 4 comparable units currently listed for rent nearby; rentals lingering (median 44d on market — plan ~5-8 weeks vacancy on turnover, expect pricing pressure); 50% of comp listings sitting > 30 days — soft ceiling on asking rent; 1,169 units permitted in Monroe County in 2024 (591 in 5+ unit buildings).
Forward outlook
- Local home prices are declining (-3.0%/yr); year-one equity from $864 of loan paydown is wiped out by about $4k of value loss. Plan a longer hold.
- Monroe County population projected to shrink 6% by 2050 — rents likely to lag national; underwrite the cash flow, not the appreciation.
- At projected returns (-3.0% appreciation + 3.0% rent growth), your $35k cash investment doubles in ~10 years — after that, you're playing with house money.
Negotiation context
- It's been on market 70 days — a 6% lower offer ($117k) is reasonable based on typical stale-listing flexibility.
- 3 sale attempts since 12y ago with the ask held roughly flat each time — persistent listings suggest the price (not the market) is what's stuck; bring a comps-based counter.
- Current owner paid $58k; list at $125k implies a 117% gain — meaningful room to come down on a strong offer.
Risks & watch-outs
- Watch-outs: built in 1910 — expect roof / HVAC / electrical / plumbing capex.
Questions for the listing agent
- It's been on market 70 days. Have you received any prior offers? Is the seller open to a 6% concession, seller financing, or rate buy-down credit?
- Built in 1910 — when were the roof, HVAC, electrical panel, plumbing, and water heater last replaced?
- Why hasn't it sold? Are there any deal-killer items the seller is aware of (foundation, flood, title, zoning, code violations)?
- Is there a deadline driving the sale (1031 exchange, divorce, estate, relocation)? That informs how much negotiation room exists.
- Schools are D-rated, which usually means shorter tenancies and higher turnover. Who's the typical renter profile here, and what's been the actual vacancy rate?
- Crime grade is F in this area — have there been break-ins, vandalism, or insurance claims at this property in the last 3 years? What carrier currently insures it and at what premium?
- What's the average days-on-market for RENTAL listings here right now (not sales)? A rising rental-DOM trend means longer vacancies and softer asking-rent achievability than the comps imply.
- What's the recent tenant-quality profile in this submarket — average credit score on applications, eviction rate, late-payment / NSF rate, and stable-employment percentage? A property-management company in the area should have these aggregated.
- How much new for-sale + rental construction is in the pipeline within 1–3 miles? Heavy new supply typically softens prices + rents 12–24 months out; constrained supply supports both.
Investment metrics
- 1% rule
- 1.22% ✓
- Cap rate
- 9.59%
- Cash-on-cash
- 11.78%
- DSCR
- 1.52
- GRM
- 6.8
CMA / ARV
- ARV (on-the-fly)
- $140,336
- Comps found
- 11
Show comp detail 11 sales within ~0.75 mi
| Address | Dist | Beds/Ba | Sqft | Sold | Price | $/sf | Match |
|---|---|---|---|---|---|---|---|
| 372 Lake View Park St | 0.00mi | 4/2.0 | 2,506 (0%) | 0mo | $155,000 | $62 | 100 |
| 366 Augustine St | 0.25mi | 5/2.0 (+1) | 2,521 (+1%) | 8mo | $175,000 | $69 | 76 |
| 222-224 Selye Ter | 0.22mi | 5/2.0 (+1) | 2,496 (-0%) | 13mo | $127,500 | $51 | 73 |
| 518 Augustine St | 0.29mi | 4/2.0 | 2,340 (-7%) | 5mo | $175,000 | $75 | 71 |
| 47 Tacoma St | 0.49mi | 4/2.0 | 2,345 (-6%) | 4mo | $140,000 | $60 | 63 |
| 453 Clay Ave | 0.60mi | 4/2.0 | 2,574 (+3%) | 16mo | $145,000 | $56 | 54 |
| 286-288 Clay Ave | 0.66mi | 4/2.0 | 2,270 (-9%) | 1mo | $125,000 | $55 | 52 |
| 192-194 Magee Ave | 0.62mi | 5/3.0 (+1) | 2,582 (+3%) | 6mo | $170,000 | $66 | 52 |
| 901 Lake Ave | 0.52mi | 5/3.0 (+1) | 2,624 (+5%) | 15mo | $108,000 | $41 | 47 |
| 53 Locust St | 0.70mi | 5/3.0 (+1) | 2,376 (-5%) | 9mo | $63,000 | $27 | 43 |
| 206 Fulton Ave | 0.72mi | 4/2.0 | 2,283 (-9%) | 24mo | $100,000 | $44 | 32 |
Match score weights: distance 35% · size 25% · config 20% · recency 20%. Top-matched comps best support the ARV.
Projected returns pro-forma
-3.0% appreciation · 3.0% rent growth · sell at horizon
- IRR
- 1.2%
- Equity multiple
- 1.05×
- Total profit
- $1,652
- Equity at exit
- $18,623
- IRR
- 10.9%
- Equity multiple
- 1.85×
- Total profit
- $29,691
- Equity at exit
- $10,799
Cash invested: $34,972 (down + closing). Projections, not guarantees.
Landlord ↔ Tenant lean methodology
- Overall (STATE)
- 15 Strongly Tenant-Friendly
- State New York
- 15 Strongly Tenant-Friendly · D+10
- County
- — inherits STATE
- City
- — inherits STATE
ZIP-level market 14613
- Home prices YoY
- -2.0%
- Active inventory
- 71
- Price-to-rent
- 6.8×
Monthly cashflow live
- Estimated rent
- $1,527 medium interval (Pro) →
- Mortgage (P&I)
- −$655
- Tax est. 1.5%
- −$156 /mo · $1,874/yr
- Insurance
- −$52
- HOA
- −$0
- Vacancy / Maint / Mgmt
- −$321
- Net cashflow
- $343
Break-even live
UW: 25.0% down · 7.5% · 30yr · 1.5% tax · 5.0% vac · 8.0% maint · 8.0% mgmt
Financing live
Cash to close
- Down payment
- $31,225
- Closing costs
- $3,747
- Reserves months
- —
- Total cash needed
- —
Loan-product check · same deal, 3 products live
Conventional
25% down · 7.5% · 30yr
- Down + closing
- —
- Monthly P&I
- —
- Monthly cashflow
- —
- DSCR
- —
- Eligible?
- —
Personal DTI + credit; lowest rate.
DSCR
20% down · 8.5% · 30yr
- Down + closing
- —
- Monthly P&I
- —
- Monthly cashflow
- —
- DSCR
- —
- Eligible?
- —
No personal income docs; deal must DSCR.
Hard money
10% down · 12.0% · 12mo
- Down + closing
- —
- Monthly P&I
- —
- Monthly cashflow
- —
- DSCR
- —
- Eligible?
- —
Short-term bridge; refi at stabilization.
Rent comps 4 comps
| Address | Beds | Baths | Sqft | Rent | $/sqft | DOM | Units | Dist |
|---|---|---|---|---|---|---|---|---|
| 98 Pierpont St Rochester, NY | 3.0 | 1.0 | 1973 | $1,295 | $0.66 | 43d | 1 | 0.29mi |
| 327 Glenwood Ave Rochester, NY | 3.0 | 1.0 | 2012 | $1,690 | $0.84 | 2d | 1 | 0.48mi |
| 768 Flower City Park Rochester, NY | 3.0 | 1.0 | 1995 | $1,995 | $1.00 | 10d | 1 | 0.72mi |
| 235 Flower City Park Rochester, NY | 3.0 | 1.0 | 2000 | $1,360 | $0.68 | 43d | 1 | 0.85mi |
Listing history 7 events
-
2026-01-15status Pending
-
2025-12-04historical Active Under Contract
-
2025-11-06$124,900 Active
-
2025-11-06historical
-
2025-10-10$149,900 Active
-
2014-07-01soldstatus $57,500 203-char remark
Show marketing remark (203 chars)
Duplex on Lake View Park which is a very spacious (former race track) street with lots of beautiful homes. Priced $10,000 below assessed value for quick sale. New CofO to be provided. Off street parking.
-
2014-04-23$59,900 203-char remark
Show marketing remark (203 chars)
Duplex on Lake View Park which is a very spacious (former race track) street with lots of beautiful homes. Priced $10,000 below assessed value for quick sale. New CofO to be provided. Off street parking.
ⓘ Source: listings_history table (triggers on properties + properties_extension) + one-shot
backfill from property_details.listing_events for pre-trigger history.
Climate risk First Street
- Flood 1/10 Low FEMA zone X (unshaded) · 0% chance over 30 yrs
- Wildfire 1/10 Low
- Heat 2/10 Low 7 d/yr ≥96°F today · 15 d/yr by 30 yrs out
- Wind 1/10 Low
- Air quality 2/10 Low 1 unhealthy d/yr today · 2 by 30 yrs out
Nearby sold comps map
Loading sold comps map…
Walkable amenities ~0.75 mi
Loading nearby amenities…
Taxation est. · year 1
- Rental income
- $18,327
- − Mortgage interest
- −$6,996
- − Property taxes
- −$1,874
- − Insurance
- −$624
- − Repairs & maintenance
- −$1,466
- − Management
- −$1,466
- − Depreciation
- −$3,633
- Taxable income
- $2,267
- Est. tax owed @ 24.0%
- −$544
- After-tax cash flow
- $3,576/yr
For passive investors: Depreciation is non-cash, so a rental often shows a tax loss while cash-flowing — sheltering income. Rental losses are passive: they offset passive income freely, and up to $25,000/yr can offset ordinary (W-2) income if you actively participate and your MAGI is under $100k (phasing out to $0 by $150k); unused losses carry forward. On sale, claimed depreciation is recaptured at up to 25%, and gains may owe capital-gains tax (a 1031 exchange can defer both). Figures are a year-1 estimate at your 24.0% rate — not tax advice; consult a CPA.
Schools (NCES district)
- District
- Rochester City School District
- NCES district ID
- 3624750
- Math proficiency
- 21% ▬ 0.00%
- Reading proficiency
- 26% ▲ 4.00%
- Median HH income
- $30,923
- Composite
- 18.98/100
- National rank
- #8850
- State rank
- #589 of 590 in NY
Livability — Rochester
- Score
- 76/100
- State rank
- #222
- US rank
- #3482
Category grades
Schools grade is shown separately in the Schools card above.
Census & demographics
- Census place
- Rochester, NY
- City population
- 432,803
- Population (ZIP)
- 14,740
Population outlook (Monroe County) Hauer SSP2
- Today (2025)
- 759,460 people
- By 2030
- 757,154 · -0.3%
- By 2040
- 740,644 · -2.5%
- By 2050
- 714,443 · -5.9%
- By 2075
- 645,883 · -15.0%
- By 2100
- 547,084 · -28.0%
Race, ethnicity, and origin ACS 2023
- Neighborhood character
- Highly diverse neighborhood (Simpson 0.70)
- Race & ethnicity
- Black 45% White 22% Hispanic / Latino 20% Two or more races 10% Asian 8% Pacific Islander 1%
- Hispanic origin (detail)
- Puerto Rican 16% Dominican 3%
- Common ancestry
- British 2% Serbian 1% Romanian 1%
- Foreign-born
- 13% · Canada, India, Philippines
- Languages at home
- 79% English-only · Spanish 12% Other Asian/Pacific 5% Other Indo-European 3%
Political lean MEDSL · Monroe
- 2024 margin
- D (+19.1) · D 59.5% · R 40.5%
- 2008→2024 swing
- +1.4pp toward D · 2008: 17.7pp · 2024: 19.1pp
- All cycles
- 2024: D+19.1 2020: D+21.0 2016: D+14.1 2012: D+17.4 2008: D+17.7
Not yet ingested
- Civics
- —
Market trends
- HPI YoY
- ▼ -5.56%
- Current HPI
- 274.2485
- Rent YoY
- —
- Metro
- —
- State GDP YoY
- ▲ 2.60%
- F500 in state
- 92
Industry mix (Fortune 500 HQ in NY)
| Industry | F500 HQs | Revenue |
|---|---|---|
| Financial Services | 10 | $950B |
|
||
| Consumer Goods | 9 | $162B |
|
||
| Insurance | 4 | $225B |
|
||
| Telecommunications | 2 | $144B |
|
||
| Pharmaceuticals | 2 | $112B |
|
||
| Media / Entertainment | 2 | $69B |
|
||
Price history
+108.5% since first listed7 events — show timeline
- 2026-01-15 Pending — UNYREIS
- 2025-12-04 Contingent — UNYREIS
- 2025-11-06 Listing Removed — UNYREIS
- 2025-11-06 Listed $124,900 UNYREIS
- 2025-10-10 Listed $149,900 UNYREIS
- 2014-07-01 Sold (MLS) $57,500 UNYREIS
- 2014-04-23 Listed $59,900 UNYREIS
Cash-flow waterfall
monthlySold comps — $/sqft
last 12 mo · ≤1 miLoading sold comps…