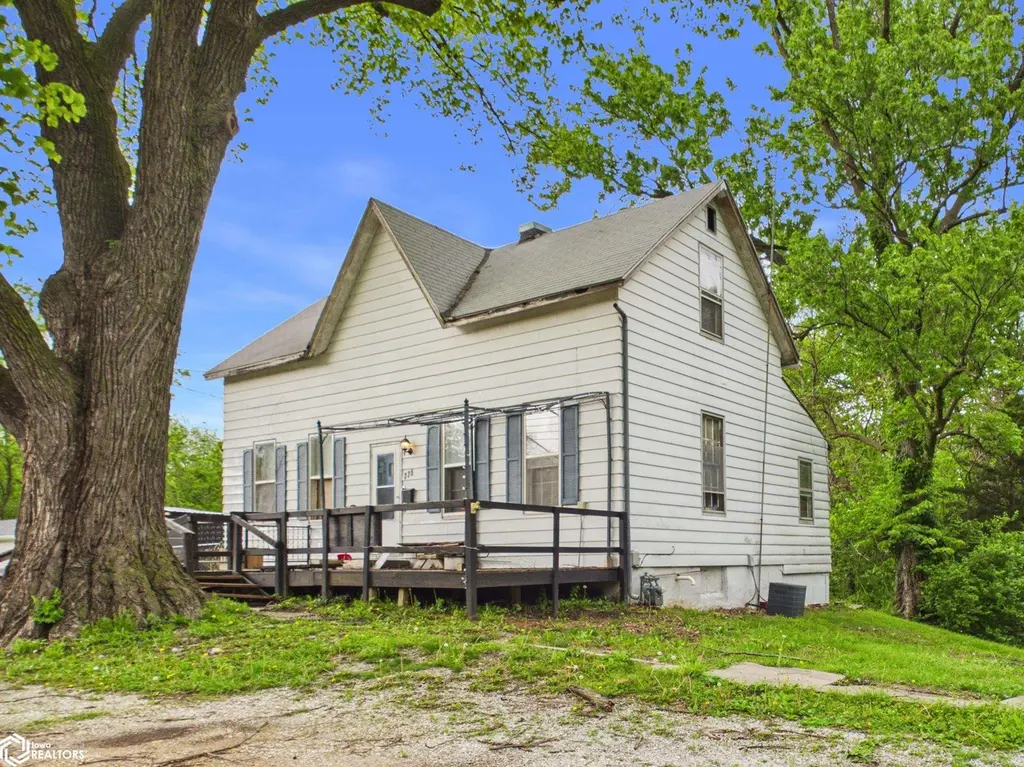
325 Marion St · Warsaw, IL
Flood risk 5/10 · Moderate
- FEMA flood zone
- X (unshaded)
- Chance of flooding over 30 yrs
- 0.65%
- Est. flood insurance / yr
- $507 – $1,088
Fire risk 1/10 · Minimal
- Est. fire insurance / yr
- $804 – $1,492
Heat risk 3/10 · Minor
- Hot days now (above 106°F)
- 7 days/yr
- Hot days in 30 yrs
- 16 days/yr
Wind risk 2/10 · Minimal
- Chance of severe wind over 30 yrs
- 0.0%
Air-quality risk 2/10 · Minimal
- Unhealthy air days now
- 0 days/yr
- Unhealthy air days in 30 yrs
- 1 days/yr
Risk factors via First Street. Map © Google.
Why this score? — see what drove the B+ grade
The composite is a weighted blend of 9 inputs, each scored 0–100. Each bar is that input's sub-score; the figure is the points it added to the 100-point composite (weight × sub-score).
- Cash flow +30.0/30.0
- 1% rule +10.0/10.0
- DSCR +10.0/10.0
- Appreciation +9.0/10.0
- ARV discount +7.5/15.0
- Livability +3.4/5.0
- Schools +2.9/10.0
- Rent growth +2.5/5.0
- Condition / age +2.5/5.0
$32,000
🖨 Deal sheet 📄 Offer letter ✓ Due diligence
Listing remarks
Quaint 2-bedroom, 1-bath fixer-upper situated on a generous 0.60-acre lot in the heart of Warsaw, IL! This property is full of potential and perfect for investors, flippers, or buyers ready to bring their vision to life. A brand-new furnace has already been installed, offering a strong head start on your renovations. The spacious lot provides ample room for gardening, outdoor entertaining, or even future expansion, while the added storage shed offers convenient space for tools and equipment. Although located in town, the surrounding timber gives this property a peaceful, tucked-away feel—like you’re on the outskirts of town with added privacy and natural beauty. Nestled in a qui
Key facts
- 0.60-acre lot
- Added storage shed
- Brand-new furnace
Tags
Property features AI
Finance
- Financial info: Annual tax noted
Exterior
- Parking: Outdoor gravel parking
- Utilities: Public water; Public sewer
- Home design: Single-family residence; One-and-one-half story
- Construction: Vinyl siding construction
- Exterior features: Shingle roof; Vinyl siding; Lot approximately 0.6 acres (180 x 144)
Interior
- Bathrooms: 1 full bathroom
- Interior features: Basement present; Central air conditioning; Forced air heating
Neighborhood map
What this means for you Summary
Snapshot
- This is a 2-bed/1.0-bath single-family listed at $32k.
Deal economics
- At list price, monthly cash flow is $581 ($7k/yr) — positive.
- The deal already cash-flows at list — no discount required.
- Meets the 1% rule at list price ($1k rent vs $32k).
- Recommended offer: $31k (3.0% below list) — sets the bar for market timing.
Location & tenants
- Location reads 68/100 on livability (#459 in IL) — a middle-class / working-renter tenant base. Strengths: crime A+, cost of living A+, housing A+; Watch: health & safety C-, schools D, employment D.
- Warsaw CUSD 316 (rural): math 25% / reading 35% proficiency, ranked #489 of 919 in IL (top 53%) — families likely to look elsewhere, expect single-tenant / working-renter base with shorter leases.
- Market conditions: 20 active listings in the ZIP.
Forward outlook
- In year one you build about $3k of equity ($221 loan paydown + $3k appreciation (8.0% local appreciation)).
- Hancock County population projected at -30% by 2050 — secular population decline; favor cash flow + early exit over multi-decade hold.
- At projected returns (8.0% appreciation + 3.0% rent growth), your $9k cash investment doubles in ~1 year — after that, you're playing with house money.
- By year 10, paydown + projected appreciation supports a ~$31k cash-out refi (75% LTV) — recoverable capital for the next deal without selling this one.
Negotiation context
- It's been on market 51 days — a 3% lower offer ($31k) is reasonable based on typical stale-listing flexibility.
Risks & watch-outs
- Watch-outs: built in 1890 — expect roof / HVAC / electrical / plumbing capex.
- Climate carrying-cost: moderate flood risk — expect insurance premiums to compound above CPI over the hold.
Questions for the listing agent
- It's been on market 51 days. Have you received any prior offers? Is the seller open to a 3% concession, seller financing, or rate buy-down credit?
- Built in 1890 — when were the roof, HVAC, electrical panel, plumbing, and water heater last replaced?
- Is there a deadline driving the sale (1031 exchange, divorce, estate, relocation)? That informs how much negotiation room exists.
- Schools are D-rated, which usually means shorter tenancies and higher turnover. Who's the typical renter profile here, and what's been the actual vacancy rate?
- What's the average days-on-market for RENTAL listings here right now (not sales)? A rising rental-DOM trend means longer vacancies and softer asking-rent achievability than the comps imply.
- What's the recent tenant-quality profile in this submarket — average credit score on applications, eviction rate, late-payment / NSF rate, and stable-employment percentage? A property-management company in the area should have these aggregated.
- How much new for-sale + rental construction is in the pipeline within 1–3 miles? Heavy new supply typically softens prices + rents 12–24 months out; constrained supply supports both.
Investment metrics
- 1% rule
- 3.18% ✓
- Cap rate
- 28.08%
- Cash-on-cash
- 77.81%
- DSCR
- 4.46
- GRM
- 2.6
CMA / ARV
- ARV (median comp)
- $79,738
- List price
- $32,000
- Delta
- -59.87%
- Verdict
- UNDERPRICED
- Comps
- 20 within 1.0 mi
Show comp detail 8 sales within ~0.75 mi
| Address | Dist | Beds/Ba | Sqft | Sold | Price | $/sf | Match |
|---|---|---|---|---|---|---|---|
| 515 Clay St | 0.39mi | 3/1.5 (+1) | 1,170 (-0%) | 5mo | $130,000 | $111 | 70 |
| 330 Cedar St | 0.09mi | 2/2.0 | 1,044 (-11%) | 6mo | $36,000 | $34 | 68 |
| 859 Mulberry St | 0.28mi | 3/1.0 (+1) | 1,208 (+3%) | 12mo | $79,500 | $66 | 68 |
| 615 Webster | 0.29mi | 3/1.0 (+1) | 1,272 (+8%) | 3mo | $20,000 | $16 | 65 |
| 945 Webster St | 0.49mi | 2/2.0 | 1,152 (-2%) | 11mo | $118,000 | $102 | 61 |
| 725 Bunker Dr | 0.29mi | 3/1.0 (+1) | 1,008 (-14%) | 5mo | $105,000 | $104 | 54 |
| 415 Leclaire | 0.22mi | 3/1.0 (+1) | 1,324 (+13%) | 18mo | $95,000 | $72 | 49 |
| 415 Illinois St | 0.38mi | 3/1.0 (+1) | 1,008 (-14%) | 11mo | $101,000 | $100 | 44 |
Match score weights: distance 35% · size 25% · config 20% · recency 20%. Top-matched comps best support the ARV.
Projected returns pro-forma
7.99% appreciation · 3.0% rent growth · sell at horizon
- IRR
- 86.3%
- Equity multiple
- 6.60×
- Total profit
- $50,181
- Equity at exit
- $24,292
- IRR
- 82.4%
- Equity multiple
- 14.18×
- Total profit
- $118,137
- Equity at exit
- $48,201
Cash invested: $8,960 (down + closing). Projections, not guarantees.
Landlord ↔ Tenant lean methodology
- Overall (STATE)
- 43 Moderately Tenant-Leaning
- State Illinois
- 43 Moderately Tenant-Leaning · D+7
- County
- — inherits STATE
- City
- — inherits STATE
ZIP-level market 62379
- Home prices YoY
- 5.6%
- Active inventory
- 20
- Price-to-rent
- 2.6×
Monthly cashflow live
- Estimated rent
- $1,017 medium interval (Pro) →
- Mortgage (P&I)
- −$168
- Tax from tax record
- −$41 /mo · $497/yr
- Insurance
- −$13
- HOA
- −$0
- Vacancy / Maint / Mgmt
- −$214
- Net cashflow
- $581
Break-even live
UW: 25.0% down · 7.5% · 30yr · 1.5% tax · 5.0% vac · 8.0% maint · 8.0% mgmt
Financing live
Cash to close
- Down payment
- $8,000
- Closing costs
- $960
- Reserves months
- —
- Total cash needed
- —
Loan-product check · same deal, 3 products live
Conventional
25% down · 7.5% · 30yr
- Down + closing
- —
- Monthly P&I
- —
- Monthly cashflow
- —
- DSCR
- —
- Eligible?
- —
Personal DTI + credit; lowest rate.
DSCR
20% down · 8.5% · 30yr
- Down + closing
- —
- Monthly P&I
- —
- Monthly cashflow
- —
- DSCR
- —
- Eligible?
- —
No personal income docs; deal must DSCR.
Hard money
10% down · 12.0% · 12mo
- Down + closing
- —
- Monthly P&I
- —
- Monthly cashflow
- —
- DSCR
- —
- Eligible?
- —
Short-term bridge; refi at stabilization.
Listing history 15 events
-
2026-06-18days on market $32,000 Active 51 DOM
-
2026-06-17days on market $32,000 Active 50 DOM
-
2026-06-16days on market $32,000 Active 49 DOM
-
2026-06-15days on market $32,000 Active 48 DOM
-
2026-06-13days on market $32,000 Active 46 DOM
-
2026-06-12days on market $32,000 Active 45 DOM
-
2026-06-09days on market $32,000 Active 42 DOM
-
2026-06-08days on market $32,000 Active 41 DOM
-
2026-06-07days on market $32,000 Active 40 DOM
-
2026-06-04days on market $32,000 Active 36 DOM
-
2026-06-02days on market $32,000 Active 35 DOM
-
2026-06-01days on market $32,000 Active 34 DOM
-
2026-05-31days on market $32,000 Active 33 DOM
-
2026-05-31pricedays on market $32,000 Active 32 DOM
-
2026-04-28$35,000 Active 986-char remark
ⓘ Source: listings_history table (triggers on properties + properties_extension) + one-shot
backfill from property_details.listing_events for pre-trigger history.
Tax reassessment forecast IL · Partial reset (capped growth)
- Current annual tax
- $497 · $41/mo
- Projected year-2 tax
- $612 · $51/mo
- Expected delta
- +$115/yr (+$10/mo · 23.0%)
ⓘ Screening estimate from a state-policy table — verify with the county assessor before closing.
Climate risk First Street
- Flood 5/10 Major FEMA zone X (unshaded) · 65% chance over 30 yrs
- Wildfire 1/10 Low
- Heat 3/10 Moderate 7 d/yr ≥106°F today · 16 d/yr by 30 yrs out
- Wind 2/10 Low 0% chance of damaging wind over 30 yrs
- Air quality 2/10 Low 0 unhealthy d/yr today · 1 by 30 yrs out
Nearby sold comps map
Loading sold comps map…
Walkable amenities ~0.75 mi
Loading nearby amenities…
Taxation est. · year 1
- Rental income
- $12,206
- − Mortgage interest
- −$1,792
- − Property taxes
- −$497
- − Insurance
- −$160
- − Repairs & maintenance
- −$976
- − Management
- −$976
- − Depreciation
- −$931
- Taxable income
- $6,872
- Est. tax owed @ 24.0%
- −$1,649
- After-tax cash flow
- $5,322/yr
For passive investors: Depreciation is non-cash, so a rental often shows a tax loss while cash-flowing — sheltering income. Rental losses are passive: they offset passive income freely, and up to $25,000/yr can offset ordinary (W-2) income if you actively participate and your MAGI is under $100k (phasing out to $0 by $150k); unused losses carry forward. On sale, claimed depreciation is recaptured at up to 25%, and gains may owe capital-gains tax (a 1031 exchange can defer both). Figures are a year-1 estimate at your 24.0% rate — not tax advice; consult a CPA.
Schools (NCES district)
- District
- Warsaw CUSD 316
- NCES district ID
- 1740890
- Math proficiency
- 25% ▲ 5.00%
- Reading proficiency
- 35% ▬ 0.00%
- Median HH income
- $48,724
- Composite
- 28.9/100
- National rank
- #11950
- State rank
- #489 of 919 in IL
Livability — Warsaw
- Score
- 68/100
- State rank
- #459
- US rank
- #9523
Category grades
Schools grade is shown separately in the Schools card above.
Census & demographics
- Census place
- Warsaw, IL
- Population (ZIP)
- 1,828
Population outlook (Hancock County) Hauer SSP2
- Today (2025)
- 17,042 people
- By 2030
- 16,056 · -5.8%
- By 2040
- 13,912 · -18.4%
- By 2050
- 11,879 · -30.3%
- By 2075
- 8,302 · -51.3%
- By 2100
- 5,846 · -65.7%
Race, ethnicity, and origin ACS 2023
- Neighborhood character
- Predominantly White (97%)
- Race & ethnicity
- White 97% Two or more races 2%
- Common ancestry
- Slovak 5% Lithuanian 2% Iranian 1%
- Foreign-born
- 1%
- Languages at home
- 98% English-only · Other Indo-European 2%
Political lean MEDSL · Hancock
- 2024 margin
- Solid R (+50.0) · D 24.1% · R 74.1% · Other 1.8%
- 2008→2024 swing
- -39.2pp toward R · 2008: -10.8pp · 2024: -50.0pp
- All cycles
- 2024: R+50.0 2020: R+48.9 2016: R+50.8 2012: R+19.0 2008: R+10.8
Not yet ingested
- Civics
- —
Market trends
- HPI YoY
- ▲ 7.99%
- Current HPI
- 150.9375
- Rent YoY
- —
- Metro
- —
- State GDP YoY
- ▲ 1.59%
- F500 in state
- 60
Industry mix (Fortune 500 HQ in IL)
| Industry | F500 HQs | Revenue |
|---|---|---|
| Insurance | 4 | $201B |
|
||
| Consumer Goods | 4 | $87B |
|
||
| Industrial Machinery | 3 | $64B |
|
||
| Healthcare | 2 | $55B |
|
||
| Retail / Pharmacy | 1 | $148B |
|
||
| Agriculture / Food | 1 | $86B |
|
||
Price history
-8.6% since first listed2 events — show timeline
- 2026-05-30 Price Changed $32,000 IAR
- 2026-04-28 Listed $35,000 IAR
Property tax history
+6.1%/yrLatest (2024): $497 · +7.0% YoY. Source: county tax records.
Cash-flow waterfall
monthlySold comps — $/sqft
last 12 mo · ≤1 miLoading sold comps…