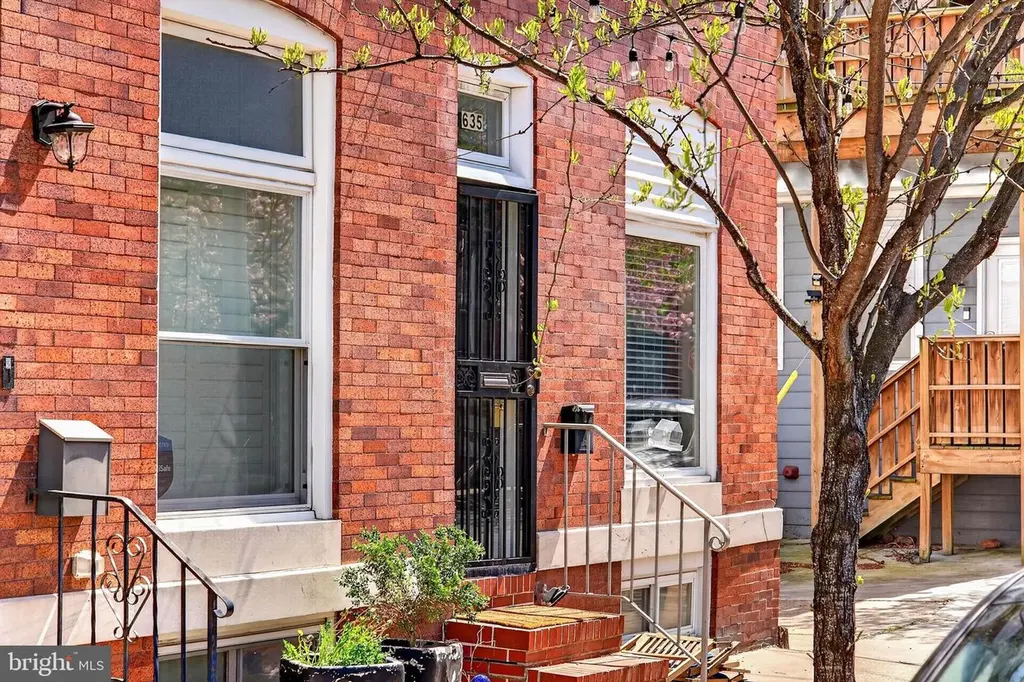
635 S Eaton St · Baltimore, MD
Flood risk 1/10 · Minimal
- FEMA flood zone
- X (unshaded)
- Chance of flooding over 30 yrs
- 0.0%
- Est. flood insurance / yr
- $473 – $860
Fire risk 1/10 · Minimal
- Est. fire insurance / yr
- $755 – $1,403
Heat risk 8/10 · Major
- Hot days now (above 103°F)
- 7 days/yr
- Hot days in 30 yrs
- 15 days/yr
Wind risk 6/10 · Moderate
- Chance of severe wind over 30 yrs
- 27.0%
Air-quality risk 4/10 · Minor
- Unhealthy air days now
- 6 days/yr
- Unhealthy air days in 30 yrs
- 7 days/yr
Risk factors via First Street. Map © Google.
Why this score? — see what drove the C+ grade
The composite is a weighted blend of 9 inputs, each scored 0–100. Each bar is that input's sub-score; the figure is the points it added to the 100-point composite (weight × sub-score).
- Cash flow +23.3/30.0
- ARV discount +15.0/15.0
- DSCR +7.5/10.0
- 1% rule +7.3/10.0
- Livability +3.8/5.0
- Rent growth +2.8/5.0
- Condition / age +2.5/5.0
- Schools +1.0/10.0
- Appreciation +0.0/10.0
$199,000
🖨 Deal sheet 📄 Offer letter ✓ Due diligence
Listing remarks
OFFER WILL BE REVIEWED 5-29-26 AT 4 PM ESSENCE Live authentically. A timeless Baltimore brick rowhouse. Two residences, one building. Each floor has one bedroom and one bathroom. The main floor flows naturally from room to room, bright and warm throughout. The kitchen is made for cooking with company. The bedroom is quiet, spacious, and yours. Upstairs, a private entrance opens to a sun-filled apartment — self-contained, peaceful, and removed from the street below. Live in one, lease the other. Cultivate your existence. The art of uniting human and home. LOCAL FLAVOR AND PROVISIONS Canton offers a vibrant waterfront experience and historic charm centered around O’Donnell Square
Key facts
- Built 1920
- Listed 8 days
Property features AI
Exterior
- Parking: On-street parking
- Utilities: Public water; Public sewer; Natural gas hot water; Natural gas heating; Electric for cooling
- Home design: Fee simple ownership; Above-grade finished area per assessor; Below-grade unfinished area
- Construction: Brick and vinyl siding construction; Other foundation type; Other above- and below-grade structures
- Exterior features: End-of-row townhouse; No tidal water
Interior
- Bedrooms: One bedroom on the main level; One bedroom on the first upper level
- Bathrooms: One full bathroom on the main level; One full bathroom on the first upper level (two full bathrooms total)
- Heating & cooling: Forced air heating; Central air conditioning
- Interior features: Unfinished basement; Living area per assessor
Neighborhood map
What this means for you Summary
Snapshot
- This is a 2-bed/1.0-bath townhouse listed at $199k.
Deal economics
- At list price, monthly cash flow is $364 ($4k/yr) — positive.
- The deal already cash-flows at list — no discount required.
- Meets the 1% rule at list price ($2k rent vs $199k).
- Cap rate 8.5% vs local median 6.0% in Baltimore — top-decile yield for the area; either an underpriced asset or a hidden risk that comps aren't pricing in. Stress-test before assuming the spread holds.
Location & tenants
- Location reads 76/100 on livability (#90 in MD, #3,396 nationally) — a middle-class / working-renter tenant base. Strengths: amenities A+, commute A+, housing A+; Watch: schools D, crime F.
- Baltimore City Public Schools (urban): math 7% / reading 16% proficiency, ranked #24 of 24 in MD (top 100%) — low school quality limits family demand, transient renter base, plan for 1-2y turnover; 79% free/reduced lunch — lower-income household profile, screen leases tightly.
- Market conditions: Rents rising (+1.3%/yr); 391 active listings in the ZIP; 40 comparable units currently listed for rent nearby; rentals at typical pace (median 24d on market — plan ~3-4 weeks tenant-placement turnaround); solid renter incomes; 1,273 units permitted in Baltimore city in 2024 (1,104 in 5+ unit buildings).
- This rent runs 33% of the median local income ($89k/yr) — at the standard rent-burdened threshold; future hikes will face affordability resistance.
Forward outlook
- Local home prices are declining (-3.0%/yr); year-one equity from $1k of loan paydown is wiped out by about $6k of value loss. Plan a longer hold.
- Baltimore County population projected to shrink 4% by 2050 — rents likely to lag national; underwrite the cash flow, not the appreciation.
Negotiation context
- Only 8 days on market — expect competitive offers; lowballing is unlikely to land.
Risks & watch-outs
- Watch-outs: property tax is 2.7% of price; built in 1920 — expect roof / HVAC / electrical / plumbing capex.
- Climate carrying-cost: major wind risk, 27% chance of damaging wind over 30y; extreme-heat days projected 7→15/yr by 2055 (HVAC capex compounding) — expect insurance premiums to compound above CPI over the hold.
Questions for the listing agent
- Built in 1920 — when were the roof, HVAC, electrical panel, plumbing, and water heater last replaced?
- Property tax is high relative to price — has the assessment been appealed recently, and will the sale trigger a re-assessment?
- Is there a deadline driving the sale (1031 exchange, divorce, estate, relocation)? That informs how much negotiation room exists.
- Schools are D-rated, which usually means shorter tenancies and higher turnover. Who's the typical renter profile here, and what's been the actual vacancy rate?
- Crime grade is F in this area — have there been break-ins, vandalism, or insurance claims at this property in the last 3 years? What carrier currently insures it and at what premium?
- What's the average days-on-market for RENTAL listings here right now (not sales)? A rising rental-DOM trend means longer vacancies and softer asking-rent achievability than the comps imply.
- What's the recent tenant-quality profile in this submarket — average credit score on applications, eviction rate, late-payment / NSF rate, and stable-employment percentage? A property-management company in the area should have these aggregated.
- How much new for-sale + rental construction is in the pipeline within 1–3 miles? Heavy new supply typically softens prices + rents 12–24 months out; constrained supply supports both.
Investment metrics
- 1% rule
- 1.23% ✓
- Cap rate
- 8.49%
- Cash-on-cash
- 7.84%
- DSCR
- 1.35
- GRM
- 6.7
CMA / ARV
- ARV (median comp)
- $333,405
- List price
- $199,000
- Delta
- -40.31%
- Verdict
- UNDERPRICED
- Comps
- 20 within 1.0 mi
Show comp detail 12 sales within ~0.75 mi
| Address | Dist | Beds/Ba | Sqft | Sold | Price | $/sf | Match |
|---|---|---|---|---|---|---|---|
| 3702 Foster Ave | 0.05mi | 2/2.0 | 1,632 (+2%) | 1mo | $339,000 | $208 | 89 |
| 902 Grundy St | 0.21mi | 3/2.0 (+1) | 1,588 (-0%) | 1mo | $352,500 | $222 | 80 |
| 341 S Macon St | 0.47mi | 2/2.0 | 1,625 (+2%) | 1mo | $214,900 | $132 | 70 |
| 738 S Macon St | 0.37mi | 3/2.5 (+1) | 1,568 (-2%) | 0mo | $348,000 | $222 | 69 |
| 118 S Eaton St | 0.40mi | 3/3.5 (+1) | 1,569 (-2%) | 1mo | $330,000 | $210 | 63 |
| 263 S East Ave | 0.44mi | 2/2.0 | 1,767 (+11%) | 0mo | $375,000 | $212 | 58 |
| 1006 S East Ave | 0.45mi | 3/2.0 (+1) | 1,482 (-7%) | 1mo | $360,000 | $243 | 58 |
| 735 S Curley St | 0.53mi | 3/2.0 (+1) | 1,476 (-8%) | 1mo | $325,000 | $220 | 53 |
| 616 S Belnord Ave | 0.70mi | 3/3.0 (+1) | 1,608 (+1%) | 1mo | $370,000 | $230 | 53 |
| 38 S Curley St | 0.71mi | 3/1.0 (+1) | 1,729 (+8%) | 0mo | $181,100 | $105 | 47 |
| 628 Savage St S | 0.68mi | 3/2.0 (+1) | 1,482 (-7%) | 0mo | $190,000 | $128 | 47 |
| 802 S Potomac St | 0.53mi | 3/3.0 (+1) | 1,755 (+10%) | 0mo | $435,000 | $248 | 46 |
Match score weights: distance 35% · size 25% · config 20% · recency 20%. Top-matched comps best support the ARV.
Projected returns pro-forma
-3.0% appreciation · 1.31% rent growth · sell at horizon
- IRR
- -6.4%
- Equity multiple
- 0.77×
- Total profit
- $-13,017
- Equity at exit
- $29,672
- IRR
- 0.8%
- Equity multiple
- 1.05×
- Total profit
- $2,868
- Equity at exit
- $17,206
Cash invested: $55,720 (down + closing). Projections, not guarantees.
Landlord ↔ Tenant lean methodology
- Overall (CITY)
- 12 Strongly Tenant-Friendly
- State Maryland
- 27 Tenant-Leaning · D+14
- County
- — inherits STATE
- City Baltimore
- 12 Strongly Tenant-Friendly · D+58
ZIP-level market 21224
- Rents YoY
- 1.3%
- Active inventory
- 391
- Price-to-rent
- 6.7×
Monthly cashflow live
- Estimated rent
- $2,457 high interval (Pro) →
- Mortgage (P&I)
- −$1,044
- Tax from tax record
- −$451 /mo · $5,407/yr
- Insurance
- −$83
- HOA
- −$0
- Vacancy / Maint / Mgmt
- −$516
- Net cashflow
- $364
Break-even live
UW: 25.0% down · 7.5% · 30yr · 1.5% tax · 5.0% vac · 8.0% maint · 8.0% mgmt
Financing live
Cash to close
- Down payment
- $49,750
- Closing costs
- $5,970
- Reserves months
- —
- Total cash needed
- —
Loan-product check · same deal, 3 products live
Conventional
25% down · 7.5% · 30yr
- Down + closing
- —
- Monthly P&I
- —
- Monthly cashflow
- —
- DSCR
- —
- Eligible?
- —
Personal DTI + credit; lowest rate.
DSCR
20% down · 8.5% · 30yr
- Down + closing
- —
- Monthly P&I
- —
- Monthly cashflow
- —
- DSCR
- —
- Eligible?
- —
No personal income docs; deal must DSCR.
Hard money
10% down · 12.0% · 12mo
- Down + closing
- —
- Monthly P&I
- —
- Monthly cashflow
- —
- DSCR
- —
- Eligible?
- —
Short-term bridge; refi at stabilization.
Rent comps 40 comps
| Address | Beds | Baths | Sqft | Rent | $/sqft | DOM | Units | Dist |
|---|---|---|---|---|---|---|---|---|
| 611 Grundy St Baltimore, MD | 3.0 | 2.0 | 1434 | $2,700 | $1.88 | 24d | 1 | 0.11mi |
| 4015 Eastern Ave Unit 2L Baltimore, MD | 3.0 | 2.0 | 1100 | $1,800 | $1.64 | 44d | 1 | 0.16mi |
| 502 S Haven St Baltimore, MD | 2.0 | 2.5 | 1440 | $2,400 | $1.67 | 24d | 1 | 0.16mi |
| 502 S Haven St Baltimore, MD | 2.0 | 2.5 | 1440 | $2,400 | $1.67 | 16d | 1 | 0.16mi |
| 3905 Bank St Baltimore, MD | 4.0 | 1.0–3.0 | 909 | $2,350 | $2.58 | 2d | 20 | 0.16mi |
| 939 S Baylis St Baltimore, MD | 3.0 | 3.0 | 1606 | $3,500 | $2.18 | 18d | 1 | 0.26mi |
| 3245 Fait Ave Baltimore, MD | 3.0 | 2.0 | 1470 | $2,900 | $1.97 | 44d | 1 | 0.29mi |
| 1015 S Clinton St Baltimore, MD | 2.0 | 2.5 | 1880 | $2,800 | $1.49 | 24d | 1 | 0.36mi |
| 235 S Highland Ave Baltimore, MD | 2.0 | 1.5 | 1222 | $2,000 | $1.64 | 24d | 1 | 0.36mi |
| 1211 S Eaton St Unit 3035 Baltimore, MD | 3.0 | 2.0 | 1545 | $3,900 | $2.52 | 24d | 1 | 0.36mi |
| 4505 Foster Ave Baltimore, MD | 3.0 | 3.0 | 1376 | $2,650 | $1.93 | 24d | 1 | 0.36mi |
| 4500 Fait Ave Baltimore, MD | 3.0 | 3.5 | 1792 | $2,800 | $1.56 | 44d | 1 | 0.37mi |
| 3850 Boston St Baltimore, MD | 2.0 | 1.0–2.0 | 854 | $3,378 | $3.96 | 2d | 22 | 0.38mi |
| 3710 E Pratt St Baltimore, MD | 2.0 | 3.5 | 1230 | $1,900 | $1.54 | 24d | 1 | 0.38mi |
| 4519 Foster Ave Baltimore, MD | 3.0 | 4.0 | 1888 | $2,950 | $1.56 | 24d | 1 | 0.39mi |
| 527 S Lehigh St Baltimore, MD | 3.0 | 2.0 | 1320 | $2,325 | $1.76 | 44d | 1 | 0.39mi |
| 115 S Eaton St Baltimore, MD | 3.0 | 2.5 | 1393 | $1,800 | $1.29 | 16d | 1 | 0.42mi |
| 3700 Toone St Baltimore, MD | 1.0–2.0 | 1.0–2.0 | 1093 | $3,218 | $2.94 | 2d | 28 | 0.42mi |
| 1200 S Conkling St Baltimore, MD | 1.0–2.0 | 1.0–2.0 | 1085 | $2,933 | $2.70 | 2d | 16 | 0.43mi |
| 622 S Ellwood Ave Baltimore, MD | 3.0 | 2.0 | 1906 | $2,800 | $1.47 | 44d | 1 | 0.43mi |
| 249 S East Ave Baltimore, MD | 2.0 | 2.0 | 1680 | $2,250 | $1.34 | 24d | 1 | 0.45mi |
| 3036 Hudson St Baltimore, MD | 2.0 | 2.5 | 1428 | $2,600 | $1.82 | 44d | 1 | 0.47mi |
| 727 S Macon St Baltimore, MD | 3.0 | 2.5 | 1600 | $3,450 | $2.16 | 44d | 1 | 0.47mi |
| 410 S Newkirk St Baltimore, MD | 2.0 | 1.5 | 1330 | $1,580 | $1.19 | 44d | 1 | 0.48mi |
| 3502 E Lombard St Baltimore, MD | 3.0 | 2.0 | 1522 | $1,870 | $1.23 | 44d | 1 | 0.48mi |
| 608 Oldham St Baltimore, MD | 3.0 | 3.5 | 1640 | $2,500 | $1.52 | 24d | 1 | 0.49mi |
| 3436 Leverton Ave Baltimore, MD | 3.0 | 3.5 | 1500 | $2,350 | $1.57 | 24d | 1 | 0.51mi |
| 611 Oldham St Baltimore, MD | 2.0 | 1.0 | 1148 | $1,800 | $1.57 | 13d | 1 | 0.51mi |
| 230 S Newkirk St Baltimore, MD | 3.0 | 3.5 | 1600 | $3,000 | $1.88 | 18d | 1 | 0.53mi |
| 228 S Newkirk St Baltimore, MD | 3.0 | 3.5 | 1620 | $3,000 | $1.85 | 44d | 1 | 0.53mi |
| 224 S Newkirk St Baltimore, MD | 3.0 | 3.5 | 1600 | $3,300 | $2.06 | 20d | 1 | 0.53mi |
| 106 S Bouldin St Baltimore, MD | 2.0 | 3.0 | 1134 | $2,100 | $1.85 | 20d | 1 | 0.53mi |
| 214 S Newkirk St Unit 214 Baltimore, MD | 3.0 | 5.0 | 2000 | $3,000 | $1.50 | 44d | 1 | 0.54mi |
| 127 S Robinson St Baltimore, MD | 2.0 | 1.5 | 1400 | $2,000 | $1.43 | 44d | 1 | 0.56mi |
| 3430 E Baltimore St Baltimore, MD | 3.0 | 2.5 | 1316 | $2,250 | $1.71 | 24d | 1 | 0.56mi |
| 133 S Macon St Baltimore, MD | 2.0 | 2.5 | 1440 | $2,400 | $1.67 | 18d | 1 | 0.58mi |
| 1209 S Ellwood Ave Baltimore, MD | 2.0 | 2.0 | 1188 | $2,250 | $1.89 | 44d | 1 | 0.58mi |
| 3304 E Baltimore St Baltimore, MD | 3.0 | 1.5 | 1514 | $1,875 | $1.24 | 44d | 1 | 0.61mi |
| 3212 E Baltimore St Baltimore, MD | 2.0 | 3.0 | 1931 | $2,350 | $1.22 | 24d | 1 | 0.64mi |
| 523 Rappolla St Baltimore, MD | 3.0 | 2.0 | 1650 | $2,100 | $1.27 | 24d | 1 | 0.66mi |
Listing history 6 events
-
2026-06-04status $199,000 Pending 8 DOM
-
2026-06-03days on market $199,000 Active 8 DOM
-
2026-06-02days on market $199,000 Active 7 DOM
-
2026-06-01days on market $199,000 Active 6 DOM
-
2026-05-31days on market $199,000 Active 5 DOM
-
2026-05-15historical $199,000 1960-char remark
ⓘ Source: listings_history table (triggers on properties + properties_extension) + one-shot
backfill from property_details.listing_events for pre-trigger history.
Tax reassessment forecast MD · Partial reset (capped growth)
- Current annual tax
- $5,407 · $451/mo
- Projected year-2 tax
- $5,407 · $451/mo
- Expected delta
- $0/yr ($0/mo · 0.0%)
ⓘ Screening estimate from a state-policy table — verify with the county assessor before closing.
Climate risk First Street
- Flood 1/10 Low FEMA zone X (unshaded) · 0% chance over 30 yrs
- Wildfire 1/10 Low
- Heat 8/10 Severe 7 d/yr ≥103°F today · 15 d/yr by 30 yrs out
- Wind 6/10 Major 27% chance of damaging wind over 30 yrs
- Air quality 4/10 Moderate 6 unhealthy d/yr today · 7 by 30 yrs out
Nearby sold comps map
Loading sold comps map…
Walkable amenities ~0.75 mi
Loading nearby amenities…
Taxation est. · year 1
- Rental income
- $29,483
- − Mortgage interest
- −$11,147
- − Property taxes
- −$5,407
- − Insurance
- −$995
- − Repairs & maintenance
- −$2,359
- − Management
- −$2,359
- − Depreciation
- −$5,789
- Taxable income
- $1,428
- Est. tax owed @ 24.0%
- −$343
- After-tax cash flow
- $4,024/yr
For passive investors: Depreciation is non-cash, so a rental often shows a tax loss while cash-flowing — sheltering income. Rental losses are passive: they offset passive income freely, and up to $25,000/yr can offset ordinary (W-2) income if you actively participate and your MAGI is under $100k (phasing out to $0 by $150k); unused losses carry forward. On sale, claimed depreciation is recaptured at up to 25%, and gains may owe capital-gains tax (a 1031 exchange can defer both). Figures are a year-1 estimate at your 24.0% rate — not tax advice; consult a CPA.
Schools (NCES district)
- District
- Baltimore City Public Schools
- NCES district ID
- 2400090
- Math proficiency
- 7% ▼ -9.00%
- Reading proficiency
- 16% ▼ -5.00%
- Median HH income
- $42,108
- Composite
- 10.08/100
- National rank
- #9805
- State rank
- #24 of 24 in MD
Livability — Baltimore
- Score
- 76/100
- State rank
- #90
- US rank
- #3396
Category grades
Schools grade is shown separately in the Schools card above.
Census & demographics
- Census place
- Baltimore, MD
- County
- Baltimore City · 558,601 people
- City population
- 588,727
- Metro
- Baltimore-Columbia-Towson, MD
- Population (ZIP)
- 47,465
- Household income
- $89,017
- Rent vs Own
- Severe rent burden
- 1786.0
Population outlook (Baltimore County) Hauer SSP2
- Today (2025)
- 624,249 people
- By 2030
- 621,541 · -0.4%
- By 2040
- 609,756 · -2.3%
- By 2050
- 597,249 · -4.3%
- By 2075
- 552,236 · -11.5%
- By 2100
- 513,934 · -17.7%
Race, ethnicity, and origin ACS 2023
- Neighborhood character
- Diverse neighborhood (Simpson 0.62)
- Race & ethnicity
- White 55% Hispanic / Latino 21% Black 16% Two or more races 7% Asian 4%
- Hispanic origin (detail)
- Mexican 4% Puerto Rican 2% Dominican 1%
- Common ancestry
- Romanian 5% Lithuanian 2% Italian 1%
- Foreign-born
- 17% · Canada, China, Vietnam
- Languages at home
- 76% English-only · Spanish 18% Other Indo-European 2% Russian/Polish/Slavic 1%
Political lean MEDSL · Baltimore
- 2024 margin
- Solid D (+73.0) · D 85.2% · R 12.2% · Other 2.6%
- 2008→2024 swing
- -2.5pp toward R · 2008: 75.5pp · 2024: 73.0pp
- All cycles
- 2024: D+73.0 2020: D+76.6 2016: D+74.6 2012: D+76.4 2008: D+75.5
Not yet ingested
- Civics
- —
Market trends
- HPI YoY
- ▼ -332.23%
- Current HPI
- 241.284
- Rent YoY
- ▲ 1.31%
- Metro
- Baltimore-Columbia-Towson, MD
- State GDP YoY
- ▲ 2.97%
- F500 in state
- 12
Industry mix (Fortune 500 HQ in MD)
| Industry | F500 HQs | Revenue |
|---|---|---|
| Aerospace / Defense | 1 | $71B |
|
||
| Utilities | 1 | $25B |
|
||
| Hotels | 1 | $24B |
|
||
| Consumer Goods | 1 | $7B |
|
||
| Real Estate | 1 | $6B |
|
||
| Chemicals | 1 | $2B |
|
||
Price history
+0.0% since first listed3 events — show timeline
- 2026-06-03 Pending — BRIGHT MLS
- 2026-05-27 Listed $199,000 BRIGHT MLS
- 2026-05-15 Coming Soon $199,000 BRIGHT MLS
Property tax history
+2.9%/yrLatest (2025): $5,407 · +3.5% YoY. Source: county tax records.
Cash-flow waterfall
monthlySold comps — $/sqft
last 12 mo · ≤1 miLoading sold comps…