12760 Indian Rocks Rd #1004 · Largo, FL
Flood risk 8/10 · Major
- FEMA flood zone
- X (shaded)
- Chance of flooding over 30 yrs
- 0.99%
- Est. flood insurance / yr
- $507 – $1,088
Fire risk 1/10 · Minimal
- Est. fire insurance / yr
- $947 – $1,759
Heat risk 10/10 · Severe
- Hot days now (above 107°F)
- 7 days/yr
- Hot days in 30 yrs
- 24 days/yr
Wind risk 10/10 · Severe
- Chance of severe wind over 30 yrs
- 99.0%
Air-quality risk 3/10 · Minor
- Unhealthy air days now
- 2 days/yr
- Unhealthy air days in 30 yrs
- 3 days/yr
Risk factors via First Street. Map © Google.
Why this score? — see what drove the D grade
The composite is a weighted blend of 9 inputs, each scored 0–100. Each bar is that input's sub-score; the figure is the points it added to the 100-point composite (weight × sub-score).
- Cash flow +11.2/30.0
- 1% rule +8.6/10.0
- ARV discount +7.5/15.0
- Schools +4.3/10.0
- Livability +4.1/5.0
- DSCR +3.3/10.0
- Rent growth +3.0/5.0
- Condition / age +2.5/5.0
- Appreciation +0.0/10.0
$139,900
🖨 Deal sheet (PDF) 📄 Offer letter ✓ Due diligence
Listing remarks
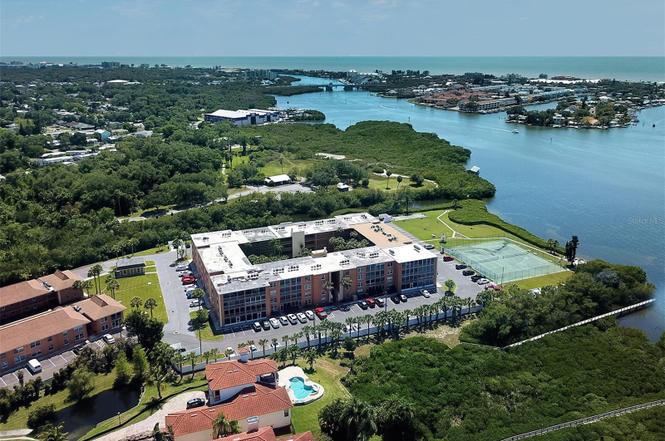
Fully furnished ground floor unit in well maintained gated complex. New cabinets & countertops and freshly painted. Convenient parking space next to entrance hallway. This unit is in popular building 10 which is on the Intracoastal Waterway and surrounds one of the 2 heated pools in the complex. Park-like setting with 2 heated pools, hot tub, tennis/pickleball courts, tiki huts, grilling areas, picnic tables, shuffleboard, fitness room, car wash area, bike racks, sitting area next to the water, kayak racks with launch to the Intracoastal. Clubhouse hosts many events and has a pool table and internet room with computer. Close to shopping, restaurants, hospitals and the beach. Complex h
Key facts
- $558 HOA
- Community pool
- Built 1972
Property features AI
Finance
- Other: Pets not allowed; Directions: North on Indian Rocks Road from Walsingham (688) about 1/2 mile (west side of road)
- Financial info: Total monthly fees $558 (total annual fees $6,696); Lease restrictions apply; Furnished
- HOA & community: HOA with monthly fees ($558); Association amenities: clubhouse, pool, tennis courts, pickleball courts, shuffleboard, spa/hot tub, laundry, gated community, street lights, cable TV; Association approval required; Association fee covers: cable TV, pool, escrow reserves, insurance, internet, structural and grounds maintenance, management, pest control, sewer, trash, water
Exterior
- Parking: Assigned parking; Guest parking
- Security: Gated community with security gate
- Utilities: Public water; Public sewer; Cable connected; Electricity connected; Phone available; Fire hydrant; Sewer connected; Water connected
- Home design: Residential condominium; One story; East-facing
- Construction: Block and stucco construction; Built-up roof; Slab foundation; Built as part of New Atlantis Club
- Exterior features: Outdoor grill; Tennis courts; Vinyl fencing; Heated in-ground spa; Gunite heated pool; Private pool; Seawall (concrete); Mature landscaping with trees; Paved, asphalt road access; Flood zone (flood insurance required)
Interior
- Kitchen: Dishwasher; Range; Range hood; Refrigerator
- Bedrooms: 1 bedroom
- Flooring: Ceramic tile
- Bathrooms: 1 full bathroom
- Heating & cooling: Central heating (electric); Central air conditioning
- Interior features: Ceiling fans; Crown molding; Living room/dining room combo; Blinds
- Laundry & utility: Dedicated laundry room
Neighborhood map
What this means for you Summary
Snapshot
- This is a 1-bed/1.0-bath condo listed at $140k.
Deal economics
- At list price, monthly cash flow is $-120 ($-1k/yr) — negative.
- To cash-flow at today's rent, offer at most $119k (15.2% below list).
- Meets the 1% rule at list price ($2k rent vs $140k).
- Recommended offer: $119k (15.2% below list) — sets the bar for cash-flow.
- Cap rate 5.8% vs local median 4.3% in Largo — top-decile yield for the area; either an underpriced asset or a hidden risk that comps aren't pricing in. Stress-test before assuming the spread holds.
Location & tenants
- Location reads 82/100 on livability (#82 in FL, #1,240 nationally) — a professional / high-income tenant draw. Strengths: commute A+, cost of living A+, housing A+; Watch: employment D+, amenities F.
- Pinellas (suburban): math 51% / reading 51% proficiency, ranked #31 of 73 in FL (top 42%) — acceptable for families but not a draw, mixed tenant base, ~2y average lease.
- Zoned schools: Anona Elementary School (math 80% / reading 67%, grade A, #260 of 2,144 statewide, top 13%, 473 students, 45% FRL); Seminole Middle School (math 55% / reading 53%, grade B-, #196 of 571 statewide, top 36%, 824 students, 49% FRL); Largo High School (math 30% / reading 50%, grade F, #296 of 667 statewide, top 45%, 2,055 students, 53% FRL) — zoned schools at 49% FRL track the district average.
- Market conditions: Rents rising (+2.0%/yr); 212 active listings in the ZIP; 13 comparable units currently listed for rent nearby; rentals leasing fast (median 6d on market — plan ~1-2 weeks tenant-placement turnaround); solid renter incomes; 2,676 units permitted in Pinellas County in 2024 (1,422 in 5+ unit buildings).
Forward outlook
- Local home prices are declining (-3.0%/yr); year-one equity from $967 of loan paydown is wiped out by about $4k of value loss. Plan a longer hold.
- Pinellas County population projected at +14% by 2050 — modest demand growth; plan on rents tracking national, not racing it.
Negotiation context
- It's been on market 641 days — a 12% lower offer ($123k) is reasonable based on typical stale-listing flexibility.
- 2 sale attempts since 2y ago; this cycle's ask has dropped $40k (22%) from the opening price — seller is motivated, your offer sets the floor, not the list.
- Current owner paid $36k; list at $140k implies a 289% gain — meaningful room to come down on a strong offer.
Risks & watch-outs
- Watch-outs: flood insurance adds $66/mo; HOA is 29% of rent.
- Climate carrying-cost: severe flood risk; severe wind risk, 99% chance of damaging wind over 30y; extreme-heat days projected 7→24/yr by 2055 (HVAC capex compounding) — expect insurance premiums to compound above CPI over the hold.
Questions for the listing agent
- What do current leases actually rent for vs. the listed asking? Can we see a recent rent roll and the last 12 months of T-12 income?
- It's been on market 641 days. Have you received any prior offers? Is the seller open to a 15% concession, seller financing, or rate buy-down credit?
- Built in 1972 — when were the roof, HVAC, electrical panel, plumbing, and water heater last replaced?
- What's the actual annual flood-insurance premium (NFIP or private), and is the property in a SFHA with mandatory coverage?
- What does the HOA fee cover, when was the last increase, and are there any pending special assessments or reserve-fund shortfalls?
- Any open or pending special assessments — roof, HVAC, plumbing, elevator, façade? What's the per-unit balance and payoff schedule, and is the seller paying it off at close or rolling it to the buyer?
- Why hasn't it sold? Are there any deal-killer items the seller is aware of (foundation, flood, title, zoning, code violations)?
- Is there a deadline driving the sale (1031 exchange, divorce, estate, relocation)? That informs how much negotiation room exists.
- The area grade is low — what's the realistic commute time and amenity access for the typical tenant pool here? Any planned neighborhood developments (good or bad) we should know about?
- What's the average days-on-market for RENTAL listings here right now (not sales)? A rising rental-DOM trend means longer vacancies and softer asking-rent achievability than the comps imply.
- What's the recent tenant-quality profile in this submarket — average credit score on applications, eviction rate, late-payment / NSF rate, and stable-employment percentage? A property-management company in the area should have these aggregated.
- How much new apartment / multifamily construction is in the pipeline within 1–3 miles? Heavy new supply (>2% of stock underway) typically softens rents 12–24 months out; light construction supports rent growth.
Investment metrics
- 1% rule
- 1.36% ✓
- Cap rate
- 5.83%
- Cash-on-cash
- -1.65%
- DSCR
- 0.93
- GRM
- 6.1
CMA / ARV
No comps found within radius.
Projected returns pro-forma
-3.0% appreciation · 2.01% rent growth · sell at horizon
- IRR
- -24.0%
- Equity multiple
- 0.19×
- Total profit
- $-31,784
- Equity at exit
- $20,860
- IRR
- -23.5%
- Equity multiple
- -0.11×
- Total profit
- $-43,351
- Equity at exit
- $12,096
Cash invested: $39,172 (down + closing). Projections, not guarantees.
Landlord ↔ Tenant lean methodology
- Overall (STATE)
- 87 Strongly Landlord-Friendly
- State Florida
- 87 Strongly Landlord-Friendly · R+3
- County
- — inherits STATE
- City
- — inherits STATE
ZIP-level market 33774
- Rents YoY
- 2.0%
- Active inventory
- 212
- Price-to-rent
- 6.1×
Monthly cashflow live
- Estimated rent
- $1,906 high interval (Pro) →
- Mortgage (P&I)
- −$734
- Tax from tax record
- −$210 /mo · $2,516/yr
- Insurance
- −$58
- Flood insurance flood zone
- −$66 /mo · $798/yr
- HOA
- −$558
- Vacancy / Maint / Mgmt
- −$400
- Net cashflow
- $-120
Break-even live
Sensitivity live
| Price | -10% $-41 | -5% $-81 | +0% $-120 | +5% $-160 | +10% $-200 |
|---|---|---|---|---|---|
| Rent | -10% $-271 | -5% $-196 | +0% $-120 | +5% $-45 | +10% $30 |
| Rate | -1.0pp $-50 | -0.5pp $-85 | base $-120 | +0.5pp $-157 | +1.0pp $-194 |
UW: 25.0% down · 7.5% · 30yr · 1.5% tax · 5.0% vac · 8.0% maint · 8.0% mgmt
Financing live
Cash to close
- Down payment
- $34,975
- Closing costs
- $4,197
- Reserves months
- —
- Total cash needed
- —
Loan-product check · same deal, 3 products live
Conventional
25% down · 7.5% · 30yr
- Down + closing
- —
- Monthly P&I
- —
- Monthly cashflow
- —
- DSCR
- —
- Eligible?
- —
Personal DTI + credit; lowest rate.
DSCR
20% down · 8.5% · 30yr
- Down + closing
- —
- Monthly P&I
- —
- Monthly cashflow
- —
- DSCR
- —
- Eligible?
- —
No personal income docs; deal must DSCR.
Hard money
10% down · 12.0% · 12mo
- Down + closing
- —
- Monthly P&I
- —
- Monthly cashflow
- —
- DSCR
- —
- Eligible?
- —
Short-term bridge; refi at stabilization.
Rent comps 13 comps
| Address | Beds | Baths | Sqft | Rent | $/sqft | DOM | Units | Dist |
|---|---|---|---|---|---|---|---|---|
| 12760 Indian Rocks Rd Largo, FL | 1.0–2.0 | 1.0–2.0 | 923 | $1,450 | $1.57 | 0d | 5 | 0.06mi |
| 14531 Walsingham Rd Largo, FL | 2.0 | 1.0–2.0 | 657 | $2,200 | $3.35 | 26d | 3 | 0.56mi |
| 717 E Gulf Blvd Apt 2 Indian Rocks Beach, FL | — | 1.0 | 400 | $1,500 | $3.75 | 22d | 1 | 0.64mi |
| 720 E Gulf Blvd Unit B Indian Rocks Beach, FL | 2.0 | 1.0 | 748 | $2,600 | $3.48 | 22d | 1 | 0.68mi |
| 206 Bates Ave Unit E Indian Rocks Beach, FL | 1.0 | 1.0 | 600 | $1,945 | $3.24 | 6d | 1 | 0.70mi |
| 206 Bates Ave Indian Rocks Beach, FL | 1.0 | 1.0 | 600 | $1,945 | $3.24 | 0d | 1 | 0.70mi |
| 12800 Vonn Rd Largo, FL | 1.0–2.0 | 1.0 | 810 | $1,185 | $1.46 | 0d | 16 | 0.91mi |
| 13125 Wilcox Rd Largo, FL | 1.0–2.0 | 1.0–2.0 | 840 | $1,533 | $1.82 | 4d | 8 | 0.99mi |
| 103 18th Ave Unit 6A Indian Rocks Beach, FL | 1.0 | 1.0 | 445 | $1,750 | $3.93 | 6d | 1 | 0.99mi |
| 103 18th Ave Unit 6A Indian Rocks Beach, FL | 1.0 | 1.0 | 445 | $1,750 | $3.93 | 0d | 1 | 0.99mi |
| 2200 Gladys St Largo, FL | 1.0–2.0 | 1.0–1.5 | 677 | $1,095 | $1.62 | 26d | 1 | 1.05mi |
| 13300 Walsingham Rd Largo, FL | 1.0–4.0 | 1.0–2.0 | 1060 | $1,395 | $1.32 | 26d | 1 | 1.10mi |
| 2704 2nd St Indian Rocks Beach, FL | 1.0 | 1.0 | 624 | $2,350 | $3.77 | 5d | 3 | 1.48mi |
HOA detail condo
- Monthly dues
- $558 · $6,696/yr
- Likely covers
- waterinternetpoolsecurity
- Assessments
- None detected in remarks — confirm with the listing agent.
Listing history 22 events
-
2026-06-22days on market $139,900 Active 641 DOM
-
2026-06-18days on market $139,900 Active 638 DOM
-
2026-06-17days on market $139,900 Active 637 DOM
-
2026-06-16days on market $139,900 Active 636 DOM
-
2026-06-15days on market $139,900 Active 635 DOM
-
2026-06-13days on market $139,900 Active 633 DOM
-
2026-06-09days on market $139,900 Active 629 DOM
-
2026-06-08days on market $139,900 Active 628 DOM
-
2026-06-07days on market $139,900 Active 627 DOM
-
2026-06-04days on market $139,900 Active 624 DOM
-
2026-06-03days on market $139,900 Active 623 DOM
-
2026-06-01days on market $139,900 Active 621 DOM
-
2026-05-31days on market $139,900 Active 620 DOM
-
2026-04-09price $139,900
-
2025-12-18status Active
-
2025-12-11historical
-
2025-09-12price $149,900
-
2025-06-11price $159,900
-
2025-01-10price $170,000
-
2024-09-11$180,000 Active
-
1991-06-17soldstatus $36,000
-
1981-03-01soldstatus $36,300
ⓘ Source: listings_history table (triggers on properties + properties_extension) + one-shot
backfill from property_details.listing_events for pre-trigger history.
Tax reassessment forecast FL · Resets to sale price
- Current annual tax
- $2,516 · $210/mo
- Projected year-2 tax
- $2,516 · $210/mo
- Expected delta
- $0/yr ($0/mo · 0.0%)
ⓘ Screening estimate from a state-policy table — verify with the county assessor before closing.
Climate risk First Street
- Flood 8/10 Severe FEMA zone X (shaded) · 99% chance over 30 yrs
- Wildfire 1/10 Low
- Heat 10/10 Extreme 7 d/yr ≥107°F today · 24 d/yr by 30 yrs out
- Wind 10/10 Extreme 99% chance of damaging wind over 30 yrs
- Air quality 3/10 Moderate 2 unhealthy d/yr today · 3 by 30 yrs out
Nearby sold comps map
Loading sold comps map…
Walkable amenities ~0.75 mi
Loading nearby amenities…
Taxation est. · year 1
- Rental income
- $22,871
- − Mortgage interest
- −$7,837
- − Property taxes
- −$2,516
- − Insurance
- −$1,497
- − Repairs & maintenance
- −$1,830
- − Management
- −$1,830
- − HOA
- −$6,696
- − Depreciation
- −$4,070
- Taxable loss
- −$3,404
- Est. tax savings @ 24.0%
- +$817
- After-tax cash flow
- $-628/yr
For passive investors: Depreciation is non-cash, so a rental often shows a tax loss while cash-flowing — sheltering income. Rental losses are passive: they offset passive income freely, and up to $25,000/yr can offset ordinary (W-2) income if you actively participate and your MAGI is under $100k (phasing out to $0 by $150k); unused losses carry forward. On sale, claimed depreciation is recaptured at up to 25%, and gains may owe capital-gains tax (a 1031 exchange can defer both). Figures are a year-1 estimate at your 24.0% rate — not tax advice; consult a CPA.
Schools (NCES district)
- District
- Pinellas
- NCES district ID
- 1201560
- Math proficiency
- 51% ▼ -5.00%
- Reading proficiency
- 51% ▼ -3.00%
- Median HH income
- $46,270
- Composite
- 43.27/100
- National rank
- #3046
- State rank
- #31 of 73 in FL
Livability — Largo
- Score
- 82/100
- State rank
- #82
- US rank
- #1240
Category grades
Schools grade is shown separately in the Schools card above.
Census & demographics
- Census place
- Largo, FL
- County
- Pinellas County · 939,478 people
- City population
- 106,311
- Metro
- Tampa-St. Petersburg-Clearwater, FL
- Population (ZIP)
- 19,799
- Household income
- $79,139
- Rent vs Own
- Severe rent burden
- 546.0
Population outlook (Pinellas County) Hauer SSP2
- Today (2025)
- 1,027,532 people
- By 2030
- 1,063,586 · +3.5%
- By 2040
- 1,125,020 · +9.5%
- By 2050
- 1,168,637 · +13.7%
- By 2075
- 1,265,188 · +23.1%
- By 2100
- 1,260,357 · +22.7%
Race, ethnicity, and origin ACS 2023
- Neighborhood character
- Predominantly White (74%)
- Race & ethnicity
- White 74% Black 11% Hispanic / Latino 9% Two or more races 7%
- Hispanic origin (detail)
- Mexican 2% Puerto Rican 3% Cuban 2%
- Common ancestry
- Romanian 7% Lithuanian 4% Hispanic 2%
- Foreign-born
- 8% · Canada
- Languages at home
- 91% English-only · Spanish 4% French/Haitian/Cajun 2% Russian/Polish/Slavic 1%
Political lean MEDSL · Pinellas
- 2024 margin
- Lean R (+5.2) · D 46.9% · R 52.1%
- 2008→2024 swing
- -13.5pp toward R · 2008: 8.3pp · 2024: -5.2pp
- All cycles
- 2024: R+5.2 2020: D+0.2 2016: R+1.1 2012: D+5.6 2008: D+8.3
Not yet ingested
- Civics
- —
Market trends
- HPI YoY
- ▼ -383.61%
- Current HPI
- 336.629
- Rent YoY
- ▲ 2.01%
- Metro
- Tampa-St. Petersburg-Clearwater, FL
- State GDP YoY
- ▲ 3.28%
- F500 in state
- 36
Industry mix (Fortune 500 HQ in FL)
| Industry | F500 HQs | Revenue |
|---|---|---|
| Industrial Technology | 2 | $29B |
|
||
| Insurance | 2 | $17B |
|
||
| Retail | 1 | $60B |
|
||
| Technology Distribution | 1 | $58B |
|
||
| Homebuilding | 1 | $35B |
|
||
| Technology Manufacturing | 1 | $35B |
|
||
Price history
+285.4% since first listed9 events — show timeline
- 2026-04-09 Price Changed $139,900 Stellar MLS as Distributed by MLS Grid
- 2025-12-18 Relisted — Stellar MLS as Distributed by MLS Grid
- 2025-12-11 Listing Removed — Stellar MLS as Distributed by MLS Grid
- 2025-09-12 Price Changed $149,900 Stellar MLS as Distributed by MLS Grid
- 2025-06-11 Price Changed $159,900 Stellar MLS as Distributed by MLS Grid
- 2025-01-10 Price Changed $170,000 Stellar MLS as Distributed by MLS Grid
- 2024-09-11 Listed $180,000 Stellar MLS as Distributed by MLS Grid
- 1991-06-17 Sold (Public Records) $36,000 Public Records
- 1981-03-01 Sold (Public Records) $36,300 Public Records
Property tax history
+5.4%/yrLatest (2025): $2,516 · +7.3% YoY. Source: county tax records.
Cash-flow waterfall
monthlySold comps — $/sqft
last 12 mo · ≤1 miLoading sold comps…