501 S Jackson St · Ripley, MS
Flood risk 1/10 · Minimal
- FEMA flood zone
- X (unshaded)
- Chance of flooding over 30 yrs
- 0.0%
- Est. flood insurance / yr
- $507 – $1,088
Fire risk 5/10 · Moderate
- Est. fire insurance / yr
- $1,241 – $2,305
Heat risk 6/10 · Moderate
- Hot days now (above 109°F)
- 7 days/yr
- Hot days in 30 yrs
- 20 days/yr
Wind risk 5/10 · Moderate
- Chance of severe wind over 30 yrs
- 26.0%
Air-quality risk 1/10 · Minimal
- Unhealthy air days now
- 0 days/yr
- Unhealthy air days in 30 yrs
- 0 days/yr
Risk factors via First Street. Map © Google.
Why this score? — see what drove the D grade
The composite is a weighted blend of 9 inputs, each scored 0–100. Each bar is that input's sub-score; the figure is the points it added to the 100-point composite (weight × sub-score).
- Cash flow +15.0/30.0
- ARV discount +7.5/15.0
- 1% rule +5.0/10.0
- DSCR +5.0/10.0
- Schools +3.3/10.0
- Livability +3.2/5.0
- Rent growth +2.5/5.0
- Condition / age +2.5/5.0
- Appreciation +0.0/10.0
$20,000
🖨 Deal sheet 📄 Offer letter ✓ Due diligence
Listing remarks MLS
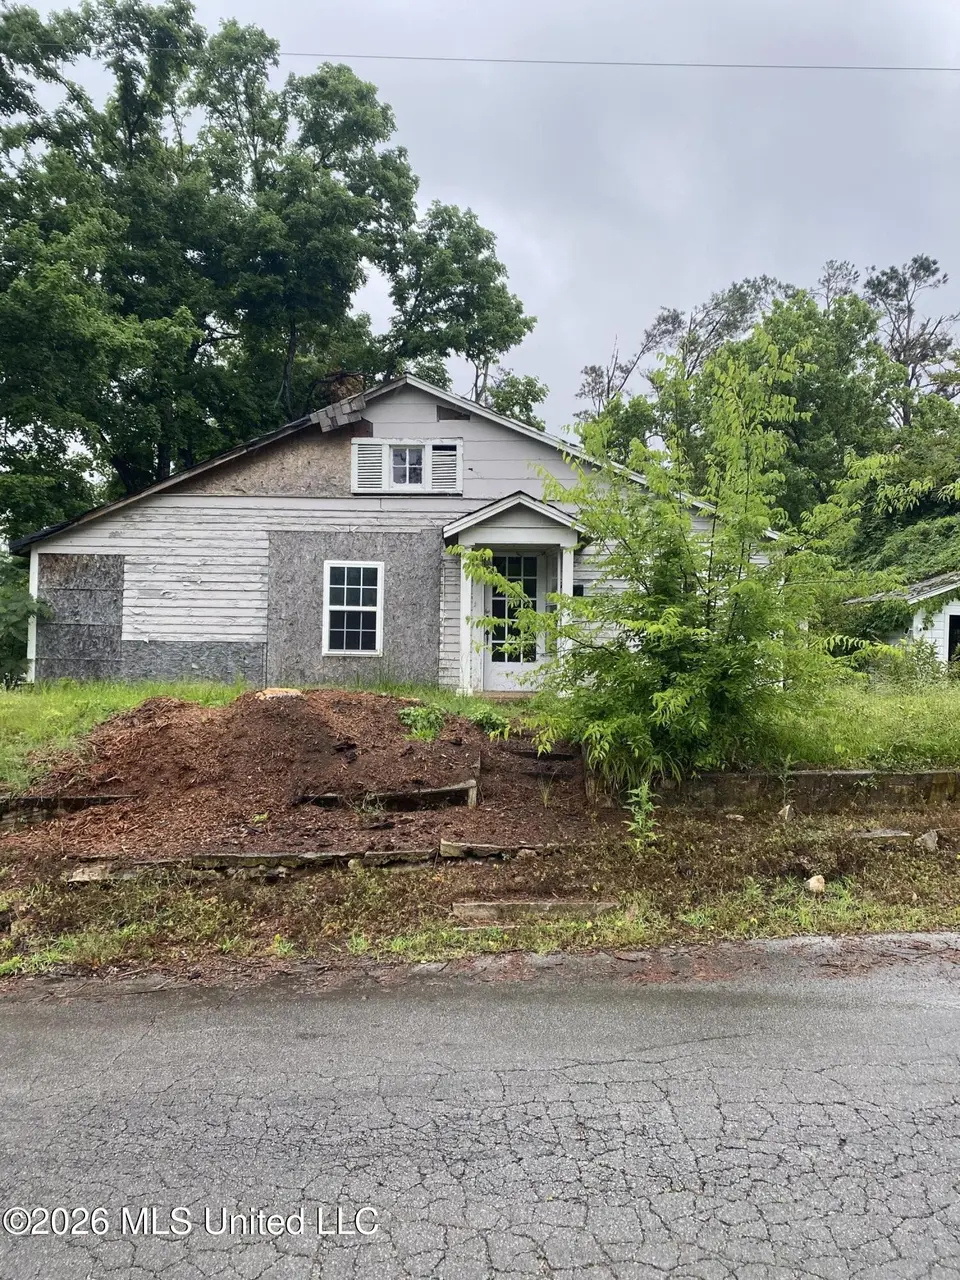
GREAT INVESTMENT PROPERTY AND OUTSTANDING LOCATION TO CITY AMENITIES!
Key facts
- Multiple fireplaces
- Original wood floors
- Corner lot
Tags
Property features AI
Exterior
- Parking: Detached garage (2 spaces)
- Utilities: Public water; Public sewer; Water available
- Home design: Single-family house; One level
- Construction: Wood siding; Raised foundation on pilings/steel/wood; Built (year from public records)
- Exterior features: Shingle roof; Corner city lot with few trees
Interior
- Bathrooms: 1 full bathroom
- Heating & cooling: Natural gas heating; No central cooling indicated
- Interior features: Family room on the main level; Has fireplace (other fireplace type)
- Laundry & utility: Washer and dryer included
Neighborhood map
What this means for you Summary
Snapshot
- This is a 3-bed/1.0-bath single-family listed at $20k.
Deal economics
- At list price, monthly cash flow is $581 ($7k/yr) — positive.
- The deal already cash-flows at list — no discount required.
- Meets the 1% rule at list price ($957 rent vs $20k).
- Recommended offer: $20k (1.5% below list) — sets the bar for market timing.
Location & tenants
- Location reads 64/100 on livability (#129 in MS) — a middle-class / working-renter tenant base. Strengths: cost of living A+, housing A+, crime A; Watch: schools D-, amenities F, commute F.
- South Tippah School District (town): math 43% / reading 36% proficiency, ranked #42 of 130 in MS (top 32%) — families likely to look elsewhere, expect single-tenant / working-renter base with shorter leases; 61% free/reduced lunch — lower-income household profile, screen leases tightly.
- Market conditions: 51 active listings in the ZIP; 10 units permitted in Tippah County in 2024 (0 in 5+ unit buildings).
Forward outlook
- Local home prices are declining (-3.0%/yr); year-one equity from $138 of loan paydown is wiped out by about $600 of value loss. Plan a longer hold.
- Tippah County population projected to shrink 9% by 2050 — rents likely to lag national; underwrite the cash flow, not the appreciation.
- At projected returns (-3.0% appreciation + 3.0% rent growth), your $6k cash investment doubles in ~1 year — after that, you're playing with house money.
Negotiation context
- It's been on market 21 days — a 2% lower offer ($20k) is reasonable based on typical stale-listing flexibility.
- 2 sale attempts since 12y ago; this cycle's ask has dropped $10k (33%) from the opening price — seller is motivated, your offer sets the floor, not the list.
Risks & watch-outs
- Watch-outs: property tax is 3.7% of price; built in 1956 — expect roof / HVAC / electrical / plumbing capex.
- Climate carrying-cost: moderate wind risk, 26% chance of damaging wind over 30y; moderate wildfire risk; extreme-heat days projected 7→20/yr by 2055 (HVAC capex compounding) — expect insurance premiums to compound above CPI over the hold.
Questions for the listing agent
- Built in 1956 — when were the roof, HVAC, electrical panel, plumbing, and water heater last replaced?
- Property tax is high relative to price — has the assessment been appealed recently, and will the sale trigger a re-assessment?
- Is there a deadline driving the sale (1031 exchange, divorce, estate, relocation)? That informs how much negotiation room exists.
- Schools are D-rated, which usually means shorter tenancies and higher turnover. Who's the typical renter profile here, and what's been the actual vacancy rate?
- The area grade is low — what's the realistic commute time and amenity access for the typical tenant pool here? Any planned neighborhood developments (good or bad) we should know about?
- What's the average days-on-market for RENTAL listings here right now (not sales)? A rising rental-DOM trend means longer vacancies and softer asking-rent achievability than the comps imply.
- What's the recent tenant-quality profile in this submarket — average credit score on applications, eviction rate, late-payment / NSF rate, and stable-employment percentage? A property-management company in the area should have these aggregated.
- How much new for-sale + rental construction is in the pipeline within 1–3 miles? Heavy new supply typically softens prices + rents 12–24 months out; constrained supply supports both.
Investment metrics
- 1% rule
- 4.79% ✓
- Cap rate
- 41.16%
- Cash-on-cash
- 124.52%
- DSCR
- 6.54
- GRM
- 1.7
CMA / ARV
No comps found within radius.
Projected returns pro-forma
-3.0% appreciation · 3.0% rent growth · sell at horizon
- IRR
- —
- Equity multiple
- 7.04×
- Total profit
- $33,808
- Equity at exit
- $2,982
- IRR
- —
- Equity multiple
- 14.79×
- Total profit
- $77,248
- Equity at exit
- $1,729
Cash invested: $5,600 (down + closing). Projections, not guarantees.
Landlord ↔ Tenant lean methodology
- Overall (STATE)
- 90 Strongly Landlord-Friendly
- State Mississippi
- 90 Strongly Landlord-Friendly · R+11
- County
- — inherits STATE
- City
- — inherits STATE
ZIP-level market 38663
- Home prices YoY
- -32.2%
- Active inventory
- 51
- Price-to-rent
- 1.7×
Monthly cashflow live
- Estimated rent
- $957 medium interval (Pro) →
- Mortgage (P&I)
- −$105
- Tax from tax record
- −$62 /mo · $742/yr
- Insurance
- −$8
- HOA
- −$0
- Vacancy / Maint / Mgmt
- −$201
- Net cashflow
- $581
Break-even live
UW: 25.0% down · 7.5% · 30yr · 1.5% tax · 5.0% vac · 8.0% maint · 8.0% mgmt
Financing live
Cash to close
- Down payment
- $5,000
- Closing costs
- $600
- Reserves months
- —
- Total cash needed
- —
Loan-product check · same deal, 3 products live
Conventional
25% down · 7.5% · 30yr
- Down + closing
- —
- Monthly P&I
- —
- Monthly cashflow
- —
- DSCR
- —
- Eligible?
- —
Personal DTI + credit; lowest rate.
DSCR
20% down · 8.5% · 30yr
- Down + closing
- —
- Monthly P&I
- —
- Monthly cashflow
- —
- DSCR
- —
- Eligible?
- —
No personal income docs; deal must DSCR.
Hard money
10% down · 12.0% · 12mo
- Down + closing
- —
- Monthly P&I
- —
- Monthly cashflow
- —
- DSCR
- —
- Eligible?
- —
Short-term bridge; refi at stabilization.
Listing history 18 events
-
2026-06-18days on market $20,000 Active 21 DOM
-
2026-06-17days on market $20,000 Active 20 DOM
-
2026-06-16days on market $20,000 Active 19 DOM
-
2026-06-15days on market $20,000 Active 18 DOM
-
2026-06-13days on market $20,000 Active 16 DOM
-
2026-06-12pricedays on market $20,000 Active 15 DOM
-
2026-06-09days on market $30,000 Active 12 DOM
-
2026-06-08days on market $30,000 Active 11 DOM
-
2026-06-07days on market $30,000 Active 10 DOM
-
2026-06-07days on market $30,000 Active 9 DOM
-
2026-06-04days on market $30,000 Active 6 DOM
-
2026-06-02days on market $30,000 Active 5 DOM
-
2026-06-01days on market $30,000 Active 4 DOM
-
2026-05-31days on market $30,000 Active 3 DOM
-
2026-05-28$30,000 Active
-
2015-11-05soldstatus 69-char remark
Show marketing remark (69 chars)
GREAT INVESTMENT PROPERTY AND OUTSTANDING LOCATION TO CITY AMENITIES!
-
2014-12-22$34,000 69-char remark
Show marketing remark (69 chars)
GREAT INVESTMENT PROPERTY AND OUTSTANDING LOCATION TO CITY AMENITIES!
-
2003-12-10soldstatus
ⓘ Source: listings_history table (triggers on properties + properties_extension) + one-shot
backfill from property_details.listing_events for pre-trigger history.
Tax reassessment forecast MS · Resets to sale price
- Current annual tax
- $742 · $62/mo
- Projected year-2 tax
- $742 · $62/mo
- Expected delta
- $0/yr ($0/mo · 0.0%)
ⓘ Screening estimate from a state-policy table — verify with the county assessor before closing.
Climate risk First Street
- Flood 1/10 Low FEMA zone X (unshaded) · 0% chance over 30 yrs
- Wildfire 5/10 Major
- Heat 6/10 Major 7 d/yr ≥109°F today · 20 d/yr by 30 yrs out
- Wind 5/10 Major 26% chance of damaging wind over 30 yrs
- Air quality 1/10 Low 0 unhealthy d/yr today · 0 by 30 yrs out
Nearby sold comps map
Loading sold comps map…
Walkable amenities ~0.75 mi
Loading nearby amenities…
Taxation est. · year 1
- Rental income
- $11,486
- − Mortgage interest
- −$1,120
- − Property taxes
- −$742
- − Insurance
- −$100
- − Repairs & maintenance
- −$919
- − Management
- −$919
- − Depreciation
- −$582
- Taxable income
- $7,104
- Est. tax owed @ 24.0%
- −$1,705
- After-tax cash flow
- $5,268/yr
For passive investors: Depreciation is non-cash, so a rental often shows a tax loss while cash-flowing — sheltering income. Rental losses are passive: they offset passive income freely, and up to $25,000/yr can offset ordinary (W-2) income if you actively participate and your MAGI is under $100k (phasing out to $0 by $150k); unused losses carry forward. On sale, claimed depreciation is recaptured at up to 25%, and gains may owe capital-gains tax (a 1031 exchange can defer both). Figures are a year-1 estimate at your 24.0% rate — not tax advice; consult a CPA.
Schools (NCES district)
- District
- South Tippah School District
- NCES district ID
- 2804110
- Math proficiency
- 43% ▼ -9.00%
- Reading proficiency
- 36% ▼ -4.00%
- Median HH income
- $36,577
- Composite
- 32.83/100
- National rank
- #5618
- State rank
- #42 of 130 in MS
Livability — Ripley
- Score
- 64/100
- State rank
- #129
- US rank
- #14136
Category grades
Schools grade is shown separately in the Schools card above.
Census & demographics
- Census place
- Ripley, MS
- Population (ZIP)
- 11,468
Population outlook (Tippah County) Hauer SSP2
- Today (2025)
- 21,864 people
- By 2030
- 21,575 · -1.3%
- By 2040
- 20,850 · -4.6%
- By 2050
- 19,953 · -8.7%
- By 2075
- 17,257 · -21.1%
- By 2100
- 13,705 · -37.3%
Race, ethnicity, and origin ACS 2023
- Neighborhood character
- Predominantly White (75%)
- Race & ethnicity
- White 75% Black 13% Two or more races 9% Hispanic / Latino 7%
- Hispanic origin (detail)
- Mexican 5%
- Common ancestry
- Slovak 2% Serbian 1% Lithuanian 1%
- Foreign-born
- 3% · Canada
- Languages at home
- 94% English-only · Spanish 5%
Political lean MEDSL · Tippah
- 2024 margin
- Solid R (+67.1) · D 16.1% · R 83.2%
- 2008→2024 swing
- -22.8pp toward R · 2008: -44.4pp · 2024: -67.1pp
- All cycles
- 2024: R+67.1 2020: R+60.6 2016: R+58.8 2012: R+48.5 2008: R+44.4
Not yet ingested
- Civics
- —
Market trends
- HPI YoY
- ▼ -61.59%
- Current HPI
- 129.4524
- Rent YoY
- —
- Metro
- —
- State GDP YoY
- —
- F500 in state
- 0
Price history
-11.8% since first listed4 events — show timeline
- 2026-05-28 Listed $30,000 MLSU
- 2015-11-05 Sold (MLS) — NEMSBD
- 2014-12-22 Listed $34,000 NEMSBD
- 2003-12-10 Sold (Public Records) — Public Records
Property tax history
+2.3%/yrLatest (2025): $742 · +0.1% YoY. Source: county tax records.
Cash-flow waterfall
monthlySold comps — $/sqft
last 12 mo · ≤1 miLoading sold comps…