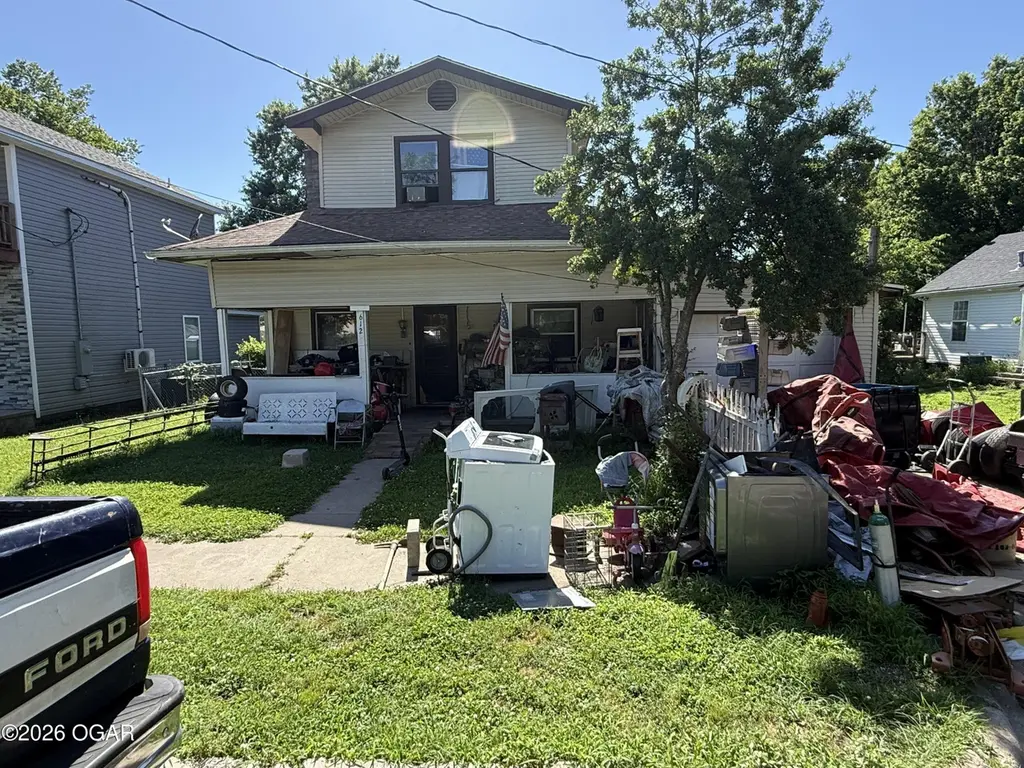
612 S Roney St · Carl Junction, MO
Flood risk 1/10 · Minimal
- FEMA flood zone
- X (unshaded)
- Chance of flooding over 30 yrs
- 0.0%
- Est. flood insurance / yr
- $507 – $1,088
Fire risk 3/10 · Minor
- Est. fire insurance / yr
- $1,054 – $1,958
Heat risk 5/10 · Moderate
- Hot days now (above 107°F)
- 7 days/yr
- Hot days in 30 yrs
- 20 days/yr
Wind risk 2/10 · Minimal
- Chance of severe wind over 30 yrs
- 2.0%
Air-quality risk 2/10 · Minimal
- Unhealthy air days now
- 1 days/yr
- Unhealthy air days in 30 yrs
- 1 days/yr
Risk factors via First Street. Map © Google.
Why this score? — see what drove the C+ grade
The composite is a weighted blend of 9 inputs, each scored 0–100. Each bar is that input's sub-score; the figure is the points it added to the 100-point composite (weight × sub-score).
- Cash flow +27.2/30.0
- DSCR +9.5/10.0
- ARV discount +7.5/15.0
- 1% rule +6.3/10.0
- Schools +4.1/10.0
- Livability +3.4/5.0
- Rent growth +2.5/5.0
- Condition / age +2.5/5.0
- Appreciation +0.0/10.0
$134,000
🖨 Deal sheet 📄 Offer letter ✓ Due diligence
Listing remarks
Investors and DIY buyers -- this is the one you've been waiting for! Located near Carl Junction schools, this 4-bedroom, 2-bathroom home offers 1,427 square feet and a solid foundation to build on. The structure is sound and the exterior has already been updated with new siding and windows, so the heavy lifting outside is done. The interior is in need of a full remodel, making it a prime opportunity to customize everything to your taste and maximize your return. Whether you're looking to flip, rent, or create your forever home at a great price point, 612 S Roney delivers the bones and the location -- you bring the vision. Properties like this don't last long, so schedule your showing today!
Key facts
- New siding
- Solid foundation
- Full remodel
Tags
Property features AI
Exterior
- Parking: Attached 1-car garage; Additional parking for 1 car
- Home design: Single-family residence (freestanding); Residential property
- Construction: Block foundation
- Exterior features: Front porch; Chain link fencing; Asphalt roof
Interior
- Bedrooms: 9 total rooms (includes bedrooms and living spaces)
- Bathrooms: 2 full bathrooms
- Interior features: Crawl space foundation; No fireplace
Neighborhood map
What this means for you Summary
Snapshot
- This is a 4-bed/2.0-bath other listed at $134k.
Deal economics
- At list price, monthly cash flow is $384 ($5k/yr) — positive.
- The deal already cash-flows at list — no discount required.
- Meets the 1% rule at list price ($2k rent vs $134k).
- Cap rate 9.7% vs local median 3.2% in Carl Junction — top-decile yield for the area; either an underpriced asset or a hidden risk that comps aren't pricing in. Stress-test before assuming the spread holds.
Location & tenants
- Location reads 68/100 on livability (#169 in MO) — a middle-class / working-renter tenant base. Strengths: cost of living A+, housing A+, crime B+; Watch: amenities F, commute F, health & safety D-.
- Carl Junction R-I (suburban): math 42% / reading 53% proficiency, ranked #57 of 324 in MO (top 18%) — families likely to look elsewhere, expect single-tenant / working-renter base with shorter leases.
- Zoned schools: Carl Junction Primary K-1 (670 students, 37% FRL); Carl Junction Jr. High (math 43% / reading 50%, grade D+, #99 of 391 statewide, top 26%, 501 students, 42% FRL).
- Market conditions: 129 active listings in the ZIP; 3 comparable units currently listed for rent nearby; rentals at typical pace (median 21d on market — plan ~3-4 weeks tenant-placement turnaround); 602 units permitted in Jasper County in 2024 (0 in 5+ unit buildings).
Forward outlook
- Local home prices are declining (-3.0%/yr); year-one equity from $926 of loan paydown is wiped out by about $4k of value loss. Plan a longer hold.
- At projected returns (-3.0% appreciation + 3.0% rent growth), your $38k cash investment doubles in ~10 years — after that, you're playing with house money.
Negotiation context
- Only 7 days on market — expect competitive offers; lowballing is unlikely to land.
Risks & watch-outs
- Watch-outs: built in 1930 — expect roof / HVAC / electrical / plumbing capex.
- Climate carrying-cost: extreme-heat days projected 7→20/yr by 2055 (HVAC capex compounding) — expect insurance premiums to compound above CPI over the hold.
Questions for the listing agent
- Built in 1930 — when were the roof, HVAC, electrical panel, plumbing, and water heater last replaced?
- Is there a deadline driving the sale (1031 exchange, divorce, estate, relocation)? That informs how much negotiation room exists.
- What's the average days-on-market for RENTAL listings here right now (not sales)? A rising rental-DOM trend means longer vacancies and softer asking-rent achievability than the comps imply.
- What's the recent tenant-quality profile in this submarket — average credit score on applications, eviction rate, late-payment / NSF rate, and stable-employment percentage? A property-management company in the area should have these aggregated.
- How much new for-sale + rental construction is in the pipeline within 1–3 miles? Heavy new supply typically softens prices + rents 12–24 months out; constrained supply supports both.
Investment metrics
- 1% rule
- 1.13% ✓
- Cap rate
- 9.73%
- Cash-on-cash
- 12.28%
- DSCR
- 1.55
- GRM
- 7.4
CMA / ARV
No comps found within radius.
Projected returns pro-forma
-3.0% appreciation · 3.0% rent growth · sell at horizon
- IRR
- 1.9%
- Equity multiple
- 1.07×
- Total profit
- $2,697
- Equity at exit
- $19,980
- IRR
- 11.4%
- Equity multiple
- 1.90×
- Total profit
- $33,645
- Equity at exit
- $11,586
Cash invested: $37,520 (down + closing). Projections, not guarantees.
Landlord ↔ Tenant lean methodology
- Overall (STATE)
- 81 Strongly Landlord-Friendly
- State Missouri
- 81 Strongly Landlord-Friendly · R+10
- County
- — inherits STATE
- City
- — inherits STATE
ZIP-level market 64834
- Home prices YoY
- -13.2%
- Active inventory
- 129
- Price-to-rent
- 7.4×
Monthly cashflow live
- Estimated rent
- $1,510 medium interval (Pro) →
- Mortgage (P&I)
- −$703
- Tax from tax record
- −$50 /mo · $605/yr
- Insurance
- −$56
- HOA
- −$0
- Vacancy / Maint / Mgmt
- −$317
- Net cashflow
- $384
Break-even live
UW: 25.0% down · 7.5% · 30yr · 1.5% tax · 5.0% vac · 8.0% maint · 8.0% mgmt
Financing live
Cash to close
- Down payment
- $33,500
- Closing costs
- $4,020
- Reserves months
- —
- Total cash needed
- —
Loan-product check · same deal, 3 products live
Conventional
25% down · 7.5% · 30yr
- Down + closing
- —
- Monthly P&I
- —
- Monthly cashflow
- —
- DSCR
- —
- Eligible?
- —
Personal DTI + credit; lowest rate.
DSCR
20% down · 8.5% · 30yr
- Down + closing
- —
- Monthly P&I
- —
- Monthly cashflow
- —
- DSCR
- —
- Eligible?
- —
No personal income docs; deal must DSCR.
Hard money
10% down · 12.0% · 12mo
- Down + closing
- —
- Monthly P&I
- —
- Monthly cashflow
- —
- DSCR
- —
- Eligible?
- —
Short-term bridge; refi at stabilization.
Rent comps 3 comps
| Address | Beds | Baths | Sqft | Rent | $/sqft | DOM | Units | Dist |
|---|---|---|---|---|---|---|---|---|
| 1004 Southgate CIR Carl Junction, MO | 3.0 | 2.0 | 1550 | $1,595 | $1.03 | 21d | 1 | 0.35mi |
| 623 Valley View St Carl Junction, MO | 3.0 | 2.0 | 1008 | $1,350 | $1.34 | 21d | 1 | 0.54mi |
| 702 Nicholas Ln Carl Junction, MO | 4.0 | 2.0 | 1450 | $1,500 | $1.03 | 43d | 1 | 0.90mi |
Listing history 7 events
-
2026-06-19days on market $134,000 Active 7 DOM
-
2026-06-18days on market $134,000 Active 6 DOM
-
2026-06-17days on market $134,000 Active 5 DOM
-
2026-06-16days on market $134,000 Active 4 DOM
-
2026-06-15days on market $134,000 Active 3 DOM
-
2026-06-13remarks 699-char remark
-
2026-06-13$134,000 Active 1 DOM
ⓘ Source: listings_history table (triggers on properties + properties_extension) + one-shot
backfill from property_details.listing_events for pre-trigger history.
Tax reassessment forecast MO · Resets to sale price
- Current annual tax
- $605 · $50/mo
- Projected year-2 tax
- $1,300 · $108/mo
- Expected delta
- +$694/yr (+$58/mo · 114.7%)
ⓘ Screening estimate from a state-policy table — verify with the county assessor before closing.
Climate risk First Street
- Flood 1/10 Low FEMA zone X (unshaded) · 0% chance over 30 yrs
- Wildfire 3/10 Moderate
- Heat 5/10 Major 7 d/yr ≥107°F today · 20 d/yr by 30 yrs out
- Wind 2/10 Low 2% chance of damaging wind over 30 yrs
- Air quality 2/10 Low 1 unhealthy d/yr today · 1 by 30 yrs out
Nearby sold comps map
Loading sold comps map…
Walkable amenities ~0.75 mi
Loading nearby amenities…
Taxation est. · year 1
- Rental income
- $18,122
- − Mortgage interest
- −$7,506
- − Property taxes
- −$605
- − Insurance
- −$670
- − Repairs & maintenance
- −$1,450
- − Management
- −$1,450
- − Depreciation
- −$3,898
- Taxable income
- $2,543
- Est. tax owed @ 24.0%
- −$610
- After-tax cash flow
- $3,998/yr
For passive investors: Depreciation is non-cash, so a rental often shows a tax loss while cash-flowing — sheltering income. Rental losses are passive: they offset passive income freely, and up to $25,000/yr can offset ordinary (W-2) income if you actively participate and your MAGI is under $100k (phasing out to $0 by $150k); unused losses carry forward. On sale, claimed depreciation is recaptured at up to 25%, and gains may owe capital-gains tax (a 1031 exchange can defer both). Figures are a year-1 estimate at your 24.0% rate — not tax advice; consult a CPA.
Schools (NCES district)
- District
- Carl Junction R-I
- NCES district ID
- 2907350
- Math proficiency
- 42% ▲ 1.00%
- Reading proficiency
- 53% ▬ 0.00%
- Median HH income
- $53,866
- Composite
- 41.04/100
- National rank
- #3580
- State rank
- #57 of 324 in MO
Livability — Carl Junction
- Score
- 68/100
- State rank
- #169
- US rank
- #9146
Category grades
Schools grade is shown separately in the Schools card above.
Census & demographics
- Census place
- Carl Junction, MO
- City population
- 10,476
- Population (ZIP)
- 10,476
Population outlook (Jasper County) Hauer SSP2
- Today (2025)
- 120,033 people
- By 2030
- 120,091 · +0.0%
- By 2040
- 119,297 · -0.6%
- By 2050
- 117,705 · -1.9%
- By 2075
- 110,402 · -8.0%
- By 2100
- 99,719 · -16.9%
Race, ethnicity, and origin ACS 2023
- Neighborhood character
- Predominantly White (90%)
- Race & ethnicity
- White 90% Two or more races 5% Hispanic / Latino 3%
- Common ancestry
- Lithuanian 4% Italian 4% Slovak 3%
- Foreign-born
- 2% · Canada, South Korea
- Languages at home
- 96% English-only · Spanish 3% French/Haitian/Cajun 1%
Political lean MEDSL · Jasper
- 2024 margin
- Solid R (+46.8) · D 25.9% · R 72.7% · Other 1.4%
- 2008→2024 swing
- -13.6pp toward R · 2008: -33.2pp · 2024: -46.8pp
- All cycles
- 2024: R+46.8 2020: R+46.2 2016: R+50.8 2012: R+41.0 2008: R+33.2
Not yet ingested
- Civics
- —
Market trends
- HPI YoY
- ▼ -38.68%
- Current HPI
- 255.1864
- Rent YoY
- —
- Metro
- —
- State GDP YoY
- ▲ 1.84%
- F500 in state
- 20
Industry mix (Fortune 500 HQ in MO)
| Industry | F500 HQs | Revenue |
|---|---|---|
| Healthcare | 1 | $163B |
|
||
| Insurance | 1 | $21B |
|
||
| Industrial Technology | 1 | $17B |
|
||
| Retail | 1 | $16B |
|
||
| Industrial Distribution | 1 | $10B |
|
||
| Utilities | 1 | $9B |
|
||
Price history
2 events — show timeline
- 2026-06-12 Listed $134,000 OGAR
- 2003-06-27 Sold (Public Records) — Public Records
Property tax history
+7.5%/yrLatest (2025): $605 · +11.1% YoY. Source: county tax records.
Cash-flow waterfall
monthlySold comps — $/sqft
last 12 mo · ≤1 miLoading sold comps…