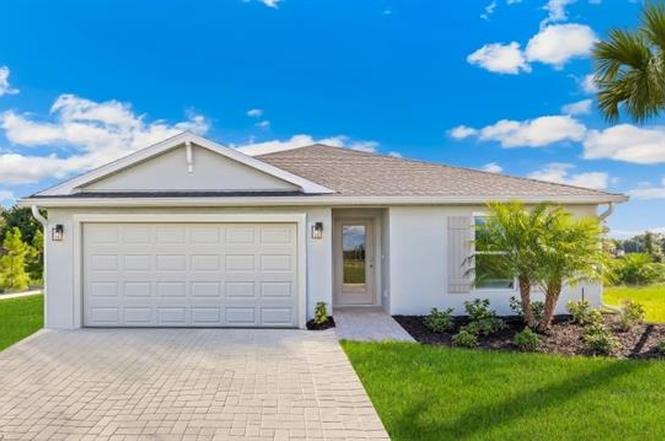
8003 Mangrove Cir · Port LaBelle, FL
Flood risk 1/10 · Minimal
- FEMA flood zone
- X (unshaded)
- Chance of flooding over 30 yrs
- 0.0%
- Est. flood insurance / yr
- $507 – $1,088
Fire risk 4/10 · Minor
- Est. fire insurance / yr
- $947 – $1,759
Heat risk 9/10 · Severe
- Hot days now (above 108°F)
- 7 days/yr
- Hot days in 30 yrs
- 26 days/yr
Wind risk 10/10 · Severe
- Chance of severe wind over 30 yrs
- 99.0%
Air-quality risk 2/10 · Minimal
- Unhealthy air days now
- 2 days/yr
- Unhealthy air days in 30 yrs
- 2 days/yr
Risk factors via First Street. Map © Google.
Why this score? — see what drove the D grade
The composite is a weighted blend of 9 inputs, each scored 0–100. Each bar is that input's sub-score; the figure is the points it added to the 100-point composite (weight × sub-score).
- Appreciation +10.0/10.0
- Cash flow +8.1/30.0
- ARV discount +7.5/15.0
- Schools +3.1/10.0
- Livability +3.1/5.0
- 1% rule +2.5/10.0
- Rent growth +2.5/5.0
- Condition / age +2.5/5.0
- DSCR +2.1/10.0
$299,999
🖨 Deal sheet 📄 Offer letter ✓ Due diligence
Listing remarks
Under Construction. Brand new concrete block smart home by America’s Builder!! The Freeport is our 4/2/2 1499 Square Feet under air, Open Concept/split bedroom plan, that maximizes the use of space, making it feel incredibly Larger than it appears. This open concept Home comes with IMPACT WINDOWS, as standard, Revwood plank flooring, Quartz counters throughout, all Stainless-Steel kitchen appliances, Storm Shutters and the latest Smart Home technology with a smart thermostat, smart door lock, video doorbell, smart garage controller and more. We also provide your homesite fully sodded and landscaped with sprinklers. Your wonderfully open and inviting kitchen with bar stool seating, and
Key facts
- Quartz counters
- Storm shutters
- Smart thermostat
Tags
Property features AI
Finance
- Other: Property listed as new construction; Lot is regular-shaped with developer-provided dimensions; Lot area approximately 0.23 acres; Paved road access; Developer/community: Port LaBelle
- HOA & community: No HOA maintenance or amenities; Community is non-gated (see remarks)
Exterior
- Parking: Attached 2-car garage; Paved driveway
- Security: Impact-resistant windows
- Utilities: Central water; Septic sewer; Cable available; Electric service (central)
- Home design: Single-family residential; 1-story ranch; Rear exposure faces northeast
- Construction: Concrete block construction; Stucco exterior finish; Shingle roof; Built in 2026
- Exterior features: Room for a pool; Automatic sprinkler system; Shutters (manual)
Interior
- Kitchen: Dishwasher; Range; Self-cleaning oven; Microwave; Refrigerator/ice maker; Pantry
- Bedrooms: 4 bedrooms (split bedroom plan)
- Flooring: Laminate flooring
- Bathrooms: 2 full bathrooms; Master bathroom with shower only
- Heating & cooling: Central electric heat; Central electric cooling
- Interior features: Cable prewire; Smoke detectors; Walk-in closet; Window coverings; Pantry; Dining area (living); Laundry in residence; Open porch/lanai; Home automation; Water treatment (owned); Unfurnished; Great room floor plan; Split bedroom layout; 7 total rooms
- Laundry & utility: Washer/dryer hookup; Laundry located inside residence; Auto garage door
Neighborhood map
What this means for you Summary
Snapshot
- This is a 4-bed/2.0-bath land listed at $300k.
Deal economics
- At list price, monthly cash flow is $-295 ($-4k/yr) — negative.
- To cash-flow at today's rent, offer at most $257k (14.2% below list).
- To meet the 1% rule (rent ≥ 1% of price), the offer needs to be $225k (25.0% below list).
- Recommended offer: $225k (25.0% below list) — sets the bar for 1% rule.
Location & tenants
- Location reads 62/100 on livability (#750 in FL) — a middle-class / working-renter tenant base. Strengths: cost of living A+, housing A+; Watch: schools F, amenities F, commute F.
- Hendry (town): math 35% / reading 40% proficiency, ranked #65 of 73 in FL (top 89%) — families likely to look elsewhere, expect single-tenant / working-renter base with shorter leases; 75% free/reduced lunch — lower-income household profile, screen leases tightly.
- Market conditions: 942 active listings in the ZIP; 20 comparable units currently listed for rent nearby; rentals at typical pace (median 16d on market — plan ~3-4 weeks tenant-placement turnaround); 557 units permitted in Hendry County in 2024 (45 in 5+ unit buildings).
- At $2,251/mo this rent would consume 47% of the median local household income ($57k/yr) (locally 498% of renters already pay >50% of income on rent) — very limited rent-growth headroom before tenants either downsize or default.
Forward outlook
- In year one you build about $32k of equity ($2k loan paydown + $30k appreciation (10.0% local appreciation)).
- Hendry County population projected to shrink 7% by 2050 — rents likely to lag national; underwrite the cash flow, not the appreciation.
- By year 2, paydown + projected appreciation supports a ~$52k cash-out refi (75% LTV) — recoverable capital for the next deal without selling this one.
Negotiation context
- It's been on market 96 days — a 9% lower offer ($273k) is reasonable based on typical stale-listing flexibility.
- 2 sale attempts with the ask held roughly flat each time — persistent listings suggest the price (not the market) is what's stuck; bring a comps-based counter.
- Current owner paid $19k; list at $300k implies a 1479% gain — meaningful room to come down on a strong offer.
Risks & watch-outs
- Climate carrying-cost: severe wind risk, 99% chance of damaging wind over 30y; extreme-heat days projected 7→26/yr by 2055 (HVAC capex compounding) — expect insurance premiums to compound above CPI over the hold.
Questions for the listing agent
- What do current leases actually rent for vs. the listed asking? Can we see a recent rent roll and the last 12 months of T-12 income?
- It's been on market 96 days. Have you received any prior offers? Is the seller open to a 25% concession, seller financing, or rate buy-down credit?
- Why hasn't it sold? Are there any deal-killer items the seller is aware of (foundation, flood, title, zoning, code violations)?
- Is there a deadline driving the sale (1031 exchange, divorce, estate, relocation)? That informs how much negotiation room exists.
- Schools are F-rated, which usually means shorter tenancies and higher turnover. Who's the typical renter profile here, and what's been the actual vacancy rate?
- The area grade is low — what's the realistic commute time and amenity access for the typical tenant pool here? Any planned neighborhood developments (good or bad) we should know about?
- What's the average days-on-market for RENTAL listings here right now (not sales)? A rising rental-DOM trend means longer vacancies and softer asking-rent achievability than the comps imply.
- What's the recent tenant-quality profile in this submarket — average credit score on applications, eviction rate, late-payment / NSF rate, and stable-employment percentage? A property-management company in the area should have these aggregated.
- How much new for-sale + rental construction is in the pipeline within 1–3 miles? Heavy new supply typically softens prices + rents 12–24 months out; constrained supply supports both.
Investment metrics
- 1% rule
- 0.75% ✗
- Cap rate
- 5.11%
- Cash-on-cash
- -4.22%
- DSCR
- 0.81
- GRM
- 11.1
CMA / ARV
No comps found within radius.
Projected returns pro-forma
10.0% appreciation · 3.0% rent growth · sell at horizon
- IRR
- 21.3%
- Equity multiple
- 2.72×
- Total profit
- $144,622
- Equity at exit
- $270,263
- IRR
- 19.3%
- Equity multiple
- 6.25×
- Total profit
- $440,739
- Equity at exit
- $582,832
Cash invested: $84,000 (down + closing). Projections, not guarantees.
Landlord ↔ Tenant lean methodology
- Overall (STATE)
- 87 Strongly Landlord-Friendly
- State Florida
- 87 Strongly Landlord-Friendly · R+3
- County
- — inherits STATE
- City
- — inherits STATE
ZIP-level market 33935
- Home prices YoY
- 16.3%
- Active inventory
- 942
- Price-to-rent
- 11.1×
Monthly cashflow live
- Estimated rent
- $2,251 high interval (Pro) →
- Mortgage (P&I)
- −$1,573
- Tax est. 1.5%
- −$375 /mo · $4,500/yr
- Insurance
- −$125
- HOA
- −$0
- Vacancy / Maint / Mgmt
- −$473
- Net cashflow
- $-295
Break-even live
UW: 25.0% down · 7.5% · 30yr · 1.5% tax · 5.0% vac · 8.0% maint · 8.0% mgmt
Financing live
Cash to close
- Down payment
- $75,000
- Closing costs
- $9,000
- Reserves months
- —
- Total cash needed
- —
Loan-product check · same deal, 3 products live
Conventional
25% down · 7.5% · 30yr
- Down + closing
- —
- Monthly P&I
- —
- Monthly cashflow
- —
- DSCR
- —
- Eligible?
- —
Personal DTI + credit; lowest rate.
DSCR
20% down · 8.5% · 30yr
- Down + closing
- —
- Monthly P&I
- —
- Monthly cashflow
- —
- DSCR
- —
- Eligible?
- —
No personal income docs; deal must DSCR.
Hard money
10% down · 12.0% · 12mo
- Down + closing
- —
- Monthly P&I
- —
- Monthly cashflow
- —
- DSCR
- —
- Eligible?
- —
Short-term bridge; refi at stabilization.
Rent comps 20 comps
| Address | Beds | Baths | Sqft | Rent | $/sqft | DOM | Units | Dist |
|---|---|---|---|---|---|---|---|---|
| 8033 Melody Cir Labelle, FL | 3.0 | 2.0 | 1215 | $1,999 | $1.65 | 16d | 1 | 0.13mi |
| 8049 Memory Cir Labelle, FL | 4.0 | 2.0 | 1686 | $2,000 | $1.19 | 3d | 1 | 0.37mi |
| 9007 Meadow Cir Labelle, FL | 4.0 | 2.0 | 1500 | $1,695 | $1.13 | 3d | 1 | 0.41mi |
| 8030 Olive Cir Labelle, FL | 4.0 | 2.0 | 1499 | $2,300 | $1.53 | 3d | 1 | 0.48mi |
| 8004 Spice Ct Labelle, FL | 3.0 | 2.0 | 1292 | $2,000 | $1.55 | 19d | 1 | 0.50mi |
| 9035 W Crow Cir Labelle, FL | 4.0 | 2.0 | 1530 | $1,950 | $1.27 | 3d | 1 | 0.51mi |
| 8002 Vega Ct Labelle, FL | 3.0 | 2.0 | 1389 | $1,900 | $1.37 | 23d | 1 | 0.61mi |
| 9012 S Indio Ct Labelle, FL | 3.0 | 2.0 | 1400 | $2,100 | $1.50 | 19d | 1 | 0.69mi |
| 9011 Penny Cir Labelle, FL | 3.0 | 2.0 | 1731 | $2,400 | $1.39 | 23d | 1 | 0.78mi |
| 9018 W Justice Cir Labelle, FL | 4.0 | 2.0 | 1499 | $1,950 | $1.30 | 12d | 1 | 0.78mi |
| 9001 Penny Cir Labelle, FL | 3.0 | 2.0 | 1472 | $2,300 | $1.56 | 23d | 1 | 0.82mi |
| 9001 Penny Cir Labelle, FL | 3.0 | 2.0 | 1472 | $2,300 | $1.56 | 16d | 1 | 0.82mi |
| 7061 Tide Cir Labelle, FL | 4.0 | 2.0 | 1500 | $1,695 | $1.13 | 23d | 1 | 0.89mi |
| 6210 Forest Ct Labelle, FL | 3.0 | 2.5 | 1503 | $2,200 | $1.46 | 23d | 1 | 1.03mi |
| 9013 Ike Ct Labelle, FL | 3.0 | 2.0 | 1367 | $2,100 | $1.54 | 3d | 1 | 1.05mi |
| 7016 Palpano Cir Labelle, FL | 3.0 | 2.5 | 1507 | $2,100 | $1.39 | 16d | 1 | 1.15mi |
| 1535 Argosy Rd Labelle, FL | 4.0 | 2.0 | 1836 | $1,675 | $0.91 | 3d | 1 | 1.18mi |
| 1064 Calumet Rd Labelle, FL | 3.0 | 2.5 | 1503 | $2,200 | $1.46 | 23d | 1 | 1.22mi |
| 6018 Acorn Cir Labelle, FL | 3.0 | 2.0 | 1408 | $2,200 | $1.56 | 16d | 1 | 1.40mi |
| 7038 Lotus Cir Labelle, FL | 4.0 | 3.0 | 1680 | $2,200 | $1.31 | 16d | 1 | 1.48mi |
Listing history 7 events
-
2026-04-28status Pending
-
2026-03-26price $299,999
-
2026-02-01historical
-
2026-01-22$306,985 Active
-
2025-09-10soldstatus $19,000
-
2025-02-11$24,900 Active
-
2013-04-09soldstatus $3,000
ⓘ Source: listings_history table (triggers on properties + properties_extension) + one-shot
backfill from property_details.listing_events for pre-trigger history.
Climate risk First Street
- Flood 1/10 Low FEMA zone X (unshaded) · 0% chance over 30 yrs
- Wildfire 4/10 Moderate
- Heat 9/10 Extreme 7 d/yr ≥108°F today · 26 d/yr by 30 yrs out
- Wind 10/10 Extreme 99% chance of damaging wind over 30 yrs
- Air quality 2/10 Low 2 unhealthy d/yr today · 2 by 30 yrs out
Nearby sold comps map
Loading sold comps map…
Walkable amenities ~0.75 mi
Loading nearby amenities…
Taxation est. · year 1
- Rental income
- $27,009
- − Mortgage interest
- −$16,805
- − Property taxes
- −$4,500
- − Insurance
- −$1,500
- − Repairs & maintenance
- −$2,161
- − Management
- −$2,161
- − Depreciation
- −$8,727
- Taxable loss
- −$8,845
- Est. tax savings @ 24.0%
- +$2,123
- After-tax cash flow
- $-1,419/yr
For passive investors: Depreciation is non-cash, so a rental often shows a tax loss while cash-flowing — sheltering income. Rental losses are passive: they offset passive income freely, and up to $25,000/yr can offset ordinary (W-2) income if you actively participate and your MAGI is under $100k (phasing out to $0 by $150k); unused losses carry forward. On sale, claimed depreciation is recaptured at up to 25%, and gains may owe capital-gains tax (a 1031 exchange can defer both). Figures are a year-1 estimate at your 24.0% rate — not tax advice; consult a CPA.
Schools (NCES district)
- District
- Hendry
- NCES district ID
- 1200780
- Math proficiency
- 35% ▼ -11.00%
- Reading proficiency
- 40% ▼ -4.00%
- Median HH income
- $37,043
- Composite
- 31.16/100
- National rank
- #6054
- State rank
- #65 of 73 in FL
Livability — Port LaBelle
- Score
- 62/100
- State rank
- #750
- US rank
- #16264
Category grades
Schools grade is shown separately in the Schools card above.
Census & demographics
- Census place
- Port LaBelle, FL
- County
- Hendry County · 23,186 people
- Metro
- Clewiston, FL
- Population (ZIP)
- 23,186
- Household income
- $57,009
- Rent vs Own
- Severe rent burden
- 498.0
Population outlook (Hendry County) Hauer SSP2
- Today (2025)
- 38,866 people
- By 2030
- 38,558 · -0.8%
- By 2040
- 37,743 · -2.9%
- By 2050
- 36,117 · -7.1%
- By 2075
- 30,070 · -22.6%
- By 2100
- 21,966 · -43.5%
Race, ethnicity, and origin ACS 2023
- Neighborhood character
- Majority Hispanic (56%)
- Race & ethnicity
- Hispanic / Latino 56% White 39% Two or more races 21% Black 2% Native American 2%
- Hispanic origin (detail)
- Mexican 40% Puerto Rican 3% Cuban 5%
- Common ancestry
- Lithuanian 2% Serbian 2% Slovak 1%
- Foreign-born
- 27% · Canada, Jamaica
- Languages at home
- 50% English-only · Spanish 50%
Political lean MEDSL · Hendry
- 2024 margin
- Solid R (+38.3) · D 30.4% · R 68.7%
- 2008→2024 swing
- -31.1pp toward R · 2008: -7.2pp · 2024: -38.3pp
- All cycles
- 2024: R+38.3 2020: R+23.0 2016: R+14.2 2012: R+5.9 2008: R+7.2
Not yet ingested
- Civics
- —
Market trends
- HPI YoY
- ▲ 75.20%
- Current HPI
- 537.4928
- Rent YoY
- —
- Metro
- Clewiston, FL
- State GDP YoY
- ▲ 3.28%
- F500 in state
- 36
Industry mix (Fortune 500 HQ in FL)
| Industry | F500 HQs | Revenue |
|---|---|---|
| Industrial Technology | 2 | $29B |
|
||
| Insurance | 2 | $17B |
|
||
| Retail | 1 | $60B |
|
||
| Technology Distribution | 1 | $58B |
|
||
| Homebuilding | 1 | $35B |
|
||
| Technology Manufacturing | 1 | $35B |
|
||
Price history
+9900.0% since first listed7 events — show timeline
- 2026-04-28 Pending — NAPLESMLS
- 2026-03-26 Price Changed $299,999 NAPLESMLS
- 2026-02-01 Listing Removed — Stellar MLS as Distributed by MLS Grid
- 2026-01-22 Listed $306,985 NAPLESMLS
- 2025-09-10 Sold (Public Records) $19,000 Public Records
- 2025-02-11 Listed $24,900 Stellar MLS as Distributed by MLS Grid
- 2013-04-09 Sold (Public Records) $3,000 Public Records
Property tax history
+9.2%/yrLatest (2025): $371 · +21.8% YoY. Source: county tax records.
Cash-flow waterfall
monthlySold comps — $/sqft
last 12 mo · ≤1 miLoading sold comps…