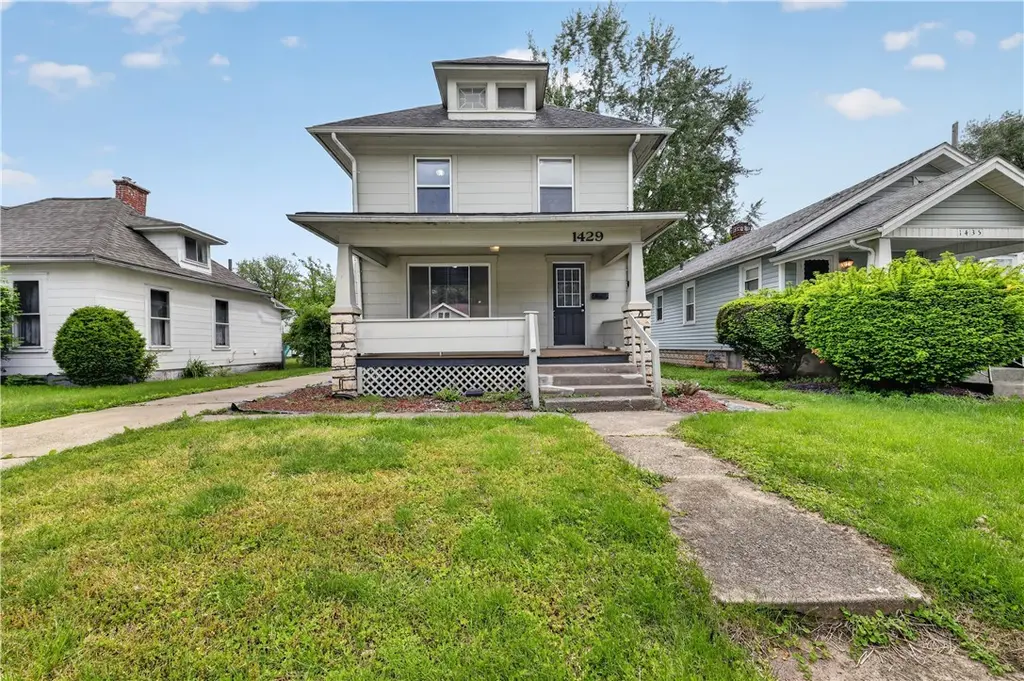
1429 Broadway St · Springfield, OH
Flood risk 1/10 · Minimal
- FEMA flood zone
- X (unshaded)
- Chance of flooding over 30 yrs
- 0.0%
- Est. flood insurance / yr
- $473 – $860
Fire risk 1/10 · Minimal
- Est. fire insurance / yr
- $713 – $1,323
Heat risk 4/10 · Minor
- Hot days now (above 100°F)
- 7 days/yr
- Hot days in 30 yrs
- 18 days/yr
Wind risk 2/10 · Minimal
- Chance of severe wind over 30 yrs
- —
Air-quality risk 3/10 · Minor
- Unhealthy air days now
- 2 days/yr
- Unhealthy air days in 30 yrs
- 3 days/yr
Risk factors via First Street. Map © Google.
Why this score? — see what drove the C+ grade
The composite is a weighted blend of 9 inputs, each scored 0–100. Each bar is that input's sub-score; the figure is the points it added to the 100-point composite (weight × sub-score).
- Cash flow +26.5/30.0
- ARV discount +10.2/15.0
- DSCR +9.0/10.0
- 1% rule +6.5/10.0
- Livability +2.8/5.0
- Rent growth +2.5/5.0
- Condition / age +2.5/5.0
- Schools +1.9/10.0
- Appreciation +0.0/10.0
$129,900
🖨 Deal sheet (PDF) 📄 Offer letter ✓ Due diligence
Listing remarks MLS
Great oppurtunity on this bank owned property. Please rely on your own inspections, information provided is not warranted. Bank addendums will apply.
Key facts
- Ample outdoor space
- Generous lot
- Desirable location
Tags
Property features AI
Finance
- Financial info: Offered for sale
Exterior
- Parking: Attached one-car garage
- Home design: Two-story wood siding home
- Construction: Wood siding construction
- Exterior features: Residential zoning; Lot approximately 42 x 150 ft (0.1446 acres)
Interior
- Bathrooms: One full bathroom
- Heating & cooling: Natural gas heating; Central air conditioning
- Interior features: Full basement
Neighborhood map
What this means for you Summary
Snapshot
- This is a 3-bed/1.0-bath single-family listed at $130k.
Deal economics
- At list price, monthly cash flow is $344 ($4k/yr) — positive.
- The deal already cash-flows at list — no discount required.
- Meets the 1% rule at list price ($1k rent vs $130k).
- Cap rate 9.5% vs local median 4.7% in Springfield — top-decile yield for the area; either an underpriced asset or a hidden risk that comps aren't pricing in. Stress-test before assuming the spread holds.
Location & tenants
- Location reads 56/100 on livability (#1,108 in OH) — a working-class tenant base; expect higher turnover. Strengths: cost of living A+, housing A+; Watch: crime F, amenities F, commute F.
- Springfield City School District (urban): math 20% / reading 27% proficiency, ranked #616 of 656 in OH (top 94%) — low school quality limits family demand, transient renter base, plan for 1-2y turnover; 75% free/reduced lunch — lower-income household profile, screen leases tightly.
- Zoned schools: Snyder Park Elementary School (math 27% / reading 32%, grade F, #1,158 of 1,584 statewide, top 75%, 301 students, 0% FRL); Roosevelt Middle School (math 30% / reading 36%, grade F, #553 of 654 statewide, top 85%, 397 students, 0% FRL); Springfield High School (math 17% / reading 31%, grade F, #665 of 781 statewide, top 85%, 1,516 students, 0% FRL) — zoned schools average 0% FRL vs 75% district-wide (75 pts lower); this property's tenant base skews higher-income than the district average.
- Market conditions: 94 active listings in the ZIP; 8 comparable units currently listed for rent nearby; rentals leasing fast (median 14d on market — plan ~1-2 weeks tenant-placement turnaround); 232 units permitted in Clark County in 2024 (116 in 5+ unit buildings).
Forward outlook
- Local home prices are declining (-3.0%/yr); year-one equity from $898 of loan paydown is wiped out by about $4k of value loss. Plan a longer hold.
- Clark County population projected at -16% by 2050 — secular population decline; favor cash flow + early exit over multi-decade hold.
- At projected returns (-3.0% appreciation + 3.0% rent growth), your $36k cash investment doubles in ~10 years — after that, you're playing with house money.
Negotiation context
- Only 10 days on market — expect competitive offers; lowballing is unlikely to land.
- 3 sale attempts since 18y ago; this cycle's ask is 6395% above the opening price — seller raised mid-cycle; expect resistance to lowballs.
Risks & watch-outs
- Watch-outs: built in 1906 — expect roof / HVAC / electrical / plumbing capex.
Questions for the listing agent
- Built in 1906 — when were the roof, HVAC, electrical panel, plumbing, and water heater last replaced?
- Is there a deadline driving the sale (1031 exchange, divorce, estate, relocation)? That informs how much negotiation room exists.
- Crime grade is F in this area — have there been break-ins, vandalism, or insurance claims at this property in the last 3 years? What carrier currently insures it and at what premium?
- What's the average days-on-market for RENTAL listings here right now (not sales)? A rising rental-DOM trend means longer vacancies and softer asking-rent achievability than the comps imply.
- What's the recent tenant-quality profile in this submarket — average credit score on applications, eviction rate, late-payment / NSF rate, and stable-employment percentage? A property-management company in the area should have these aggregated.
- How much new for-sale + rental construction is in the pipeline within 1–3 miles? Heavy new supply typically softens prices + rents 12–24 months out; constrained supply supports both.
Investment metrics
- 1% rule
- 1.15% ✓
- Cap rate
- 9.47%
- Cash-on-cash
- 11.34%
- DSCR
- 1.50
- GRM
- 7.3
CMA / ARV
- ARV (median comp)
- $138,253
- List price
- $129,900
- Delta
- -6.04%
- Verdict
- FAIR
- Comps
- 20 within 1.0 mi
Show comp detail 12 sales within ~0.75 mi
| Address | Dist | Beds/Ba | Sqft | Sold | Price | $/sf | Match |
|---|---|---|---|---|---|---|---|
| 306 N Bechtle Ave | 0.08mi | 3/1.0 | 1,288 (+4%) | 2mo | $169,900 | $132 | 89 |
| 452 N Bechtle Ave | 0.11mi | 3/1.0 | 1,124 (-10%) | 1mo | $85,000 | $76 | 78 |
| 1323 Broadway St | 0.11mi | 2/1.0 (-1) | 1,356 (+9%) | 5mo | $140,000 | $103 | 70 |
| 908 Cedar St | 0.46mi | 3/1.0 | 1,255 (+1%) | 10mo | $60,000 | $48 | 69 |
| 1701 W Jefferson St | 0.58mi | 2/1.0 (-1) | 1,230 (-1%) | 1mo | $115,000 | $93 | 65 |
| 1530 W Main St | 0.30mi | 3/2.0 | 1,182 (-5%) | 10mo | $55,000 | $47 | 65 |
| 1504 W High St | 0.37mi | 2/2.0 (-1) | 1,120 (-10%) | 3mo | $61,000 | $54 | 55 |
| 1951 Harshman Blvd | 0.45mi | 2/1.0 (-1) | 1,394 (+12%) | 1mo | $175,000 | $126 | 53 |
| 2162 Broadway St | 0.61mi | 3/1.0 | 1,105 (-11%) | 2mo | $168,000 | $152 | 51 |
| 1207 W Pleasant St | 0.74mi | 2/1.0 (-1) | 1,328 (+7%) | 4mo | $134,900 | $102 | 46 |
| 1933 Maiden Ln | 0.42mi | 3/2.0 | 1,418 (+14%) | 9mo | $165,000 | $116 | 46 |
| 1212 W Pleasant St | 0.71mi | 4/2.0 (+1) | 1,300 (+4%) | 6mo | $164,000 | $126 | 45 |
Match score weights: distance 35% · size 25% · config 20% · recency 20%. Top-matched comps best support the ARV.
Projected returns pro-forma
-3.0% appreciation · 3.0% rent growth · sell at horizon
- IRR
- 0.6%
- Equity multiple
- 1.02×
- Total profit
- $831
- Equity at exit
- $19,369
- IRR
- 10.2%
- Equity multiple
- 1.79×
- Total profit
- $28,849
- Equity at exit
- $11,231
Cash invested: $36,372 (down + closing). Projections, not guarantees.
Landlord ↔ Tenant lean methodology
- Overall (STATE)
- 73 Landlord-Friendly
- State Ohio
- 73 Landlord-Friendly · R+6
- County
- — inherits STATE
- City
- — inherits STATE
ZIP-level market 45504
- Active inventory
- 94
- Price-to-rent
- 7.3×
Monthly cashflow live
- Estimated rent
- $1,489 high interval (Pro) →
- Mortgage (P&I)
- −$681
- Tax from tax record
- −$97 /mo · $1,167/yr
- Insurance
- −$54
- HOA
- −$0
- Lot rent
- −$0
- Vacancy / Maint / Mgmt
- −$313
- Net cashflow
- $344
Break-even live
Sensitivity live
| Price | -10% $417 | -5% $381 | +0% $344 | +5% $307 | +10% $270 |
|---|---|---|---|---|---|
| Rent | -10% $226 | -5% $285 | +0% $344 | +5% $403 | +10% $461 |
| Rate | -1.0pp $409 | -0.5pp $377 | base $344 | +0.5pp $310 | +1.0pp $276 |
UW: 25.0% down · 7.5% · 30yr · 1.5% tax · 5.0% vac · 8.0% maint · 8.0% mgmt
Financing live
Cash to close
- Down payment
- $32,475
- Closing costs
- $3,897
- Reserves months
- —
- Total cash needed
- —
Loan-product check · same deal, 3 products live
Conventional
25% down · 7.5% · 30yr
- Down + closing
- —
- Monthly P&I
- —
- Monthly cashflow
- —
- DSCR
- —
- Eligible?
- —
Personal DTI + credit; lowest rate.
DSCR
20% down · 8.5% · 30yr
- Down + closing
- —
- Monthly P&I
- —
- Monthly cashflow
- —
- DSCR
- —
- Eligible?
- —
No personal income docs; deal must DSCR.
Hard money
10% down · 12.0% · 12mo
- Down + closing
- —
- Monthly P&I
- —
- Monthly cashflow
- —
- DSCR
- —
- Eligible?
- —
Short-term bridge; refi at stabilization.
Rent comps 8 comps
| Address | Beds | Baths | Sqft | Rent | $/sqft | DOM | Units | Dist |
|---|---|---|---|---|---|---|---|---|
| 307 N Isabella St Unit 309 Springfield, OH | 3.0 | 1.5 | 1300 | $1,400 | $1.08 | 5d | 1 | 0.12mi |
| 826 Grant St Springfield, OH | 2.0 | 1.0 | 950 | $1,200 | $1.26 | 5d | 1 | 0.49mi |
| 220 S Yellow Springs St Springfield, OH | 4.0 | 2.0 | 1456 | $1,645 | $1.13 | 25d | 1 | 0.92mi |
| 302 S Yellow Springs St Springfield, OH | 4.0 | 2.0 | 1456 | $1,845 | $1.27 | 13d | 1 | 0.93mi |
| 523 W Mulberry St Springfield, OH | 4.0 | 2.0 | 1456 | $1,825 | $1.25 | 13d | 1 | 0.99mi |
| 524 W Pleasant St Springfield, OH | 4.0 | 2.0 | 1456 | $1,645 | $1.13 | 13d | 1 | 1.01mi |
| 306 S Plum St Springfield, OH | 4.0 | 2.0 | 1352 | $1,700 | $1.26 | 46d | 1 | 1.06mi |
| 545 W Grand Ave Springfield, OH | 4.0 | 2.0 | 1456 | $1,595 | $1.10 | 5d | 1 | 1.34mi |
Listing history 12 events
-
2026-05-18status Pending 1144-char remark
-
2026-05-17$2,000
-
2026-05-08$129,900 Active 1144-char remark
-
2024-12-12soldstatus $1,802,000
-
2017-09-11soldstatus $190,000
-
2008-10-29soldstatus $16,000 149-char remark
Show marketing remark (149 chars)
Great oppurtunity on this bank owned property. Please rely on your own inspections, information provided is not warranted. Bank addendums will apply.
-
2008-09-05$26,000 149-char remark
Show marketing remark (149 chars)
Great oppurtunity on this bank owned property. Please rely on your own inspections, information provided is not warranted. Bank addendums will apply.
-
2005-04-04soldstatus $55,000
-
2003-10-01soldstatus $73,000
-
2000-02-25soldstatus $79,000
-
1995-03-30soldstatus $59,900
-
1986-02-26soldstatus $25,000
ⓘ Source: listings_history table (triggers on properties + properties_extension) + one-shot
backfill from property_details.listing_events for pre-trigger history.
Tax reassessment forecast OH · Partial reset (capped growth)
- Current annual tax
- $1,167 · $97/mo
- Projected year-2 tax
- $1,597 · $133/mo
- Expected delta
- +$430/yr (+$36/mo · 36.8%)
ⓘ Screening estimate from a state-policy table — verify with the county assessor before closing.
Climate risk First Street
- Flood 1/10 Low FEMA zone X (unshaded) · 0% chance over 30 yrs
- Wildfire 1/10 Low
- Heat 4/10 Moderate 7 d/yr ≥100°F today · 18 d/yr by 30 yrs out
- Wind 2/10 Low
- Air quality 3/10 Moderate 2 unhealthy d/yr today · 3 by 30 yrs out
Nearby sold comps map
Loading sold comps map…
Walkable amenities ~0.75 mi
Loading nearby amenities…
Taxation est. · year 1
- Rental income
- $17,869
- − Mortgage interest
- −$7,276
- − Property taxes
- −$1,167
- − Insurance
- −$650
- − Repairs & maintenance
- −$1,430
- − Management
- −$1,430
- − Depreciation
- −$3,779
- Taxable income
- $2,138
- Est. tax owed @ 24.0%
- −$513
- After-tax cash flow
- $3,613/yr
For passive investors: Depreciation is non-cash, so a rental often shows a tax loss while cash-flowing — sheltering income. Rental losses are passive: they offset passive income freely, and up to $25,000/yr can offset ordinary (W-2) income if you actively participate and your MAGI is under $100k (phasing out to $0 by $150k); unused losses carry forward. On sale, claimed depreciation is recaptured at up to 25%, and gains may owe capital-gains tax (a 1031 exchange can defer both). Figures are a year-1 estimate at your 24.0% rate — not tax advice; consult a CPA.
Schools (NCES district)
- District
- Springfield City School District
- NCES district ID
- 3904481
- Math proficiency
- 20% ▼ -16.00%
- Reading proficiency
- 27% ▼ -12.00%
- Median HH income
- $32,541
- Composite
- 19.12/100
- National rank
- #8834
- State rank
- #616 of 656 in OH
Livability — Springfield
- Score
- 56/100
- State rank
- #1108
- US rank
- #22551
Category grades
Schools grade is shown separately in the Schools card above.
Census & demographics
- Census place
- Springfield, OH
- County
- Clark · 134,280 people
- City population
- 33,261
- Metro
- Springfield, OH
- Population (ZIP)
- 16,654
- Household income
- $67,334
- Rent vs Own
- Severe rent burden
- 6.4
Population outlook (Clark County) Hauer SSP2
- Today (2025)
- 130,703 people
- By 2030
- 126,952 · -2.9%
- By 2040
- 118,344 · -9.5%
- By 2050
- 109,590 · -16.2%
- By 2075
- 89,464 · -31.6%
- By 2100
- 68,810 · -47.4%
Race, ethnicity, and origin ACS 2023
- Neighborhood character
- Predominantly White (85%)
- Race & ethnicity
- White 85% Two or more races 7% Black 5% Hispanic / Latino 3%
- Common ancestry
- Lithuanian 2% Slovak 2% Italian 1%
- Foreign-born
- 2% · Canada, China
- Languages at home
- 97% English-only · Spanish 2%
Political lean MEDSL · Clark
- 2024 margin
- Strong R (+29.5) · D 34.8% · R 64.3%
- 2008→2024 swing
- -27.0pp toward R · 2008: -2.5pp · 2024: -29.5pp
- All cycles
- 2024: R+29.5 2020: R+23.3 2016: R+19.5 2012: R+1.8 2008: R+2.5
Not yet ingested
- Civics
- —
Market trends
- HPI YoY
- ▼ -138.72%
- Current HPI
- 240.7049
- Rent YoY
- —
- Metro
- —
- State GDP YoY
- ▲ 1.98%
- F500 in state
- 48
Industry mix (Fortune 500 HQ in OH)
| Industry | F500 HQs | Revenue |
|---|---|---|
| Insurance | 3 | $145B |
|
||
| Industrial Machinery | 3 | $49B |
|
||
| Financial Services | 3 | $24B |
|
||
| Consumer Goods | 2 | $93B |
|
||
| Aerospace / Defense | 2 | $47B |
|
||
| Utilities | 2 | $33B |
|
||
Price history
-92.0% since first listed13 events — show timeline
- 2026-05-19 Rental Removed $2,000 TURBOTENANT
- 2026-05-18 Pending — Dayton MLS
- 2026-05-17 Listed for Rent $2,000 TURBOTENANT
- 2026-05-08 Listed $129,900 Dayton MLS
- 2024-12-12 Sold (Public Records) $1,802,000 Public Records
- 2017-09-11 Sold (Public Records) $190,000 Public Records
- 2008-10-29 Sold (MLS) $16,000 WRIST
- 2008-09-05 Listed $26,000 WRIST
- 2005-04-04 Sold (Public Records) $55,000 Public Records
- 2003-10-01 Sold (Public Records) $73,000 Public Records
- 2000-02-25 Sold (Public Records) $79,000 Public Records
- 1995-03-30 Sold (Public Records) $59,900 Public Records
- 1986-02-26 Sold (Public Records) $25,000 Public Records
Property tax history
+2.7%/yrLatest (2025): $1,167 · +33.3% YoY. Source: county tax records.
Cash-flow waterfall
monthlySold comps — $/sqft
last 12 mo · ≤1 miLoading sold comps…