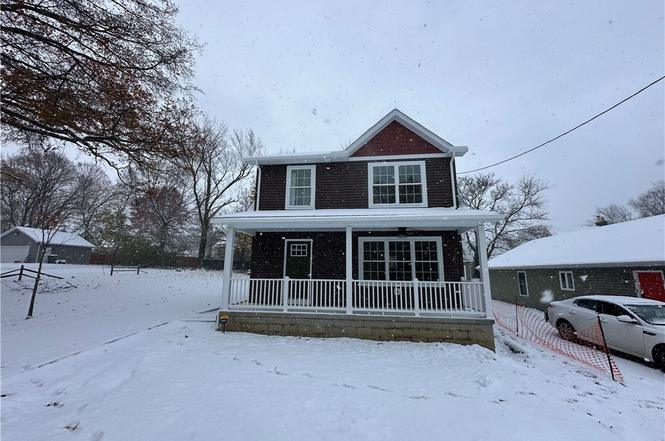
753 Mineral Springs Ave · Youngstown, OH
Flood risk 1/10 · Minimal
- FEMA flood zone
- X (unshaded)
- Chance of flooding over 30 yrs
- 0.0%
- Est. flood insurance / yr
- $507 – $1,088
Fire risk 1/10 · Minimal
- Est. fire insurance / yr
- $713 – $1,323
Heat risk 3/10 · Minor
- Hot days now (above 96°F)
- 7 days/yr
- Hot days in 30 yrs
- 17 days/yr
Wind risk 1/10 · Minimal
- Chance of severe wind over 30 yrs
- —
Air-quality risk 2/10 · Minimal
- Unhealthy air days now
- 1 days/yr
- Unhealthy air days in 30 yrs
- 2 days/yr
Risk factors via First Street. Map © Google.
Why this score? — see what drove the F grade
The composite is a weighted blend of 9 inputs, each scored 0–100. Each bar is that input's sub-score; the figure is the points it added to the 100-point composite (weight × sub-score).
- Cash flow +7.7/30.0
- ARV discount +7.5/15.0
- Livability +4.0/5.0
- Rent growth +2.5/5.0
- Condition / age +2.5/5.0
- 1% rule +2.3/10.0
- DSCR +1.8/10.0
- Schools +0.9/10.0
- Appreciation +0.0/10.0
$170,000
🖨 Deal sheet 📄 Offer letter ✓ Due diligence
Listing remarks
This newly constructed 1,409 square foot, three-bedroom, two-bathroom home is located just a block away from beautiful Mill Creek Park. The home features a sprawling front porch, spacious open concept living, dining, and kitchen area, first-floor laundry, and a detached two-car garage. The full basement is both waterproofed and insulated. Refrigerator, range, microwave range hood, dishwasher, washer, and dryer are included with purchase. This home has a 15-year 100% property tax abatement on all improvements and is eligible for the City of Youngstown's $10,000 down payment assistance program. Purchase of this home is limited to income-eligible buyers who commit to owning and occupying the h
Key facts
- Front porch
- First floor laundry
- Insulated basement
Tags
Neighborhood map
What this means for you Summary
Snapshot
- This is a 3-bed/2.0-bath land listed at $170k.
Deal economics
- At list price, monthly cash flow is $-199 ($-2k/yr) — negative.
- To cash-flow at today's rent, offer at most $141k (17.0% below list).
- To meet the 1% rule (rent ≥ 1% of price), the offer needs to be $124k (27.3% below list).
- Recommended offer: $124k (27.3% below list) — sets the bar for 1% rule.
- Cap rate 4.9% vs local median 7.0% in Youngstown — below-typical yield; the buyer is paying a premium for something (appreciation thesis, condition, location) that the cap rate doesn't capture.
Location & tenants
- Location reads 81/100 on livability (#99 in OH, #1,506 nationally) — a professional / high-income tenant draw. Strengths: amenities A+, commute A+, cost of living A+; Watch: crime F, employment F.
- Youngstown City (urban): math 8% / reading 17% proficiency, ranked #649 of 656 in OH (top 99%) — low school quality limits family demand, transient renter base, plan for 1-2y turnover; 88% free/reduced lunch — lower-income household profile, screen leases tightly.
- Market conditions: 73 active listings in the ZIP; 4 comparable units currently listed for rent nearby; rentals at typical pace (median 21d on market — plan ~3-4 weeks tenant-placement turnaround); 147 units permitted in Mahoning County in 2024 (0 in 5+ unit buildings).
Forward outlook
- Local home prices are declining (-3.0%/yr); year-one equity from $1k of loan paydown is wiped out by about $5k of value loss. Plan a longer hold.
- Mahoning County population projected at -14% by 2050 — secular population decline; favor cash flow + early exit over multi-decade hold.
Negotiation context
- It's been on market 142 days — a 12% lower offer ($150k) is reasonable based on typical stale-listing flexibility.
Questions for the listing agent
- What do current leases actually rent for vs. the listed asking? Can we see a recent rent roll and the last 12 months of T-12 income?
- It's been on market 142 days. Have you received any prior offers? Is the seller open to a 27% concession, seller financing, or rate buy-down credit?
- Why hasn't it sold? Are there any deal-killer items the seller is aware of (foundation, flood, title, zoning, code violations)?
- Is there a deadline driving the sale (1031 exchange, divorce, estate, relocation)? That informs how much negotiation room exists.
- Crime grade is F in this area — have there been break-ins, vandalism, or insurance claims at this property in the last 3 years? What carrier currently insures it and at what premium?
- The area grade is low — what's the realistic commute time and amenity access for the typical tenant pool here? Any planned neighborhood developments (good or bad) we should know about?
- What's the average days-on-market for RENTAL listings here right now (not sales)? A rising rental-DOM trend means longer vacancies and softer asking-rent achievability than the comps imply.
- What's the recent tenant-quality profile in this submarket — average credit score on applications, eviction rate, late-payment / NSF rate, and stable-employment percentage? A property-management company in the area should have these aggregated.
- How much new for-sale + rental construction is in the pipeline within 1–3 miles? Heavy new supply typically softens prices + rents 12–24 months out; constrained supply supports both.
Investment metrics
- 1% rule
- 0.73% ✗
- Cap rate
- 4.89%
- Cash-on-cash
- -5.02%
- DSCR
- 0.78
- GRM
- 11.5
CMA / ARV
No comps found within radius.
Projected returns pro-forma
-3.0% appreciation · 3.0% rent growth · sell at horizon
- IRR
- -24.8%
- Equity multiple
- 0.16×
- Total profit
- $-40,212
- Equity at exit
- $25,348
- IRR
- -20.6%
- Equity multiple
- -0.08×
- Total profit
- $-51,271
- Equity at exit
- $14,698
Cash invested: $47,600 (down + closing). Projections, not guarantees.
Landlord ↔ Tenant lean methodology
- Overall (STATE)
- 73 Landlord-Friendly
- State Ohio
- 73 Landlord-Friendly · R+6
- County
- — inherits STATE
- City
- — inherits STATE
ZIP-level market 44511
- Home prices YoY
- -12.6%
- Active inventory
- 73
- Price-to-rent
- 11.5×
Monthly cashflow live
- Estimated rent
- $1,235 medium interval (Pro) →
- Mortgage (P&I)
- −$891
- Tax est. 1.5%
- −$212 /mo · $2,550/yr
- Insurance
- −$71
- HOA
- −$0
- Vacancy / Maint / Mgmt
- −$259
- Net cashflow
- $-199
Break-even live
UW: 25.0% down · 7.5% · 30yr · 1.5% tax · 5.0% vac · 8.0% maint · 8.0% mgmt
Financing live
Cash to close
- Down payment
- $42,500
- Closing costs
- $5,100
- Reserves months
- —
- Total cash needed
- —
Loan-product check · same deal, 3 products live
Conventional
25% down · 7.5% · 30yr
- Down + closing
- —
- Monthly P&I
- —
- Monthly cashflow
- —
- DSCR
- —
- Eligible?
- —
Personal DTI + credit; lowest rate.
DSCR
20% down · 8.5% · 30yr
- Down + closing
- —
- Monthly P&I
- —
- Monthly cashflow
- —
- DSCR
- —
- Eligible?
- —
No personal income docs; deal must DSCR.
Hard money
10% down · 12.0% · 12mo
- Down + closing
- —
- Monthly P&I
- —
- Monthly cashflow
- —
- DSCR
- —
- Eligible?
- —
Short-term bridge; refi at stabilization.
Rent comps 4 comps
| Address | Beds | Baths | Sqft | Rent | $/sqft | DOM | Units | Dist |
|---|---|---|---|---|---|---|---|---|
| 546 Breaden St Youngstown, OH | 3.0 | 1.0 | 1430 | $1,080 | $0.76 | 21d | 1 | 0.75mi |
| 913 Hawthorne St Youngstown, OH | 3.0 | 1.0 | 1198 | $1,080 | $0.90 | 21d | 1 | 1.14mi |
| 911 Hawthorne St Youngstown, OH | 3.0 | 1.0 | 1198 | $1,080 | $0.90 | 21d | 1 | 1.15mi |
| 3639 Shelby Rd Youngstown, OH | 2.0 | 1.0 | 936 | $1,200 | $1.28 | 21d | 1 | 1.36mi |
Listing history 5 events
-
2026-04-02status Pending
-
2025-11-12soldstatus $269,200
-
2025-11-11$170,000 Active
-
1998-03-05soldstatus $18,900
-
1991-12-17soldstatus $9,500
ⓘ Source: listings_history table (triggers on properties + properties_extension) + one-shot
backfill from property_details.listing_events for pre-trigger history.
Climate risk First Street
- Flood 1/10 Low FEMA zone X (unshaded) · 0% chance over 30 yrs
- Wildfire 1/10 Low
- Heat 3/10 Moderate 7 d/yr ≥96°F today · 17 d/yr by 30 yrs out
- Wind 1/10 Low
- Air quality 2/10 Low 1 unhealthy d/yr today · 2 by 30 yrs out
Nearby sold comps map
Loading sold comps map…
Walkable amenities ~0.75 mi
Loading nearby amenities…
Taxation est. · year 1
- Rental income
- $14,821
- − Mortgage interest
- −$9,523
- − Property taxes
- −$2,550
- − Insurance
- −$850
- − Repairs & maintenance
- −$1,186
- − Management
- −$1,186
- − Depreciation
- −$4,945
- Taxable loss
- −$5,419
- Est. tax savings @ 24.0%
- +$1,300
- After-tax cash flow
- $-1,089/yr
For passive investors: Depreciation is non-cash, so a rental often shows a tax loss while cash-flowing — sheltering income. Rental losses are passive: they offset passive income freely, and up to $25,000/yr can offset ordinary (W-2) income if you actively participate and your MAGI is under $100k (phasing out to $0 by $150k); unused losses carry forward. On sale, claimed depreciation is recaptured at up to 25%, and gains may owe capital-gains tax (a 1031 exchange can defer both). Figures are a year-1 estimate at your 24.0% rate — not tax advice; consult a CPA.
Schools (NCES district)
- District
- Youngstown City
- NCES district ID
- 3904516
- Math proficiency
- 8% ▼ -15.00%
- Reading proficiency
- 17% ▼ -10.00%
- Median HH income
- $25,257
- Composite
- 9.29/100
- National rank
- #9858
- State rank
- #649 of 656 in OH
Livability — Youngstown
- Score
- 81/100
- State rank
- #99
- US rank
- #1506
Category grades
Schools grade is shown separately in the Schools card above.
Census & demographics
- Census place
- Youngstown, OH
- County
- Mahoning County · 84,956 people
- City population
- 28,503
- Metro
- Youngstown-Warren-Boardman, OH-PA
- Population (ZIP)
- 18,909
- Household income
- $56,880
- Rent vs Own
- Severe rent burden
- 336.0
Population outlook (Mahoning County) Hauer SSP2
- Today (2025)
- 223,932 people
- By 2030
- 218,387 · -2.5%
- By 2040
- 205,367 · -8.3%
- By 2050
- 193,606 · -13.5%
- By 2075
- 173,694 · -22.4%
- By 2100
- 151,147 · -32.5%
Race, ethnicity, and origin ACS 2023
- Neighborhood character
- Majority White (64%)
- Race & ethnicity
- White 64% Black 23% Hispanic / Latino 8% Two or more races 7% Native American 1%
- Hispanic origin (detail)
- Mexican 2% Puerto Rican 4%
- Common ancestry
- Romanian 5% Lithuanian 1% Slovak 1%
- Foreign-born
- 1% · Canada
- Languages at home
- 96% English-only · Spanish 3%
Political lean MEDSL · Mahoning
- 2024 margin
- Lean R (+9.4) · D 44.9% · R 54.4%
- 2008→2024 swing
- -36.1pp toward R · 2008: 26.6pp · 2024: -9.4pp
- All cycles
- 2024: R+9.4 2020: R+1.9 2016: D+3.0 2012: D+27.7 2008: D+26.6
Not yet ingested
- Civics
- —
Market trends
- HPI YoY
- ▼ -40.81%
- Current HPI
- 283.9088
- Rent YoY
- —
- Metro
- Youngstown-Warren-Boardman, OH-PA
- State GDP YoY
- ▲ 1.98%
- F500 in state
- 48
Industry mix (Fortune 500 HQ in OH)
| Industry | F500 HQs | Revenue |
|---|---|---|
| Insurance | 3 | $145B |
|
||
| Industrial Machinery | 3 | $49B |
|
||
| Financial Services | 3 | $24B |
|
||
| Consumer Goods | 2 | $93B |
|
||
| Aerospace / Defense | 2 | $47B |
|
||
| Utilities | 2 | $33B |
|
||
Price history
+2733.7% since first listed5 events — show timeline
- 2026-04-02 Pending — MLSNOW
- 2025-11-12 Sold (Public Records) $269,200 Public Records
- 2025-11-11 Listed $170,000 MLSNOW
- 1998-03-05 Sold (Public Records) $18,900 Public Records
- 1991-12-17 Sold (Public Records) $9,500 Public Records
Property tax history
+2.9%/yrLatest (2025): $29 · -11.9% YoY. Source: county tax records.
Cash-flow waterfall
monthlySold comps — $/sqft
last 12 mo · ≤1 miLoading sold comps…