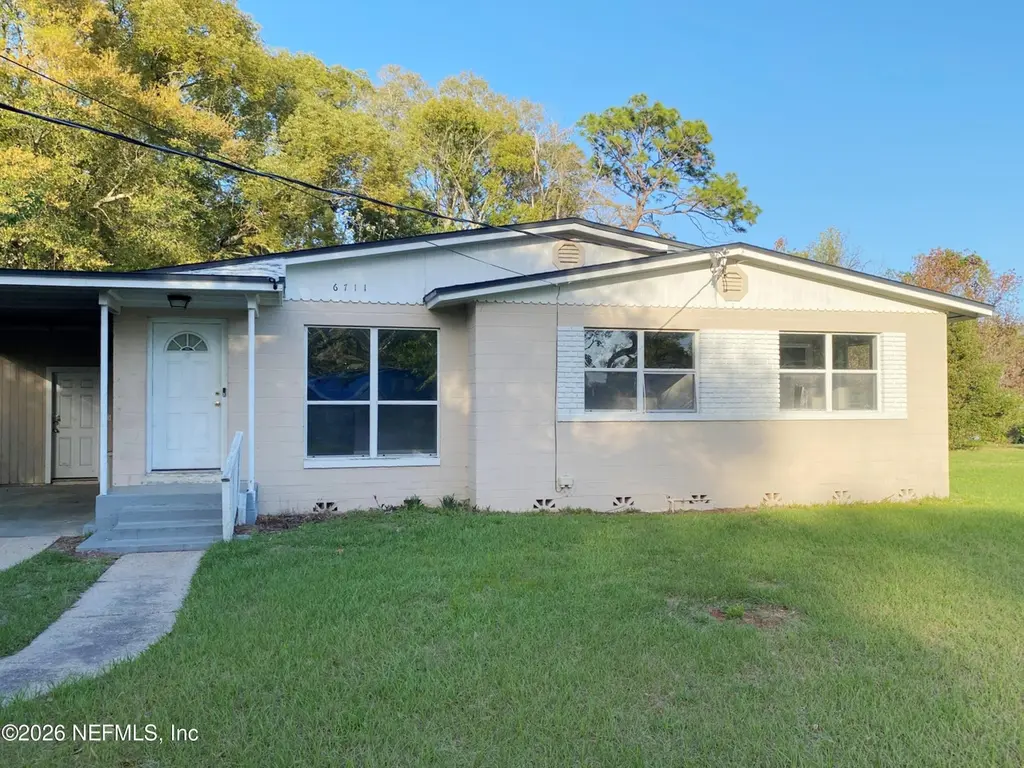
6711 Cavalier Rd · Jacksonville, FL
Flood risk 5/10 · Moderate
- FEMA flood zone
- X (unshaded)
- Chance of flooding over 30 yrs
- 0.24%
- Est. flood insurance / yr
- $507 – $1,088
Fire risk 1/10 · Minimal
- Est. fire insurance / yr
- $947 – $1,759
Heat risk 9/10 · Severe
- Hot days now (above 107°F)
- 7 days/yr
- Hot days in 30 yrs
- 20 days/yr
Wind risk 9/10 · Severe
- Chance of severe wind over 30 yrs
- 99.0%
Air-quality risk 4/10 · Minor
- Unhealthy air days now
- 6 days/yr
- Unhealthy air days in 30 yrs
- 6 days/yr
Risk factors via First Street. Map © Google.
Why this score? — see what drove the B grade
The composite is a weighted blend of 9 inputs, each scored 0–100. Each bar is that input's sub-score; the figure is the points it added to the 100-point composite (weight × sub-score).
- Cash flow +26.5/30.0
- ARV discount +15.0/15.0
- DSCR +9.0/10.0
- 1% rule +8.0/10.0
- Livability +4.2/5.0
- Schools +3.9/10.0
- Condition / age +2.5/5.0
- Rent growth +2.2/5.0
- Appreciation +0.0/10.0
$119,900
🖨 Deal sheet 📄 Offer letter ✓ Due diligence
Listing remarks MLS
***Home comes with Cinch Home Warranty***This newly renovated home has everything you expect in a renovation. White cabinets, new floors and fresh clean everything! After a few final touches this home can be all yours!
Key facts
- 0.32 acre lot
- Parking
- Built 1956
Property features AI
Finance
- HOA & community: Not a senior community
Exterior
- Parking: Attached carport (1 space)
- Utilities: Utilities listed as Other
- Home design: Single family residence; One level
- Construction: Concrete construction; Shingle roof
- Exterior features: Cleared lot; Asphalt road access; Private pool: No
Interior
- Bedrooms: 4 bedrooms
- Bathrooms: 2 full bathrooms
- Heating & cooling: Has cooling (type listed as Other)
- Interior features: Laundry area located in the carport; No built-in appliances included
- Laundry & utility: Laundry hookups located in the carport
Neighborhood map
What this means for you Summary
Snapshot
- This is a 3-bed/2.0-bath single-family listed at $120k.
Deal economics
- At list price, monthly cash flow is $317 ($4k/yr) — positive.
- The deal already cash-flows at list — no discount required.
- Meets the 1% rule at list price ($2k rent vs $120k).
- Cap rate 9.5% vs local median 4.0% in Jacksonville — top-decile yield for the area; either an underpriced asset or a hidden risk that comps aren't pricing in. Stress-test before assuming the spread holds.
Location & tenants
- Location reads 83/100 on livability (#50 in FL, #911 nationally) — a professional / high-income tenant draw. Strengths: amenities A+, commute A+, housing A+.
- Duval (urban): math 46% / reading 45% proficiency, ranked #48 of 73 in FL (top 66%) — families likely to look elsewhere, expect single-tenant / working-renter base with shorter leases.
- Market conditions: Rents soft (-1.4%/yr); 291 active listings in the ZIP; 40 comparable units currently listed for rent nearby; rentals at typical pace (median 24d on market — plan ~3-4 weeks tenant-placement turnaround); lower-income renter base — watch delinquency; 6,503 units permitted in Duval County in 2024 (1,131 in 5+ unit buildings).
- At $1,561/mo this rent would consume 45% of the median local household income ($41k/yr) (locally 1765% of renters already pay >50% of income on rent) — very limited rent-growth headroom before tenants either downsize or default.
Forward outlook
- Local home prices are declining (-3.0%/yr); year-one equity from $829 of loan paydown is wiped out by about $4k of value loss. Plan a longer hold.
- Duval County population projected at +19% by 2050 — long-run rental-demand tailwind backs the buy-and-hold thesis.
Negotiation context
- Only 14 days on market — expect competitive offers; lowballing is unlikely to land.
- 5 sale attempts since 13y ago with the ask held roughly flat each time — persistent listings suggest the price (not the market) is what's stuck; bring a comps-based counter.
Risks & watch-outs
- Watch-outs: built in 1956 — expect roof / HVAC / electrical / plumbing capex.
- Climate carrying-cost: moderate flood risk; severe wind risk, 99% chance of damaging wind over 30y; extreme-heat days projected 7→20/yr by 2055 (HVAC capex compounding) — expect insurance premiums to compound above CPI over the hold.
Questions for the listing agent
- Built in 1956 — when were the roof, HVAC, electrical panel, plumbing, and water heater last replaced?
- Is there a deadline driving the sale (1031 exchange, divorce, estate, relocation)? That informs how much negotiation room exists.
- Schools are B-rated — typically a magnet for longer-tenancy family renters. What's the average tenant stay here, and is there a school-zone premium baked into asking?
- What's the average days-on-market for RENTAL listings here right now (not sales)? A rising rental-DOM trend means longer vacancies and softer asking-rent achievability than the comps imply.
- What's the recent tenant-quality profile in this submarket — average credit score on applications, eviction rate, late-payment / NSF rate, and stable-employment percentage? A property-management company in the area should have these aggregated.
- How much new for-sale + rental construction is in the pipeline within 1–3 miles? Heavy new supply typically softens prices + rents 12–24 months out; constrained supply supports both.
Investment metrics
- 1% rule
- 1.30% ✓
- Cap rate
- 9.46%
- Cash-on-cash
- 11.31%
- DSCR
- 1.50
- GRM
- 6.4
CMA / ARV
- ARV (on-the-fly)
- $223,344
- Comps found
- 12
Show comp detail 12 sales within ~0.75 mi
| Address | Dist | Beds/Ba | Sqft | Sold | Price | $/sf | Match |
|---|---|---|---|---|---|---|---|
| 6926 Corday Rd | 0.22mi | 4/2.0 (+1) | 1,456 (-6%) | 3mo | $200,000 | $137 | 72 |
| 2839 Palmdale St | 0.37mi | 4/2.0 (+1) | 1,625 (+5%) | 4mo | $275,000 | $169 | 66 |
| 2137 Burgoyne Dr | 0.67mi | 3/2.0 | 1,560 (+1%) | 3mo | $225,000 | $144 | 65 |
| 6818 Cartier Cir | 0.21mi | 3/2.0 | 1,365 (-12%) | 9mo | $257,000 | $188 | 63 |
| 2718 Parkrus Ln | 0.53mi | 3/2.5 | 1,560 (+1%) | 12mo | $194,900 | $125 | 63 |
| 2649 Sandra Ln | 0.33mi | 3/1.5 | 1,368 (-12%) | 0mo | $145,000 | $106 | 62 |
| 3506 Hickorynut St | 0.66mi | 3/2.0 | 1,488 (-4%) | 8mo | $169,000 | $114 | 56 |
| 6669 Restlawn Dr | 0.27mi | 4/2.0 (+1) | 1,754 (+13%) | 8mo | $122,500 | $70 | 54 |
| 8023 Almar Pl | 0.60mi | 4/2.0 (+1) | 1,406 (-9%) | 4mo | $110,000 | $78 | 48 |
| 1826 Forest Hills Rd | 0.65mi | 4/2.0 (+1) | 1,689 (+9%) | 4mo | $250,000 | $148 | 46 |
| 3430 Hickorynut St | 0.65mi | 4/2.0 (+1) | 1,368 (-12%) | 1mo | $224,900 | $164 | 44 |
| 2522 Grand St | 0.70mi | 4/2.0 (+1) | 1,760 (+14%) | 4mo | $345,000 | $196 | 36 |
Match score weights: distance 35% · size 25% · config 20% · recency 20%. Top-matched comps best support the ARV.
Projected returns pro-forma
-3.0% appreciation · 0.0% rent growth · sell at horizon
- IRR
- -3.1%
- Equity multiple
- 0.89×
- Total profit
- $-3,764
- Equity at exit
- $17,877
- IRR
- 2.6%
- Equity multiple
- 1.16×
- Total profit
- $5,321
- Equity at exit
- $10,367
Cash invested: $33,572 (down + closing). Projections, not guarantees.
Landlord ↔ Tenant lean methodology
- Overall (STATE)
- 87 Strongly Landlord-Friendly
- State Florida
- 87 Strongly Landlord-Friendly · R+3
- County
- — inherits STATE
- City
- — inherits STATE
ZIP-level market 32208
- Home prices YoY
- -33.6%
- Rents YoY
- -1.4%
- Active inventory
- 291
- Price-to-rent
- 6.4×
Monthly cashflow live
- Estimated rent
- $1,561 high interval (Pro) →
- Mortgage (P&I)
- −$629
- Tax from tax record
- −$238 /mo · $2,852/yr
- Insurance
- −$50
- HOA
- −$0
- Vacancy / Maint / Mgmt
- −$328
- Net cashflow
- $317
Break-even live
UW: 25.0% down · 7.5% · 30yr · 1.5% tax · 5.0% vac · 8.0% maint · 8.0% mgmt
Financing live
Cash to close
- Down payment
- $29,975
- Closing costs
- $3,597
- Reserves months
- —
- Total cash needed
- —
Loan-product check · same deal, 3 products live
Conventional
25% down · 7.5% · 30yr
- Down + closing
- —
- Monthly P&I
- —
- Monthly cashflow
- —
- DSCR
- —
- Eligible?
- —
Personal DTI + credit; lowest rate.
DSCR
20% down · 8.5% · 30yr
- Down + closing
- —
- Monthly P&I
- —
- Monthly cashflow
- —
- DSCR
- —
- Eligible?
- —
No personal income docs; deal must DSCR.
Hard money
10% down · 12.0% · 12mo
- Down + closing
- —
- Monthly P&I
- —
- Monthly cashflow
- —
- DSCR
- —
- Eligible?
- —
Short-term bridge; refi at stabilization.
Rent comps 40 comps
| Address | Beds | Baths | Sqft | Rent | $/sqft | DOM | Units | Dist |
|---|---|---|---|---|---|---|---|---|
| 2818 Palmdale St Jacksonville, FL | 4.0 | 2.5 | 1484 | $1,900 | $1.28 | 23d | 1 | 0.42mi |
| 8516 Bermuda Rd Jacksonville, FL | 3.0 | 2.0 | 1492 | $1,625 | $1.09 | 20d | 1 | 0.70mi |
| 3344 Soutel Dr Jacksonville, FL | 3.0 | 1.0 | 1142 | $1,325 | $1.16 | 23d | 1 | 0.71mi |
| 9148 13th Ave Jacksonville, FL | 3.0 | 1.0 | 1126 | $1,136 | $1.01 | 3d | 1 | 0.72mi |
| 3250 Soutel Dr Jacksonville, FL | 3.0 | 2.0 | 1352 | $1,525 | $1.13 | 23d | 1 | 0.72mi |
| 9141 12th Ave Jacksonville, FL | 3.0 | 2.0 | 1209 | $1,598 | $1.32 | 20d | 1 | 0.77mi |
| 3848 Soutel Dr Jacksonville, FL | 3.0 | 2.0 | 1230 | $1,541 | $1.25 | 7d | 1 | 0.79mi |
| 9032 8th Ave Jacksonville, FL | 3.0 | 2.0 | 1300 | $1,500 | $1.15 | 23d | 1 | 0.86mi |
| 7762 Lake Park Dr Jacksonville, FL | 4.0 | 2.0 | 2140 | $1,451 | $0.68 | 23d | 1 | 0.87mi |
| 8509 Addison Rd Jacksonville, FL | 4.0 | 2.0 | 1494 | $1,675 | $1.12 | 23d | 1 | 0.88mi |
| 3015 Lansdell Dr Jacksonville, FL | 3.0 | 1.0 | 1150 | $1,350 | $1.17 | 23d | 1 | 0.93mi |
| 8534 Addison Rd Jacksonville, FL | 4.0 | 2.0 | 1410 | $1,995 | $1.41 | 23d | 1 | 0.93mi |
| 9037 6th Ave Jacksonville, FL | 3.0 | 2.0 | 1156 | $1,400 | $1.21 | 23d | 1 | 0.98mi |
| 8721 4th Ave Jacksonville, FL | 3.0 | 1.5 | 1344 | $1,399 | $1.04 | 23d | 1 | 1.00mi |
| 8642 2nd Ave Jacksonville, FL | 3.0 | 2.0 | 1074 | $1,245 | $1.16 | 1d | 1 | 1.04mi |
| 8973 4th Ave Jacksonville, FL | 3.0 | 2.0 | 1230 | $1,438 | $1.17 | 14d | 1 | 1.05mi |
| 9279 6th Ave Jacksonville, FL | 3.0 | 2.0 | 1150 | $1,245 | $1.08 | 4d | 1 | 1.09mi |
| 9131 4th Ave Jacksonville, FL | 3.0 | 2.0 | 1209 | $1,496 | $1.24 | 21d | 1 | 1.11mi |
| 8918 1st Ave Jacksonville, FL | 3.0 | 2.0 | 1435 | $1,321 | $0.92 | 16d | 1 | 1.15mi |
| 5816 Paris Ave Jacksonville, FL | 4.0 | 2.0 | 1701 | $1,599 | $0.94 | 23d | 1 | 1.18mi |
| 5838 Abelia Rd Jacksonville, FL | 3.0 | 1.0 | 1135 | $1,150 | $1.01 | 23d | 1 | 1.19mi |
| 4144 Katanga Dr N Jacksonville, FL | 3.0 | 1.0 | 1114 | $1,095 | $0.98 | 23d | 1 | 1.19mi |
| 5821 Begonia Rd Jacksonville, FL | 3.0 | 2.0 | 1230 | $1,155 | $0.94 | 4d | 1 | 1.20mi |
| 5814 Begonia Rd Unit 1 Jacksonville, FL | 3.0 | 1.5 | 1500 | $1,655 | $1.10 | 23d | 1 | 1.22mi |
| 2151 Wilberforce Rd Jacksonville, FL | 3.0 | 2.0 | 1166 | $1,249 | $1.07 | 23d | 1 | 1.22mi |
| 8645 Samona Dr W Jacksonville, FL | 4.0 | 1.0 | 1196 | $1,250 | $1.05 | 23d | 1 | 1.25mi |
| 9517 Fraser Fir Ct Jacksonville, FL | 4.0 | 2.0 | 1526 | $1,745 | $1.14 | 7d | 1 | 1.25mi |
| 8910 Adams Ave Jacksonville, FL | 4.0 | 2.0 | 1250 | $1,225 | $0.98 | 2d | 1 | 1.29mi |
| 4643 Williamsburg Ave Jacksonville, FL | 3.0 | 2.0 | 1209 | $1,496 | $1.24 | 2d | 1 | 1.32mi |
| 4895 Churchill Dr Jacksonville, FL | 3.0 | 2.0 | 1303 | $1,900 | $1.46 | 23d | 1 | 1.32mi |
| 9124 Adams Ave Jacksonville, FL | 3.0 | 3.0 | 1207 | $1,800 | $1.49 | 23d | 1 | 1.34mi |
| 5903 Droad St Jacksonville, FL | 3.0 | 1.0 | 1161 | $1,400 | $1.21 | 2d | 1 | 1.36mi |
| 7927 Reid Ave Jacksonville, FL | 3.0 | 1.0 | 1055 | $1,500 | $1.42 | 23d | 1 | 1.38mi |
| 3636 Turton Ave Jacksonville, FL | 4.0 | 2.0 | 1728 | $2,100 | $1.22 | 23d | 1 | 1.38mi |
| 4910 Rhode Island Dr N Jacksonville, FL | 3.0 | 2.0 | 1300 | $1,696 | $1.30 | 23d | 1 | 1.38mi |
| 1567 Rutledge Ave Jacksonville, FL | 3.0 | 2.0 | 1050 | $1,113 | $1.06 | 23d | 1 | 1.39mi |
| 8726 Monroe Ave Jacksonville, FL | 3.0 | 2.0 | 1920 | $1,400 | $0.73 | 14d | 1 | 1.40mi |
| 5805 Christobel Ave Jacksonville, FL | 4.0 | 2.0 | 1986 | $1,800 | $0.91 | 7d | 1 | 1.42mi |
| 5568 Verbena Rd Jacksonville, FL | 4.0 | 2.5 | 1880 | $1,575 | $0.84 | 23d | 1 | 1.43mi |
| 1750 Rutledge Ave Jacksonville, FL | 3.0 | 2.0 | 1250 | $1,358 | $1.09 | 14d | 1 | 1.44mi |
Listing history 11 events
-
2026-06-16status $119,900 Pending 14 DOM
-
2026-06-15days on market $119,900 Active 14 DOM
-
2026-06-13days on market $119,900 Active 12 DOM
-
2026-06-13days on market $119,900 Active 11 DOM
-
2026-06-10days on market $119,900 Active 8 DOM
-
2026-06-08days on market $119,900 Active 7 DOM
-
2026-06-07days on market $119,900 Active 6 DOM
-
2026-06-05days on market $119,900 Active 3 DOM
-
2026-06-03days on market $119,900 Active 2 DOM
-
2026-06-02remarks 328-char remark
-
2026-06-02$119,900 Active 1 DOM
ⓘ Source: listings_history table (triggers on properties + properties_extension) + one-shot
backfill from property_details.listing_events for pre-trigger history.
Tax reassessment forecast FL · Resets to sale price
- Current annual tax
- $2,852 · $238/mo
- Projected year-2 tax
- $2,852 · $238/mo
- Expected delta
- $0/yr ($0/mo · 0.0%)
ⓘ Screening estimate from a state-policy table — verify with the county assessor before closing.
Climate risk First Street
- Flood 5/10 Major FEMA zone X (unshaded) · 24% chance over 30 yrs
- Wildfire 1/10 Low
- Heat 9/10 Extreme 7 d/yr ≥107°F today · 20 d/yr by 30 yrs out
- Wind 9/10 Extreme 99% chance of damaging wind over 30 yrs
- Air quality 4/10 Moderate 6 unhealthy d/yr today · 6 by 30 yrs out
Nearby sold comps map
Loading sold comps map…
Walkable amenities ~0.75 mi
Loading nearby amenities…
Taxation est. · year 1
- Rental income
- $18,729
- − Mortgage interest
- −$6,716
- − Property taxes
- −$2,852
- − Insurance
- −$600
- − Repairs & maintenance
- −$1,498
- − Management
- −$1,498
- − Depreciation
- −$3,488
- Taxable income
- $2,076
- Est. tax owed @ 24.0%
- −$498
- After-tax cash flow
- $3,300/yr
For passive investors: Depreciation is non-cash, so a rental often shows a tax loss while cash-flowing — sheltering income. Rental losses are passive: they offset passive income freely, and up to $25,000/yr can offset ordinary (W-2) income if you actively participate and your MAGI is under $100k (phasing out to $0 by $150k); unused losses carry forward. On sale, claimed depreciation is recaptured at up to 25%, and gains may owe capital-gains tax (a 1031 exchange can defer both). Figures are a year-1 estimate at your 24.0% rate — not tax advice; consult a CPA.
Schools (NCES district)
- District
- Duval
- NCES district ID
- 1200480
- Math proficiency
- 46% ▼ -11.00%
- Reading proficiency
- 45% ▼ -4.00%
- Median HH income
- $48,987
- Composite
- 38.97/100
- National rank
- #4076
- State rank
- #48 of 73 in FL
Livability — Jacksonville
- Score
- 83/100
- State rank
- #50
- US rank
- #911
Category grades
Schools grade is shown separately in the Schools card above.
Census & demographics
- Census place
- Jacksonville, FL
- County
- Duval County · 1,015,274 people
- City population
- 979,034
- Metro
- Jacksonville, FL
- Population (ZIP)
- 32,699
- Household income
- $41,324
- Rent vs Own
- Severe rent burden
- 1765.0
Population outlook (Duval County) Hauer SSP2
- Today (2025)
- 1,013,010 people
- By 2030
- 1,059,228 · +4.6%
- By 2040
- 1,141,439 · +12.7%
- By 2050
- 1,205,258 · +19.0%
- By 2075
- 1,324,282 · +30.7%
- By 2100
- 1,319,620 · +30.3%
Race, ethnicity, and origin ACS 2023
- Neighborhood character
- Predominantly Black (77%)
- Race & ethnicity
- Black 77% White 16% Two or more races 4% Hispanic / Latino 3%
- Common ancestry
- Italian 1%
- Foreign-born
- 2% · Canada
- Languages at home
- 97% English-only · Spanish 2%
Political lean MEDSL · Duval
- 2024 margin
- Toss-up / Even · D 48.7% · R 50.1% · Other 1.2%
- 2008→2024 swing
- +0.4pp no change · 2008: -1.9pp · 2024: -1.5pp
- All cycles
- 2024: R+1.5 2020: D+3.8 2016: R+1.5 2012: R+3.6 2008: R+1.9
Not yet ingested
- Civics
- —
Market trends
- HPI YoY
- ▼ -110.56%
- Current HPI
- 217.9706
- Rent YoY
- ▼ -1.36%
- Metro
- Jacksonville, FL
- State GDP YoY
- ▲ 3.28%
- F500 in state
- 36
Industry mix (Fortune 500 HQ in FL)
| Industry | F500 HQs | Revenue |
|---|---|---|
| Industrial Technology | 2 | $29B |
|
||
| Insurance | 2 | $17B |
|
||
| Retail | 1 | $60B |
|
||
| Technology Distribution | 1 | $58B |
|
||
| Homebuilding | 1 | $35B |
|
||
| Technology Manufacturing | 1 | $35B |
|
||
Price history
+673.5% since first listed18 events — show timeline
- 2026-06-01 Listed $119,900 realMLS
- 2023-05-17 Relisted — realMLS
- 2023-05-17 Listing Removed — realMLS
- 2023-05-06 Pending — realMLS
- 2023-03-21 Price Changed $215,000 realMLS
- 2023-02-27 Listed $225,000 realMLS
- 2022-12-09 Sold (Public Records) $145,000 Public Records
- 2022-12-08 Sold (MLS) $145,000 realMLS
- 2022-12-06 Pending — realMLS
- 2022-11-28 Contingent — realMLS
- 2022-11-21 Price Changed $150,000 realMLS
- 2022-11-01 Price Changed $164,900 realMLS
- 2022-10-16 Listed $169,900 realMLS
- 2014-05-30 Sold (Public Records) $94,900 Public Records
- 2014-05-21 Sold (MLS) $27,500 realMLS
- 2013-10-30 Listed $27,000 realMLS
- 1980-11-01 Sold (Public Records) $38,000 Public Records
- 1973-05-17 Sold (Public Records) $15,500 Public Records
Property tax history
+6.0%/yrLatest (2025): $2,852 · +11.8% YoY. Source: county tax records.
Cash-flow waterfall
monthlySold comps — $/sqft
last 12 mo · ≤1 miLoading sold comps…