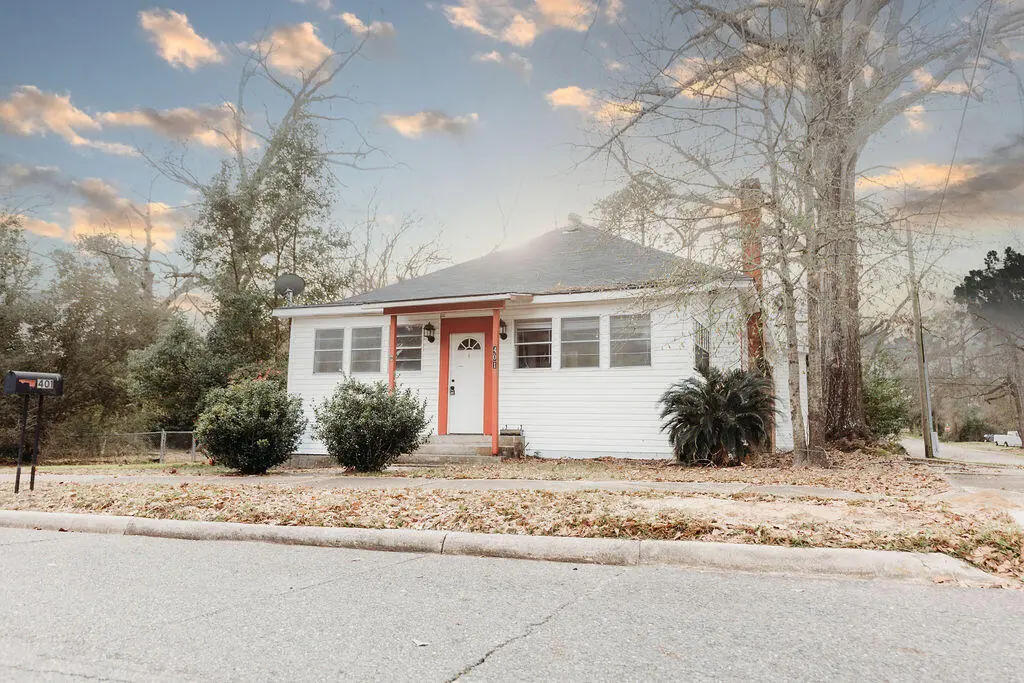
401 Bon Ami St · DeRidder, LA
Flood risk 1/10 · Minimal
- FEMA flood zone
- X (unshaded)
- Chance of flooding over 30 yrs
- 0.0%
- Est. flood insurance / yr
- $507 – $1,088
Fire risk 2/10 · Minimal
- Est. fire insurance / yr
- $1,269 – $2,357
Heat risk 8/10 · Major
- Hot days now (above 110°F)
- 7 days/yr
- Hot days in 30 yrs
- 20 days/yr
Wind risk 8/10 · Major
- Chance of severe wind over 30 yrs
- 99.0%
Air-quality risk 2/10 · Minimal
- Unhealthy air days now
- 1 days/yr
- Unhealthy air days in 30 yrs
- 1 days/yr
Risk factors via First Street. Map © Google.
Why this score? — see what drove the C grade
The composite is a weighted blend of 9 inputs, each scored 0–100. Each bar is that input's sub-score; the figure is the points it added to the 100-point composite (weight × sub-score).
- Cash flow +19.2/30.0
- ARV discount +15.0/15.0
- DSCR +6.1/10.0
- 1% rule +4.5/10.0
- Livability +3.6/5.0
- Schools +3.0/10.0
- Rent growth +2.5/5.0
- Condition / age +2.5/5.0
- Appreciation +0.0/10.0
$105,000
🖨 Deal sheet 📄 Offer letter ✓ Due diligence
Listing remarks MLS
Charming home with character and plenty of potential. A welcoming back porch leads to a large, beautiful deck and a fenced yard offering privacy and making it perfect for entertaining, gardening, or pets. Certain spaces in the home need some TLC but it has so much character and so much to offer. The cozy den with fireplace creates a warm gathering spot, and a flexible extra room that could easily serve as a fourth bedroom. The property spans three city lots, providing extra space and options, and includes a second extra room for an office, hobby area, or playroom. This home is Ideal for buyers looking to add personal updates while retaining its original character.
Key facts
- Large deck
- Cozy den
- Fenced yard
Tags
Neighborhood map
What this means for you Summary
Snapshot
- This is a 3-bed/2.0-bath single-family listed at $105k.
Deal economics
- At list price, monthly cash flow is $114 ($1k/yr) — positive.
- The deal already cash-flows at list — no discount required.
- To meet the 1% rule (rent ≥ 1% of price), the offer needs to be $100k (4.8% below list).
- Recommended offer: $96k (9.0% below list) — sets the bar for market timing.
- Cap rate 7.6% vs local median 4.8% in DeRidder — top-decile yield for the area; either an underpriced asset or a hidden risk that comps aren't pricing in. Stress-test before assuming the spread holds.
Location & tenants
- Location reads 72/100 on livability (#43 in LA) — a middle-class / working-renter tenant base. Strengths: cost of living A+, housing A+, health & safety A+; Watch: amenities F, commute F, employment D-.
- Beauregard Parish (rural): math 30% / reading 41% proficiency, ranked #32 of 98 in LA (top 33%) — families likely to look elsewhere, expect single-tenant / working-renter base with shorter leases.
- Market conditions: 241 active listings in the ZIP; 1 comparable units currently listed for rent nearby; 83 units permitted in Beauregard Parish in 2024 (0 in 5+ unit buildings).
Forward outlook
- Local home prices are declining (-3.0%/yr); year-one equity from $726 of loan paydown is wiped out by about $3k of value loss. Plan a longer hold.
Negotiation context
- It's been on market 119 days — a 9% lower offer ($96k) is reasonable based on typical stale-listing flexibility.
- 2 sale attempts since 5y ago; this cycle's ask has dropped $12k (10%) from the opening price — seller is motivated, your offer sets the floor, not the list.
Risks & watch-outs
- Climate carrying-cost: severe wind risk, 99% chance of damaging wind over 30y; extreme-heat days projected 7→20/yr by 2055 (HVAC capex compounding) — expect insurance premiums to compound above CPI over the hold.
Questions for the listing agent
- It's been on market 119 days. Have you received any prior offers? Is the seller open to a 9% concession, seller financing, or rate buy-down credit?
- Built in 1975 — when were the roof, HVAC, electrical panel, plumbing, and water heater last replaced?
- Why hasn't it sold? Are there any deal-killer items the seller is aware of (foundation, flood, title, zoning, code violations)?
- Is there a deadline driving the sale (1031 exchange, divorce, estate, relocation)? That informs how much negotiation room exists.
- Schools are B-rated — typically a magnet for longer-tenancy family renters. What's the average tenant stay here, and is there a school-zone premium baked into asking?
- What's the average days-on-market for RENTAL listings here right now (not sales)? A rising rental-DOM trend means longer vacancies and softer asking-rent achievability than the comps imply.
- What's the recent tenant-quality profile in this submarket — average credit score on applications, eviction rate, late-payment / NSF rate, and stable-employment percentage? A property-management company in the area should have these aggregated.
- How much new for-sale + rental construction is in the pipeline within 1–3 miles? Heavy new supply typically softens prices + rents 12–24 months out; constrained supply supports both.
Investment metrics
- 1% rule
- 0.95% ✗
- Cap rate
- 7.60%
- Cash-on-cash
- 4.65%
- DSCR
- 1.21
- GRM
- 8.8
CMA / ARV
- ARV (median comp)
- $168,328
- List price
- $105,000
- Delta
- -37.62%
- Verdict
- UNDERPRICED
- Comps
- 20 within 1.0 mi
Show comp detail 6 sales within ~0.75 mi
| Address | Dist | Beds/Ba | Sqft | Sold | Price | $/sf | Match |
|---|---|---|---|---|---|---|---|
| 302 S Royal St | 0.08mi | 2/2.0 (-1) | 1,842 (+1%) | 9mo | $203,000 | $110 | 82 |
| 601 S Royal St | 0.15mi | 3/2.0 | 1,780 (-3%) | 8mo | $187,000 | $105 | 82 |
| 703 Whitney Dr | 0.38mi | 3/2.0 | 1,783 (-2%) | 9mo | $190,000 | $107 | 70 |
| 810 Royal Oak Ln | 0.48mi | 3/2.0 | 1,682 (-8%) | 6mo | $240,000 | $143 | 59 |
| 316 N Hall St | 0.71mi | 3/3.0 | 1,860 (+2%) | 12mo | $220,000 | $118 | 50 |
| 501 Haynes Dr | 0.57mi | 4/2.0 (+1) | 1,568 (-14%) | 11mo | $229,000 | $146 | 36 |
Match score weights: distance 35% · size 25% · config 20% · recency 20%. Top-matched comps best support the ARV.
Projected returns pro-forma
-3.0% appreciation · 3.0% rent growth · sell at horizon
- IRR
- -9.1%
- Equity multiple
- 0.67×
- Total profit
- $-9,768
- Equity at exit
- $15,656
- IRR
- 0.4%
- Equity multiple
- 1.03×
- Total profit
- $783
- Equity at exit
- $9,078
Cash invested: $29,400 (down + closing). Projections, not guarantees.
Landlord ↔ Tenant lean methodology
- Overall (STATE)
- 90 Strongly Landlord-Friendly
- State Louisiana
- 90 Strongly Landlord-Friendly · R+12
- County
- — inherits STATE
- City
- — inherits STATE
ZIP-level market 70634
- Home prices YoY
- -30.6%
- Active inventory
- 241
- Price-to-rent
- 8.8×
Monthly cashflow live
- Estimated rent
- $1,000 medium interval (Pro) →
- Mortgage (P&I)
- −$551
- Tax from tax record
- −$82 /mo · $979/yr
- Insurance
- −$44
- HOA
- −$0
- Vacancy / Maint / Mgmt
- −$210
- Net cashflow
- $114
Break-even live
UW: 25.0% down · 7.5% · 30yr · 1.5% tax · 5.0% vac · 8.0% maint · 8.0% mgmt
Financing live
Cash to close
- Down payment
- $26,250
- Closing costs
- $3,150
- Reserves months
- —
- Total cash needed
- —
Loan-product check · same deal, 3 products live
Conventional
25% down · 7.5% · 30yr
- Down + closing
- —
- Monthly P&I
- —
- Monthly cashflow
- —
- DSCR
- —
- Eligible?
- —
Personal DTI + credit; lowest rate.
DSCR
20% down · 8.5% · 30yr
- Down + closing
- —
- Monthly P&I
- —
- Monthly cashflow
- —
- DSCR
- —
- Eligible?
- —
No personal income docs; deal must DSCR.
Hard money
10% down · 12.0% · 12mo
- Down + closing
- —
- Monthly P&I
- —
- Monthly cashflow
- —
- DSCR
- —
- Eligible?
- —
Short-term bridge; refi at stabilization.
Rent comps 1 comps
| Address | Beds | Baths | Sqft | Rent | $/sqft | DOM | Units | Dist |
|---|---|---|---|---|---|---|---|---|
| 124 Azalea Ave Deridder, LA | 3.0 | 2.0 | 1440 | $1,000 | $0.69 | 13d | 1 | 1.11mi |
Listing history 22 events
-
2026-06-19days on market $105,000 Active 119 DOM
-
2026-06-18days on market $105,000 Active 118 DOM
-
2026-06-17days on market $105,000 Active 117 DOM
-
2026-06-16days on market $105,000 Active 116 DOM
-
2026-06-15days on market $105,000 Active 115 DOM
-
2026-06-14days on market $105,000 Active 113 DOM
-
2026-06-13days on market $105,000 Active 112 DOM
-
2026-06-10days on market $105,000 Active 110 DOM
-
2026-06-09days on market $105,000 Active 109 DOM
-
2026-06-08days on market $105,000 Active 108 DOM
-
2026-06-07days on market $105,000 Active 107 DOM
-
2026-06-03days on market $105,000 Active 103 DOM
-
2026-06-02days on market $105,000 Active 102 DOM
-
2026-06-01days on market $105,000 Active 101 DOM
-
2026-05-31days on market $105,000 Active 100 DOM
-
2026-05-30days on market $105,000 Active 99 DOM
-
2026-02-21$117,000 Active 672-char remark
Show marketing remark (672 chars)
Charming home with character and plenty of potential. A welcoming back porch leads to a large, beautiful deck and a fenced yard offering privacy and making it perfect for entertaining, gardening, or pets. Certain spaces in the home need some TLC but it has so much character and so much to offer. The cozy den with fireplace creates a warm gathering spot, and a flexible extra room that could easily serve as a fourth bedroom. The property spans three city lots, providing extra space and options, and includes a second extra room for an office, hobby area, or playroom. This home is Ideal for buyers looking to add personal updates while retaining its original character.
-
2021-07-16soldstatus $100,000
-
2021-07-15soldstatus 500-char remark
Show marketing remark (500 chars)
This home has so much character! This home sits on 3 city lots on the corner! With many updates featuring new vinyl siding, updated bathrooms, updated kitchen and new flooring throughout most of the home! Large bedrooms and even a FORMAL living room and large family DEN. This home could also be converted to 4 bedrooms as there is an additional large room! With a covered back PATIO and a large DECK you have plenty of room for all your outdoor BBQ's! See this charming home today with your Realtor!
-
2021-03-02$105,000 500-char remark
Show marketing remark (500 chars)
This home has so much character! This home sits on 3 city lots on the corner! With many updates featuring new vinyl siding, updated bathrooms, updated kitchen and new flooring throughout most of the home! Large bedrooms and even a FORMAL living room and large family DEN. This home could also be converted to 4 bedrooms as there is an additional large room! With a covered back PATIO and a large DECK you have plenty of room for all your outdoor BBQ's! See this charming home today with your Realtor!
-
2011-04-28soldstatus $89,000
-
2008-08-28soldstatus
ⓘ Source: listings_history table (triggers on properties + properties_extension) + one-shot
backfill from property_details.listing_events for pre-trigger history.
Tax reassessment forecast LA · Resets to sale price
- Current annual tax
- $979 · $82/mo
- Projected year-2 tax
- $979 · $82/mo
- Expected delta
- $0/yr ($0/mo · 0.0%)
ⓘ Screening estimate from a state-policy table — verify with the county assessor before closing.
Climate risk First Street
- Flood 1/10 Low FEMA zone X (unshaded) · 0% chance over 30 yrs
- Wildfire 2/10 Low
- Heat 8/10 Severe 7 d/yr ≥110°F today · 20 d/yr by 30 yrs out
- Wind 8/10 Severe 99% chance of damaging wind over 30 yrs
- Air quality 2/10 Low 1 unhealthy d/yr today · 1 by 30 yrs out
Nearby sold comps map
Loading sold comps map…
Walkable amenities ~0.75 mi
Loading nearby amenities…
Taxation est. · year 1
- Rental income
- $12,000
- − Mortgage interest
- −$5,882
- − Property taxes
- −$979
- − Insurance
- −$525
- − Repairs & maintenance
- −$960
- − Management
- −$960
- − Depreciation
- −$3,055
- Taxable loss
- −$360
- Est. tax savings @ 24.0%
- +$86
- After-tax cash flow
- $1,455/yr
For passive investors: Depreciation is non-cash, so a rental often shows a tax loss while cash-flowing — sheltering income. Rental losses are passive: they offset passive income freely, and up to $25,000/yr can offset ordinary (W-2) income if you actively participate and your MAGI is under $100k (phasing out to $0 by $150k); unused losses carry forward. On sale, claimed depreciation is recaptured at up to 25%, and gains may owe capital-gains tax (a 1031 exchange can defer both). Figures are a year-1 estimate at your 24.0% rate — not tax advice; consult a CPA.
Schools (NCES district)
- District
- Beauregard Parish
- NCES district ID
- 2200180
- Math proficiency
- 30% ▼ -40.00%
- Reading proficiency
- 41% ▼ -35.00%
- Median HH income
- $46,033
- Composite
- 30.34/100
- National rank
- #6265
- State rank
- #32 of 98 in LA
Livability — DeRidder
- Score
- 72/100
- State rank
- #43
- US rank
- #6227
Category grades
Schools grade is shown separately in the Schools card above.
Census & demographics
- Census place
- DeRidder, LA
- Population (ZIP)
- 25,038
Population outlook (Beauregard County) Hauer SSP2
- Today (2025)
- 37,760 people
- By 2030
- 38,140 · +1.0%
- By 2040
- 38,518 · +2.0%
- By 2050
- 38,164 · +1.1%
- By 2075
- 36,437 · -3.5%
- By 2100
- 32,493 · -13.9%
Race, ethnicity, and origin ACS 2023
- Neighborhood character
- Predominantly White (72%)
- Race & ethnicity
- White 72% Black 14% Two or more races 9% Hispanic / Latino 5% Asian 1%
- Hispanic origin (detail)
- Mexican 3% Puerto Rican 1%
- Common ancestry
- Lithuanian 6% Slovak 1% Italian 1%
- Foreign-born
- 2% · Canada
- Languages at home
- 96% English-only · Spanish 2% French/Haitian/Cajun 1%
Political lean MEDSL · Beauregard
- 2024 margin
- Solid R (+71.3) · D 13.8% · R 85.1% · Other 1.1%
- 2008→2024 swing
- -16.9pp toward R · 2008: -54.3pp · 2024: -71.3pp
- All cycles
- 2024: R+71.3 2020: R+67.5 2016: R+65.3 2012: R+58.2 2008: R+54.3
Not yet ingested
- Civics
- —
Market trends
- HPI YoY
- ▼ -57.61%
- Current HPI
- 130.4445
- Rent YoY
- —
- Metro
- —
- State GDP YoY
- ▲ 3.29%
- F500 in state
- 10
Industry mix (Fortune 500 HQ in LA)
| Industry | F500 HQs | Revenue |
|---|---|---|
| Telecommunications | 2 | $23B |
|
||
| Utilities | 1 | $12B |
|
||
| Wholesale / Distribution | 1 | $5B |
|
||
| Advertising | 1 | $2B |
|
||
Price history
+31.5% since first listed6 events — show timeline
- 2026-02-21 Listed $117,000 GFPAR
- 2021-07-16 Sold (Public Records) $100,000 Public Records
- 2021-07-15 Sold (MLS) — GFPAR
- 2021-03-02 Listed $105,000 GFPAR
- 2011-04-28 Sold (Public Records) $89,000 Public Records
- 2008-08-28 Sold (Public Records) — Public Records
Property tax history
+1.3%/yrLatest (2025): $979 · +0.7% YoY. Source: county tax records.
Cash-flow waterfall
monthlySold comps — $/sqft
last 12 mo · ≤1 miLoading sold comps…