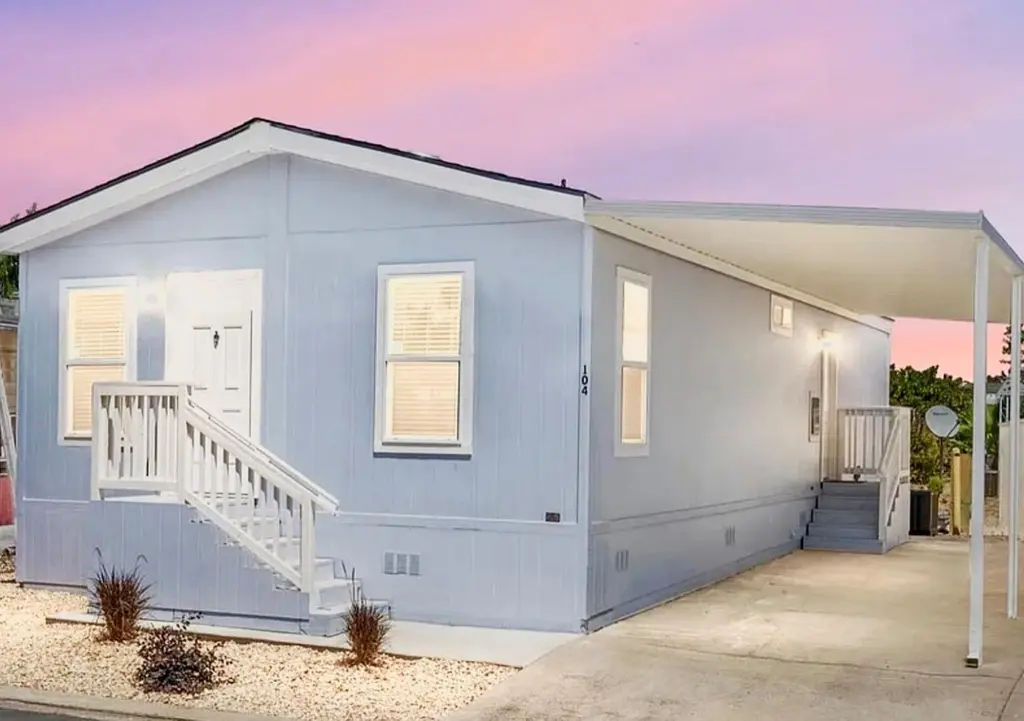
2240 Golden Oak Ln #104 · Merced, CA
Flood risk 5/10 · Moderate
- FEMA flood zone
- AO
- Chance of flooding over 30 yrs
- 0.51%
- Est. flood insurance / yr
- $848 – $2,087
Fire risk 8/10 · Major
- Est. fire insurance / yr
- $659 – $1,223
Heat risk 7/10 · Major
- Hot days now (above 104°F)
- 7 days/yr
- Hot days in 30 yrs
- 16 days/yr
Wind risk 1/10 · Minimal
- Chance of severe wind over 30 yrs
- —
Air-quality risk 10/10 · Severe
- Unhealthy air days now
- 38 days/yr
- Unhealthy air days in 30 yrs
- 40 days/yr
Risk factors via First Street. Map © Google.
Why this score? — see what drove the B- grade
The composite is a weighted blend of 9 inputs, each scored 0–100. Each bar is that input's sub-score; the figure is the points it added to the 100-point composite (weight × sub-score).
- Cash flow +30.0/30.0
- DSCR +10.0/10.0
- 1% rule +9.0/10.0
- ARV discount +7.5/15.0
- Livability +3.7/5.0
- Rent growth +2.9/5.0
- Schools +2.8/10.0
- Condition / age +2.5/5.0
- Appreciation +0.0/10.0
$119,900
🖨 Deal sheet (PDF) 📄 Offer letter ✓ Due diligence
Listing remarks
Beautiful & Spacious Brand New Double Wide Modular home. Featuring a bright spacious open floor plan, 3 bedrooms, 2 Full bath, Inside laundry, central AC/Heat. Popular Sierra Portal gated Senior Community, features clubhouse with Kitchen, Fitness room, Billiards, Bingo, sparkling pool, spa, sauna, Dog park Etc. 1 month space rent included!
Key facts
- Billiards
- Spa
- Sauna
Tags
Neighborhood map
What this means for you Summary
Snapshot
- This is a 3-bed/2.0-bath manufactured listed at $120k.
Deal economics
- At list price, monthly cash flow is $372 ($4k/yr) — positive.
- The deal already cash-flows at list — no discount required.
- Meets the 1% rule at list price ($2k rent vs $120k).
- Recommended offer: $106k (12.0% below list) — sets the bar for market timing.
- Cap rate 11.2% vs local median 3.4% in Merced — top-decile yield for the area; either an underpriced asset or a hidden risk that comps aren't pricing in. Stress-test before assuming the spread holds.
Location & tenants
- Location reads 73/100 on livability (#153 in CA) — a middle-class / working-renter tenant base. Strengths: amenities A+, commute A+, housing A+; Watch: schools D, employment D, crime F.
- Merced Union High (urban): math 20% / reading 46% proficiency, ranked #301 of 517 in CA (top 58%) — families likely to look elsewhere, expect single-tenant / working-renter base with shorter leases.
- Market conditions: Rents rising (+1.7%/yr); 170 active listings in the ZIP; 8 comparable units currently listed for rent nearby; rentals at typical pace (median 14d on market — plan ~3-4 weeks tenant-placement turnaround); 459 units permitted in Merced County in 2024 (0 in 5+ unit buildings).
- This rent runs 35% of the median local income ($57k/yr) — at the standard rent-burdened threshold; future hikes will face affordability resistance.
Forward outlook
- Local home prices are declining (-3.0%/yr); year-one equity from $829 of loan paydown is wiped out by about $4k of value loss. Plan a longer hold.
- Merced County population projected at +12% by 2050 — modest demand growth; plan on rents tracking national, not racing it.
Negotiation context
- It's been on market 177 days — a 12% lower offer ($106k) is reasonable based on typical stale-listing flexibility.
- 5 sale attempts since 12y ago; this cycle's ask has dropped $10k (8%) from the opening price — seller is motivated, your offer sets the floor, not the list.
- Current owner paid $24k; list at $120k implies a 402% gain — meaningful room to come down on a strong offer.
Risks & watch-outs
- Watch-outs: flood insurance adds $122/mo.
- Climate carrying-cost: in FEMA flood zone AO (mandatory federal flood insurance); severe wildfire risk; extreme-heat days projected 7→16/yr by 2055 (HVAC capex compounding) — expect insurance premiums to compound above CPI over the hold.
Questions for the listing agent
- It's been on market 177 days. Have you received any prior offers? Is the seller open to a 12% concession, seller financing, or rate buy-down credit?
- What's the actual annual flood-insurance premium (NFIP or private), and is the property in a SFHA with mandatory coverage?
- Why hasn't it sold? Are there any deal-killer items the seller is aware of (foundation, flood, title, zoning, code violations)?
- Is there a deadline driving the sale (1031 exchange, divorce, estate, relocation)? That informs how much negotiation room exists.
- Schools are D-rated, which usually means shorter tenancies and higher turnover. Who's the typical renter profile here, and what's been the actual vacancy rate?
- Crime grade is F in this area — have there been break-ins, vandalism, or insurance claims at this property in the last 3 years? What carrier currently insures it and at what premium?
- What's the average days-on-market for RENTAL listings here right now (not sales)? A rising rental-DOM trend means longer vacancies and softer asking-rent achievability than the comps imply.
- What's the recent tenant-quality profile in this submarket — average credit score on applications, eviction rate, late-payment / NSF rate, and stable-employment percentage? A property-management company in the area should have these aggregated.
- How much new for-sale + rental construction is in the pipeline within 1–3 miles? Heavy new supply typically softens prices + rents 12–24 months out; constrained supply supports both.
Investment metrics
- 1% rule
- 1.40% ✓
- Cap rate
- 11.24%
- Cash-on-cash
- 17.68%
- DSCR
- 1.79
- GRM
- 6.0
CMA / ARV
- ARV (median comp)
- $59,000
- List price
- $119,900
- Delta
- 103.22%
- Verdict
- OVERPRICED
- Comps
- 7 within 1.0 mi
Projected returns pro-forma
-3.0% appreciation · 1.68% rent growth · sell at horizon
- IRR
- 1.7%
- Equity multiple
- 1.07×
- Total profit
- $2,183
- Equity at exit
- $17,877
- IRR
- 9.9%
- Equity multiple
- 1.72×
- Total profit
- $24,062
- Equity at exit
- $10,367
Cash invested: $33,572 (down + closing). Projections, not guarantees.
Landlord ↔ Tenant lean methodology
- Overall (STATE)
- 18 Strongly Tenant-Friendly
- State California
- 18 Strongly Tenant-Friendly · D+13
- County
- — inherits STATE
- City
- — inherits STATE
ZIP-level market 95341
- Home prices YoY
- -29.2%
- Rents YoY
- 1.7%
- Active inventory
- 170
- Price-to-rent
- 6.0×
Monthly cashflow live
- Estimated rent
- $1,675 high interval (Pro) →
- Mortgage (P&I)
- −$629
- Tax est. 1.5%
- −$150 /mo · $1,798/yr
- Insurance
- −$50
- Flood insurance flood zone
- −$122 /mo · $1,468/yr
- HOA
- −$0
- Vacancy / Maint / Mgmt
- −$352
- Net cashflow
- $372
Break-even live
Sensitivity live
| Price | -10% $455 | -5% $414 | +0% $372 | +5% $331 | +10% $289 |
|---|---|---|---|---|---|
| Rent | -10% $240 | -5% $306 | +0% $372 | +5% $438 | +10% $505 |
| Rate | -1.0pp $433 | -0.5pp $403 | base $372 | +0.5pp $341 | +1.0pp $310 |
UW: 25.0% down · 7.5% · 30yr · 1.5% tax · 5.0% vac · 8.0% maint · 8.0% mgmt
Financing live
Cash to close
- Down payment
- $29,975
- Closing costs
- $3,597
- Reserves months
- —
- Total cash needed
- —
Loan-product check · same deal, 3 products live
Conventional
25% down · 7.5% · 30yr
- Down + closing
- —
- Monthly P&I
- —
- Monthly cashflow
- —
- DSCR
- —
- Eligible?
- —
Personal DTI + credit; lowest rate.
DSCR
20% down · 8.5% · 30yr
- Down + closing
- —
- Monthly P&I
- —
- Monthly cashflow
- —
- DSCR
- —
- Eligible?
- —
No personal income docs; deal must DSCR.
Hard money
10% down · 12.0% · 12mo
- Down + closing
- —
- Monthly P&I
- —
- Monthly cashflow
- —
- DSCR
- —
- Eligible?
- —
Short-term bridge; refi at stabilization.
Rent comps 8 comps
| Address | Beds | Baths | Sqft | Rent | $/sqft | DOM | Units | Dist |
|---|---|---|---|---|---|---|---|---|
| 1976 Edwards Ave Unit 1 Merced, CA | 2.0 | 1.0 | 850 | $1,125 | $1.32 | 14d | 1 | 0.30mi |
| 2157 Yosemite Pkwy Unit 32 Merced, CA | 2.0 | 1.5 | 864 | $1,400 | $1.62 | 14d | 1 | 0.30mi |
| 1560 Ellen Ct Apt 4 Merced, CA | 2.0 | 1.0 | 750 | $1,200 | $1.60 | 14d | 1 | 0.41mi |
| 1532 Ellen Ct Unit 1532 Merced, CA | 2.0 | 1.0 | 840 | $1,200 | $1.43 | 14d | 1 | 0.43mi |
| Ellen Ct Merced, CA | 2.0 | 1.0 | 840 | $1,095 | $1.30 | 4d | 1 | 0.44mi |
| 1557 Ellen Ct Unit 1557 Merced, CA | 2.0 | 1.0 | 756 | $1,200 | $1.59 | 14d | 1 | 0.47mi |
| 2560 Midge Ave Merced, CA | 1.0–2.0 | 1.0 | 708 | $1,150 | $1.62 | 8d | 8 | 1.01mi |
| 2597 Glen Ave Unit 2591glen Merced, CA | 2.0 | 1.0 | 850 | $1,300 | $1.53 | 14d | 1 | 1.14mi |
Listing history 33 events
-
2026-06-18days on market $119,900 Active 177 DOM
-
2026-06-17days on market $119,900 Active 176 DOM
-
2026-06-16days on market $119,900 Active 175 DOM
-
2026-06-15days on market $119,900 Active 174 DOM
-
2026-06-14days on market $119,900 Active 172 DOM
-
2026-06-13days on market $119,900 Active 171 DOM
-
2026-06-10days on market $119,900 Active 169 DOM
-
2026-06-09days on market $119,900 Active 168 DOM
-
2026-06-08days on market $119,900 Active 167 DOM
-
2026-06-07days on market $119,900 Active 166 DOM
-
2026-06-05days on market $119,900 Active 163 DOM
-
2026-06-03days on market $119,900 Active 162 DOM
-
2026-06-02days on market $119,900 Active 161 DOM
-
2026-06-01days on market $119,900 Active 160 DOM
-
2026-05-31days on market $119,900 Active 159 DOM
-
2026-05-30days on market $119,900 Active 158 DOM
-
2025-06-16historical
-
2025-04-10price $119,900
-
2025-04-09price $119,900
-
2025-03-05$129,900 Active
-
2025-01-30historical
-
2025-01-30$129,900 Active
-
2025-01-30historical
-
2024-10-23price $129,900
-
2024-10-23price $129,900
-
2024-07-31$135,000 Active
-
2024-07-30$135,000 Active
-
2015-09-25historical
-
2015-09-23soldstatus $23,900 Closed Sale
-
2015-08-27status Pending Sale
-
2015-07-25price $23,900
-
2014-10-08price $28,900
-
2014-05-21$32,000 Active
ⓘ Source: listings_history table (triggers on properties + properties_extension) + one-shot
backfill from property_details.listing_events for pre-trigger history.
Climate risk First Street
- Flood 5/10 Major FEMA zone AO · 51% chance over 30 yrs
- Wildfire 8/10 Severe
- Heat 7/10 Severe 7 d/yr ≥104°F today · 16 d/yr by 30 yrs out
- Wind 1/10 Low
- Air quality 10/10 Extreme 38 unhealthy d/yr today · 40 by 30 yrs out
Nearby sold comps map
Loading sold comps map…
Walkable amenities ~0.75 mi
Loading nearby amenities…
Taxation est. · year 1
- Rental income
- $20,098
- − Mortgage interest
- −$6,716
- − Property taxes
- −$1,798
- − Insurance
- −$2,067
- − Repairs & maintenance
- −$1,608
- − Management
- −$1,608
- − Depreciation
- −$3,488
- Taxable income
- $2,813
- Est. tax owed @ 24.0%
- −$675
- After-tax cash flow
- $3,792/yr
For passive investors: Depreciation is non-cash, so a rental often shows a tax loss while cash-flowing — sheltering income. Rental losses are passive: they offset passive income freely, and up to $25,000/yr can offset ordinary (W-2) income if you actively participate and your MAGI is under $100k (phasing out to $0 by $150k); unused losses carry forward. On sale, claimed depreciation is recaptured at up to 25%, and gains may owe capital-gains tax (a 1031 exchange can defer both). Figures are a year-1 estimate at your 24.0% rate — not tax advice; consult a CPA.
Schools (NCES district)
- District
- Merced Union High
- NCES district ID
- 0624660
- Math proficiency
- 20% ▲ 3.00%
- Reading proficiency
- 46% ▼ -1.00%
- Median HH income
- $44,977
- Composite
- 28.11/100
- National rank
- #6823
- State rank
- #301 of 517 in CA
Livability — Merced
- Score
- 73/100
- State rank
- #153
- US rank
- #5111
Category grades
Schools grade is shown separately in the Schools card above.
Census & demographics
- Census place
- Merced, CA
- County
- Merced County · 205,386 people
- City population
- 112,228
- Metro
- Merced, CA
- Population (ZIP)
- 36,385
- Household income
- $57,342
- Rent vs Own
- Severe rent burden
- 1419.0
Population outlook (Merced County) Hauer SSP2
- Today (2025)
- 285,501 people
- By 2030
- 293,437 · +2.8%
- By 2040
- 308,808 · +8.2%
- By 2050
- 321,011 · +12.4%
- By 2075
- 338,497 · +18.6%
- By 2100
- 330,493 · +15.8%
Race, ethnicity, and origin ACS 2023
- Neighborhood character
- Predominantly Hispanic (73%)
- Race & ethnicity
- Hispanic / Latino 73% White 12% Two or more races 11% Asian 8% Black 3%
- Hispanic origin (detail)
- Mexican 70%
- Common ancestry
- Russian 2%
- Foreign-born
- 30% · Canada
- Languages at home
- 37% English-only · Spanish 55% Other Asian/Pacific 6% Other Indo-European 1%
Political lean MEDSL · Merced
- 2024 margin
- Toss-up / Even · D 46.5% · R 50.9% · Other 2.6%
- 2008→2024 swing
- -12.7pp toward R · 2008: 8.3pp · 2024: -4.4pp
- All cycles
- 2024: R+4.4 2020: D+10.6 2016: D+7.9 2012: D+5.4 2008: D+8.3
Not yet ingested
- Civics
- —
Market trends
- HPI YoY
- ▼ -129.65%
- Current HPI
- 314.4223
- Rent YoY
- ▲ 1.68%
- Metro
- Merced, CA
- State GDP YoY
- ▲ 3.21%
- F500 in state
- 116
Industry mix (Fortune 500 HQ in CA)
| Industry | F500 HQs | Revenue |
|---|---|---|
| Technology | 27 | $1,492B |
|
||
| Financial Services | 3 | $174B |
|
||
| Retail | 3 | $44B |
|
||
| Insurance | 3 | $26B |
|
||
| Media / Entertainment | 2 | $115B |
|
||
| Pharmaceuticals / Biotech | 2 | $62B |
|
||
Price history
+274.7% since first listed17 events — show timeline
- 2025-06-16 Listing Removed — CRMLS
- 2025-04-10 Price Changed $119,900 GEMLS
- 2025-04-09 Price Changed $119,900 CRMLS
- 2025-03-05 Listed $129,900 CRMLS
- 2025-01-30 Listing Removed — bridgeMLS, Bay East AOR, or Contra Costa AOR
- 2025-01-30 Listing Removed — CRMLS
- 2025-01-30 Listed $129,900 GEMLS
- 2024-10-23 Price Changed $129,900 CRMLS
- 2024-10-23 Price Changed $129,900 GEMLS
- 2024-07-31 Listed $135,000 GEMLS
- 2024-07-30 Listed $135,000 CRMLS
- 2015-09-25 Listing Removed — CRMLS
- 2015-09-23 Sold (MLS) $23,900 CRMLS
- 2015-08-27 Pending — CRMLS
- 2015-07-25 Price Changed $23,900 CRMLS
- 2014-10-08 Price Changed $28,900 CRMLS
- 2014-05-21 Listed $32,000 CRMLS
Property tax history
-6.2%/yrLatest (2014): $230 · +3.0% YoY. Source: county tax records.
Cash-flow waterfall
monthlySold comps — $/sqft
last 12 mo · ≤1 miLoading sold comps…