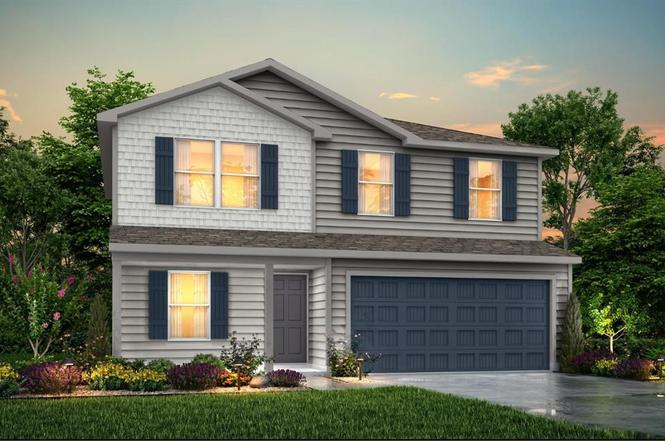
209 Coyote Crk · Abilene, TX
Flood risk 1/10 · Minimal
- FEMA flood zone
- X (unshaded)
- Chance of flooding over 30 yrs
- 0.0%
- Est. flood insurance / yr
- $507 – $1,088
Fire risk 7/10 · Major
- Est. fire insurance / yr
- $1,222 – $2,270
Heat risk 7/10 · Major
- Hot days now (above 103°F)
- 7 days/yr
- Hot days in 30 yrs
- 25 days/yr
Wind risk 4/10 · Minor
- Chance of severe wind over 30 yrs
- 15.0%
Air-quality risk 1/10 · Minimal
- Unhealthy air days now
- 0 days/yr
- Unhealthy air days in 30 yrs
- 0 days/yr
Risk factors via First Street. Map © Google.
Why this score? — see what drove the B- grade
The composite is a weighted blend of 9 inputs, each scored 0–100. Each bar is that input's sub-score; the figure is the points it added to the 100-point composite (weight × sub-score).
- Cash flow +28.5/30.0
- DSCR +10.0/10.0
- ARV discount +9.5/15.0
- 1% rule +7.9/10.0
- Rent growth +5.0/5.0
- Livability +3.8/5.0
- Schools +2.8/10.0
- Condition / age +2.5/5.0
- Appreciation +0.0/10.0
$258,990
🖨 Deal sheet 📄 Offer letter ✓ Due diligence
Listing remarks
MLS# 21131544 - Built by NHC - Ready Now! ~ The Harrison Plan from our Liberty Series offers a perfect blend of comfort, practicality, and exceptional value. This 2-story home features 4 bedrooms, 2.5 bathrooms, a 2-car garage, and 2,203 square feet of thoughtfully designed living space. As you step inside, you’ll pass the versatile flex room before reaching the staircase to the upper level, a convenient closet, and half bathroom. The heart of the home is the open kitchen and living area, complete with a central island, a dining area, and a spacious family room — perfect for entertaining or relaxing with loved ones. Upstairs, the private primary suite awaits, featuring an ensuit
Key facts
- 3,055 sq ft lot
- 2 garage spots
- Built 2026
Property features AI
Finance
- Financial info: Accepts Cash, Conventional, FHA, and VA financing; Treat as clear loan type; No second mortgage
- HOA & community: No homeowners association (no association fees)
Exterior
- Parking: Attached 2-car garage (garage faces front); 2 covered parking spaces; 1 carport space
- Utilities: City water; City sewer; No municipal utility district
- Home design: Single family residence; Two-story; New construction (incomplete, 2026)
- Construction: Built 2026 (new construction - incomplete); Brick and siding exterior; Composition roof; Slab foundation
- Exterior features: Condo/townhome lot; Subdivision: Cedar Creek On Maple Grove
Interior
- Kitchen: Dishwasher; Electric range; Microwave; Eat-in kitchen layout
- Bedrooms: 4 bedrooms (three bedrooms on the second level, one bedroom located on the second level listed as Primary); Primary bedroom with dual sinks and walk-in closet
- Flooring: Carpet; Laminate; Luxury vinyl plank
- Bathrooms: 2 full bathrooms; 1 half bathroom
- Heating & cooling: Electric heating; Central electric cooling
- Interior features: Double vanity; Eat-in kitchen; Walk-in closet(s); Two living areas; One dining area; 9 total rooms; Two levels
Neighborhood map
What this means for you Summary
Snapshot
- This is a 4-bed/2.5-bath single-family listed at $259k.
Deal economics
- At list price, monthly cash flow is $845 ($10k/yr) — positive.
- The deal already cash-flows at list — no discount required.
- Meets the 1% rule at list price ($3k rent vs $259k).
- Recommended offer: $236k (9.0% below list) — sets the bar for market timing.
- Cap rate 10.2% vs local median 6.7% in Abilene — top-decile yield for the area; either an underpriced asset or a hidden risk that comps aren't pricing in. Stress-test before assuming the spread holds.
Location & tenants
- Location reads 75/100 on livability (#142 in TX, #4,037 nationally) — a middle-class / working-renter tenant base. Strengths: cost of living A+, housing A+, health & safety A+; Watch: schools D+, crime D, commute F.
- Abilene ISD (urban): math 32% / reading 34% proficiency, ranked #575 of 826 in TX (top 70%) — families likely to look elsewhere, expect single-tenant / working-renter base with shorter leases.
- Market conditions: Rents rising fast (+33.5%/yr); 370 active listings in the ZIP; 6 comparable units currently listed for rent nearby; rentals leasing fast (median 13d on market — plan ~1-2 weeks tenant-placement turnaround); solid renter incomes; 508 units permitted in Taylor County in 2024 (0 in 5+ unit buildings).
- This rent runs 45% of the median local income ($90k/yr) — at the standard rent-burdened threshold; future hikes will face affordability resistance.
Forward outlook
- Local home prices are declining (-3.0%/yr); year-one equity from $2k of loan paydown is wiped out by about $8k of value loss. Plan a longer hold.
- Taylor County population projected at +16% by 2050 — long-run rental-demand tailwind backs the buy-and-hold thesis.
- At projected returns (-3.0% appreciation + 8.0% rent growth), your $73k cash investment doubles in ~7 years — after that, you're playing with house money.
Negotiation context
- It's been on market 98 days — a 9% lower offer ($236k) is reasonable based on typical stale-listing flexibility.
- 2 sale attempts; this cycle's ask has dropped $17k (6%) from the opening price — seller is motivated, your offer sets the floor, not the list.
Risks & watch-outs
- Climate carrying-cost: major wildfire risk; extreme-heat days projected 7→25/yr by 2055 (HVAC capex compounding) — expect insurance premiums to compound above CPI over the hold.
Questions for the listing agent
- It's been on market 98 days. Have you received any prior offers? Is the seller open to a 9% concession, seller financing, or rate buy-down credit?
- Why hasn't it sold? Are there any deal-killer items the seller is aware of (foundation, flood, title, zoning, code violations)?
- Is there a deadline driving the sale (1031 exchange, divorce, estate, relocation)? That informs how much negotiation room exists.
- Schools are D-rated, which usually means shorter tenancies and higher turnover. Who's the typical renter profile here, and what's been the actual vacancy rate?
- Crime grade is D in this area — have there been break-ins, vandalism, or insurance claims at this property in the last 3 years? What carrier currently insures it and at what premium?
- What's the average days-on-market for RENTAL listings here right now (not sales)? A rising rental-DOM trend means longer vacancies and softer asking-rent achievability than the comps imply.
- What's the recent tenant-quality profile in this submarket — average credit score on applications, eviction rate, late-payment / NSF rate, and stable-employment percentage? A property-management company in the area should have these aggregated.
- How much new for-sale + rental construction is in the pipeline within 1–3 miles? Heavy new supply typically softens prices + rents 12–24 months out; constrained supply supports both.
Investment metrics
- 1% rule
- 1.29% ✓
- Cap rate
- 10.21%
- Cash-on-cash
- 13.99%
- DSCR
- 1.62
- GRM
- 6.5
CMA / ARV
- ARV (on-the-fly)
- $270,969
- Comps found
- 12
Show comp detail 12 sales within ~0.75 mi
| Address | Dist | Beds/Ba | Sqft | Sold | Price | $/sf | Match |
|---|---|---|---|---|---|---|---|
| 209 Coyote Crk | 0.00mi | 4/2.5 | 2,203 (0%) | 1mo | $258,990 | $118 | 100 |
| 3510 Silver Springs Ct | 0.02mi | 4/2.5 | 2,203 (0%) | 1mo | $277,990 | $126 | 99 |
| 133 Coyote Creek Ct | 0.41mi | 4/2.5 | 2,203 (0%) | 1mo | $279,990 | $127 | 80 |
| 132 Dotty Lou | 0.15mi | 4/2.5 | 2,001 (-9%) | 3mo | $245,490 | $123 | 75 |
| 156 Dotty Lou | 0.16mi | 4/2.5 | 2,001 (-9%) | 3mo | $245,211 | $123 | 75 |
| 220 Dotty Lou | 0.16mi | 4/2.5 | 2,002 (-9%) | 3mo | $237,280 | $119 | 75 |
| 107 Dotty Lou | 0.16mi | 4/2.5 | 2,001 (-9%) | 3mo | $245,990 | $123 | 75 |
| 144 Dotty Lou | 0.16mi | 4/2.5 | 2,002 (-9%) | 4mo | $254,822 | $127 | 74 |
| 120 Dotty Lou | 0.16mi | 4/2.5 | 2,002 (-9%) | 4mo | $248,488 | $124 | 74 |
| 219 Polasek Dr | 0.22mi | 4/2.5 | 2,001 (-9%) | 0mo | $260,990 | $130 | 74 |
| 162 Dotty Lou St | 0.16mi | 5/2.5 (+1) | 2,408 (+9%) | 3mo | $271,489 | $113 | 70 |
| 138 Dotty Lou | 0.16mi | 5/2.5 (+1) | 2,408 (+9%) | 3mo | $266,990 | $111 | 69 |
Match score weights: distance 35% · size 25% · config 20% · recency 20%. Top-matched comps best support the ARV.
Projected returns pro-forma
-3.0% appreciation · 8.0% rent growth · sell at horizon
- IRR
- 9.8%
- Equity multiple
- 1.41×
- Total profit
- $29,542
- Equity at exit
- $38,616
- IRR
- 22.7%
- Equity multiple
- 3.42×
- Total profit
- $175,476
- Equity at exit
- $22,393
Cash invested: $72,517 (down + closing). Projections, not guarantees.
Landlord ↔ Tenant lean methodology
- Overall (STATE)
- 87 Strongly Landlord-Friendly
- State Texas
- 87 Strongly Landlord-Friendly · R+5
- County
- — inherits STATE
- City
- — inherits STATE
ZIP-level market 79602
- Home prices YoY
- -19.6%
- Rents YoY
- 33.5%
- Active inventory
- 370
- Price-to-rent
- 6.5×
Monthly cashflow live
- Estimated rent
- $3,335 high interval (Pro) →
- Mortgage (P&I)
- −$1,358
- Tax est. 1.5%
- −$324 /mo · $3,885/yr
- Insurance
- −$108
- HOA
- −$0
- Vacancy / Maint / Mgmt
- −$700
- Net cashflow
- $845
Break-even live
UW: 25.0% down · 7.5% · 30yr · 1.5% tax · 5.0% vac · 8.0% maint · 8.0% mgmt
Financing live
Cash to close
- Down payment
- $64,748
- Closing costs
- $7,770
- Reserves months
- —
- Total cash needed
- —
Loan-product check · same deal, 3 products live
Conventional
25% down · 7.5% · 30yr
- Down + closing
- —
- Monthly P&I
- —
- Monthly cashflow
- —
- DSCR
- —
- Eligible?
- —
Personal DTI + credit; lowest rate.
DSCR
20% down · 8.5% · 30yr
- Down + closing
- —
- Monthly P&I
- —
- Monthly cashflow
- —
- DSCR
- —
- Eligible?
- —
No personal income docs; deal must DSCR.
Hard money
10% down · 12.0% · 12mo
- Down + closing
- —
- Monthly P&I
- —
- Monthly cashflow
- —
- DSCR
- —
- Eligible?
- —
Short-term bridge; refi at stabilization.
Rent comps 6 comps
| Address | Beds | Baths | Sqft | Rent | $/sqft | DOM | Units | Dist |
|---|---|---|---|---|---|---|---|---|
| 609 Marlin Dr Abilene, TX | 3.0 | 2.0 | 1925 | $3,250 | $1.69 | 18d | 1 | 1.20mi |
| 1097 Lytle Creek Dr Abilene, TX | 3.0 | 2.0 | 1456 | $2,895 | $1.99 | 13d | 1 | 1.27mi |
| 3926 Duke Ln Abilene, TX | 3.0 | 2.0 | 1612 | $2,250 | $1.40 | 7d | 1 | 1.30mi |
| 2929 Sayles Blvd Abilene, TX | 4.0 | 2.0 | 2384 | $6,000 | $2.52 | 13d | 1 | 1.35mi |
| 3533 Grand Ave Abilene, TX | 5.0 | 2.0 | 1629 | $2,200 | $1.35 | 43d | 1 | 1.45mi |
| 801 Big Water Trl Abilene, TX | 3.0 | 2.0 | 1537 | $2,800 | $1.82 | 13d | 1 | 1.50mi |
Listing history 5 events
-
2026-05-01status Pending
-
2026-04-23price $258,990
-
2026-04-22status Active
-
2026-03-11status Pending
-
2025-12-12$275,544 Active
ⓘ Source: listings_history table (triggers on properties + properties_extension) + one-shot
backfill from property_details.listing_events for pre-trigger history.
Climate risk First Street
- Flood 1/10 Low FEMA zone X (unshaded) · 0% chance over 30 yrs
- Wildfire 7/10 Severe
- Heat 7/10 Severe 7 d/yr ≥103°F today · 25 d/yr by 30 yrs out
- Wind 4/10 Moderate 15% chance of damaging wind over 30 yrs
- Air quality 1/10 Low 0 unhealthy d/yr today · 0 by 30 yrs out
Nearby sold comps map
Loading sold comps map…
Walkable amenities ~0.75 mi
Loading nearby amenities…
Taxation est. · year 1
- Rental income
- $40,026
- − Mortgage interest
- −$14,507
- − Property taxes
- −$3,885
- − Insurance
- −$1,295
- − Repairs & maintenance
- −$3,202
- − Management
- −$3,202
- − Depreciation
- −$7,534
- Taxable income
- $6,400
- Est. tax owed @ 24.0%
- −$1,536
- After-tax cash flow
- $8,607/yr
For passive investors: Depreciation is non-cash, so a rental often shows a tax loss while cash-flowing — sheltering income. Rental losses are passive: they offset passive income freely, and up to $25,000/yr can offset ordinary (W-2) income if you actively participate and your MAGI is under $100k (phasing out to $0 by $150k); unused losses carry forward. On sale, claimed depreciation is recaptured at up to 25%, and gains may owe capital-gains tax (a 1031 exchange can defer both). Figures are a year-1 estimate at your 24.0% rate — not tax advice; consult a CPA.
Schools (NCES district)
- District
- Abilene ISD
- NCES district ID
- 4807440
- Math proficiency
- 32% ▼ -11.00%
- Reading proficiency
- 34% ▼ -5.00%
- Median HH income
- $39,782
- Composite
- 27.71/100
- National rank
- #6909
- State rank
- #575 of 826 in TX
Livability — Abilene
- Score
- 75/100
- State rank
- #142
- US rank
- #4037
Category grades
Schools grade is shown separately in the Schools card above.
Census & demographics
- Census place
- Abilene, TX
- County
- Taylor County · 136,672 people
- City population
- 136,672
- Metro
- Abilene, TX
- Population (ZIP)
- 27,425
- Household income
- $89,551
- Rent vs Own
- Severe rent burden
- 338.0
Population outlook (Taylor County) Hauer SSP2
- Today (2025)
- 145,270 people
- By 2030
- 150,050 · +3.3%
- By 2040
- 159,417 · +9.7%
- By 2050
- 168,883 · +16.3%
- By 2075
- 194,436 · +33.8%
- By 2100
- 203,163 · +39.9%
Race, ethnicity, and origin ACS 2023
- Neighborhood character
- Majority White (64%)
- Race & ethnicity
- White 64% Hispanic / Latino 22% Two or more races 12% Black 10% Asian 2%
- Hispanic origin (detail)
- Mexican 19%
- Common ancestry
- Romanian 2% Italian 2% Portuguese 2%
- Foreign-born
- 6% · Canada, Vietnam, Jamaica
- Languages at home
- 87% English-only · Spanish 9% Other Asian/Pacific 1% French/Haitian/Cajun 1%
Political lean MEDSL · Taylor
- 2024 margin
- Solid R (+49.8) · D 24.6% · R 74.4% · Other 1.0%
- 2008→2024 swing
- -4.2pp toward R · 2008: -45.6pp · 2024: -49.8pp
- All cycles
- 2024: R+49.8 2020: R+45.3 2016: R+51.1 2012: R+53.6 2008: R+45.6
Not yet ingested
- Civics
- —
Market trends
- HPI YoY
- ▼ -46.04%
- Current HPI
- 189.3098
- Rent YoY
- ▲ 33.46%
- Metro
- Abilene, TX
- State GDP YoY
- ▲ 3.95%
- F500 in state
- 110
Industry mix (Fortune 500 HQ in TX)
| Industry | F500 HQs | Revenue |
|---|---|---|
| Energy | 16 | $1,198B |
|
||
| Technology | 5 | $198B |
|
||
| Engineering / Construction | 4 | $72B |
|
||
| Energy Services | 3 | $60B |
|
||
| Utilities | 3 | $41B |
|
||
| Healthcare | 2 | $330B |
|
||
Price history
-6.0% since first listed5 events — show timeline
- 2026-05-01 Pending — NTREIS
- 2026-04-23 Price Changed $258,990 NTREIS
- 2026-04-22 Relisted — NTREIS
- 2026-03-11 Pending — NTREIS
- 2025-12-12 Listed $275,544 NTREIS
Cash-flow waterfall
monthlySold comps — $/sqft
last 12 mo · ≤1 miLoading sold comps…