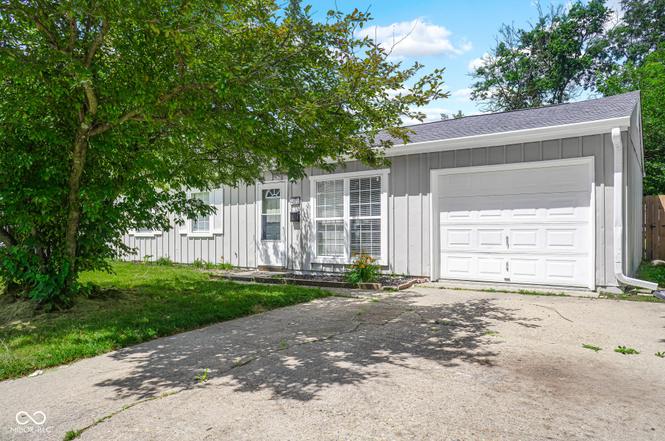
4072 Arborcrest Dr · Indianapolis city (balance), IN
Flood risk 1/10 · Minimal
- FEMA flood zone
- X (unshaded)
- Chance of flooding over 30 yrs
- 0.0%
- Est. flood insurance / yr
- $507 – $1,088
Fire risk 1/10 · Minimal
- Est. fire insurance / yr
- $717 – $1,331
Heat risk 3/10 · Minor
- Hot days now (above 101°F)
- 7 days/yr
- Hot days in 30 yrs
- 18 days/yr
Wind risk 2/10 · Minimal
- Chance of severe wind over 30 yrs
- 0.0%
Air-quality risk 3/10 · Minor
- Unhealthy air days now
- 3 days/yr
- Unhealthy air days in 30 yrs
- 4 days/yr
Risk factors via First Street. Map © Google.
Why this score? — see what drove the C- grade
The composite is a weighted blend of 9 inputs, each scored 0–100. Each bar is that input's sub-score; the figure is the points it added to the 100-point composite (weight × sub-score).
- Cash flow +20.2/30.0
- ARV discount +9.1/15.0
- DSCR +6.4/10.0
- 1% rule +5.2/10.0
- Rent growth +4.2/5.0
- Livability +2.5/5.0
- Condition / age +2.5/5.0
- Schools +1.4/10.0
- Appreciation +0.0/10.0
$135,000
🖨 Deal sheet (PDF) 📄 Offer letter ✓ Due diligence
Listing remarks MLS
3BD/1BA ranch. Large living room and a nice eat-in kitchen! Spacious back yard that is fully fenced-in with a mini-barn. Located close to I-465 and 70.
Key facts
- Well maintained home
- Updated blinds
- New oven
Tags
Property features AI
Finance
- Other: Property sits on about 0.17 acres (< 1/4 acre)
Exterior
- Parking: Attached garage (1-car, approximately 288 sq ft)
- Utilities: Public water; Municipal sewer connected; Electricity connected; Natural gas connected
- Home design: Single-family residence; One level
- Construction: Aluminum siding; Slab foundation
- Exterior features: Front porch; Mini barn; Full yard fencing
Interior
- Kitchen: Eat-in kitchen; Gas water heater
- Bedrooms: Three bedrooms on the main level (examples of room sizes: 12x10, 12x9, 10x9)
- Bathrooms: One full bathroom on the main level
- Heating & cooling: Forced air heating (natural gas); Central air conditioning
- Interior features: Attic access; Eat-in kitchen
- Laundry & utility: Natural gas heating (forced air)
Neighborhood map
What this means for you Summary
Snapshot
- This is a 3-bed/1.0-bath single-family listed at $135k.
Deal economics
- At list price, monthly cash flow is $171 ($2k/yr) — positive.
- The deal already cash-flows at list — no discount required.
- Meets the 1% rule at list price ($1k rent vs $135k).
- Cap rate 7.8% vs local median 4.4% in Indianapolis city (balance) — top-decile yield for the area; either an underpriced asset or a hidden risk that comps aren't pricing in. Stress-test before assuming the spread holds.
Location & tenants
- Location reads: area grade C — affects rentability + tenant quality, not the cash-flow math above.
- Indianapolis Public Schools (urban): math 14% / reading 20% proficiency, ranked #286 of 301 in IN (top 95%) — low school quality limits family demand, transient renter base, plan for 1-2y turnover; 77% free/reduced lunch — lower-income household profile, screen leases tightly.
- Market conditions: Rents rising fast (+6.8%/yr); 153 active listings in the ZIP; 22 comparable units currently listed for rent nearby; rentals at typical pace (median 25d on market — plan ~3-4 weeks tenant-placement turnaround); 1,906 units permitted in Marion County in 2024 (621 in 5+ unit buildings).
- This rent runs 33% of the median local income ($50k/yr) — at the standard rent-burdened threshold; future hikes will face affordability resistance.
Forward outlook
- Local home prices are declining (-3.0%/yr); year-one equity from $933 of loan paydown is wiped out by about $4k of value loss. Plan a longer hold.
- Marion County population projected at +18% by 2050 — long-run rental-demand tailwind backs the buy-and-hold thesis.
- At projected returns (-3.0% appreciation + 6.8% rent growth), your $38k cash investment doubles in ~10 years — after that, you're playing with house money.
Negotiation context
- Only 2 days on market — expect competitive offers; lowballing is unlikely to land.
- 9 sale attempts since 26y ago with the ask held roughly flat each time — persistent listings suggest the price (not the market) is what's stuck; bring a comps-based counter.
- Current owner paid $53k; list at $135k implies a 155% gain — meaningful room to come down on a strong offer.
Questions for the listing agent
- Built in 1962 — when were the roof, HVAC, electrical panel, plumbing, and water heater last replaced?
- Is there a deadline driving the sale (1031 exchange, divorce, estate, relocation)? That informs how much negotiation room exists.
- What's the average days-on-market for RENTAL listings here right now (not sales)? A rising rental-DOM trend means longer vacancies and softer asking-rent achievability than the comps imply.
- What's the recent tenant-quality profile in this submarket — average credit score on applications, eviction rate, late-payment / NSF rate, and stable-employment percentage? A property-management company in the area should have these aggregated.
- How much new for-sale + rental construction is in the pipeline within 1–3 miles? Heavy new supply typically softens prices + rents 12–24 months out; constrained supply supports both.
Investment metrics
- 1% rule
- 1.02% ✓
- Cap rate
- 7.82%
- Cash-on-cash
- 5.44%
- DSCR
- 1.24
- GRM
- 8.2
CMA / ARV
- ARV (on-the-fly)
- $139,968
- Comps found
- 12
Show comp detail 12 sales within ~0.75 mi
| Address | Dist | Beds/Ba | Sqft | Sold | Price | $/sf | Match |
|---|---|---|---|---|---|---|---|
| 8246 E 41st Pl | 0.09mi | 3/1.0 | 864 (0%) | 1mo | $120,500 | $139 | 96 |
| 8340 E 41st Pl | 0.15mi | 3/1.0 | 864 (0%) | 1mo | $140,000 | $162 | 92 |
| 3965 Alsace Pl | 0.20mi | 3/1.0 | 864 (0%) | 9mo | $189,000 | $219 | 83 |
| 8242 E 42nd St | 0.14mi | 3/1.5 | 936 (+8%) | 2mo | $165,000 | $176 | 76 |
| 8508 Georgiana Ln | 0.39mi | 3/1.0 | 864 (0%) | 14mo | $150,000 | $174 | 70 |
| 8442 Georgiana Ln | 0.41mi | 3/1.0 | 864 (0%) | 19mo | $66,000 | $76 | 65 |
| 4103 Aspen Way | 0.17mi | 3/1.0 | 936 (+8%) | 16mo | $140,000 | $150 | 65 |
| 8724 Montery Rd | 0.47mi | 3/1.0 | 925 (+7%) | 2mo | $134,900 | $146 | 65 |
| 3938 Biscayne Rd | 0.53mi | 3/1.0 | 925 (+7%) | 1mo | $132,000 | $143 | 63 |
| 3703 Dubarry Rd | 0.65mi | 3/1.0 | 925 (+7%) | 13mo | $150,000 | $162 | 47 |
| 8908 Elmonte Dr | 0.63mi | 3/1.0 | 925 (+7%) | 16mo | $132,500 | $143 | 46 |
| 8209 E 36th Pl | 0.63mi | 3/2.0 | 959 (+11%) | 16mo | $191,000 | $199 | 35 |
Match score weights: distance 35% · size 25% · config 20% · recency 20%. Top-matched comps best support the ARV.
Projected returns pro-forma
-3.0% appreciation · 6.76% rent growth · sell at horizon
- IRR
- -3.8%
- Equity multiple
- 0.85×
- Total profit
- $-5,541
- Equity at exit
- $20,129
- IRR
- 9.7%
- Equity multiple
- 1.88×
- Total profit
- $33,279
- Equity at exit
- $11,672
Cash invested: $37,800 (down + closing). Projections, not guarantees.
Landlord ↔ Tenant lean methodology
- Overall (STATE)
- 90 Strongly Landlord-Friendly
- State Indiana
- 90 Strongly Landlord-Friendly · R+11
- County
- — inherits STATE
- City
- — inherits STATE
ZIP-level market 46226
- Rents YoY
- 6.8%
- Active inventory
- 153
- Price-to-rent
- 8.2×
Monthly cashflow live
- Estimated rent
- $1,379 high interval (Pro) →
- Mortgage (P&I)
- −$708
- Tax from tax record
- −$154 /mo · $1,850/yr
- Insurance
- −$56
- HOA
- −$0
- Vacancy / Maint / Mgmt
- −$290
- Net cashflow
- $171
Break-even live
Sensitivity live
| Price | -10% $248 | -5% $209 | +0% $171 | +5% $133 | +10% $95 |
|---|---|---|---|---|---|
| Rent | -10% $62 | -5% $117 | +0% $171 | +5% $226 | +10% $280 |
| Rate | -1.0pp $239 | -0.5pp $206 | base $171 | +0.5pp $136 | +1.0pp $101 |
UW: 25.0% down · 7.5% · 30yr · 1.5% tax · 5.0% vac · 8.0% maint · 8.0% mgmt
Financing live
Cash to close
- Down payment
- $33,750
- Closing costs
- $4,050
- Reserves months
- —
- Total cash needed
- —
Loan-product check · same deal, 3 products live
Conventional
25% down · 7.5% · 30yr
- Down + closing
- —
- Monthly P&I
- —
- Monthly cashflow
- —
- DSCR
- —
- Eligible?
- —
Personal DTI + credit; lowest rate.
DSCR
20% down · 8.5% · 30yr
- Down + closing
- —
- Monthly P&I
- —
- Monthly cashflow
- —
- DSCR
- —
- Eligible?
- —
No personal income docs; deal must DSCR.
Hard money
10% down · 12.0% · 12mo
- Down + closing
- —
- Monthly P&I
- —
- Monthly cashflow
- —
- DSCR
- —
- Eligible?
- —
Short-term bridge; refi at stabilization.
Rent comps 22 comps
| Address | Beds | Baths | Sqft | Rent | $/sqft | DOM | Units | Dist |
|---|---|---|---|---|---|---|---|---|
| 4315 Aspen Way Indianapolis, IN | 3.0 | 1.0 | 1080 | $1,380 | $1.28 | 45d | 1 | 0.32mi |
| 7925 Crossbridge Dr Indianapolis, IN | 2.0 | 2.0 | 1072 | $1,200 | $1.12 | 45d | 1 | 0.38mi |
| 8124 E 37th Pl Indianapolis, IN | 3.0 | 1.0 | 925 | $1,350 | $1.46 | 0d | 1 | 0.45mi |
| 7975 Red Mill Dr Indianapolis, IN | 2.0 | 1.0 | 576 | $975 | $1.69 | 45d | 1 | 0.47mi |
| 8724 Montery Rd Indianapolis, IN | 3.0 | 1.0 | 925 | $1,500 | $1.62 | 45d | 1 | 0.48mi |
| 3938 Biscayne Rd Indianapolis, IN | 3.0 | 1.0 | 1000 | $1,895 | $1.90 | 4d | 1 | 0.54mi |
| 8862 Bel Air Ct Indianapolis, IN | 3.0 | 1.0 | 1073 | $1,264 | $1.18 | 19d | 1 | 0.63mi |
| 3809 Biscayne Rd Indianapolis, IN | 2.0 | 1.5 | 992 | $1,020 | $1.03 | 16d | 1 | 0.63mi |
| 9060 E 39th Pl Indianapolis, IN | 1.0–2.0 | 1.0–1.5 | 820 | $1,040 | $1.27 | 25d | 1 | 0.84mi |
| 3631 Decamp Dr Indianapolis, IN | 3.0 | 1.0 | 1000 | $1,335 | $1.33 | 25d | 1 | 0.84mi |
| 7838 Ridgewood Dr Indianapolis, IN | 3.0 | 2.0 | 936 | $1,540 | $1.65 | 45d | 1 | 1.11mi |
| 7838 Ridgewood Dr Indianapolis, IN | 3.0 | 2.0 | 936 | $1,540 | $1.65 | 25d | 1 | 1.11mi |
| 3775 Allerton Pl Indianapolis, IN | 1.0–4.0 | 2.0 | 1068 | $1,617 | $1.51 | 15d | 1 | 1.15mi |
| 9438 Conried Dr Indianapolis, IN | 3.0 | 1.0 | 1094 | $1,445 | $1.32 | 5d | 1 | 1.15mi |
| 9226 E 36th Pl Indianapolis, IN | 3.0 | 1.0 | 1073 | $1,250 | $1.16 | 9d | 1 | 1.19mi |
| 3226 Wellington Ave Indianapolis, IN | 3.0 | 1.0 | 900 | $1,149 | $1.28 | 12d | 1 | 1.20mi |
| 9519 Conried Dr Indianapolis, IN | 3.0 | 1.0 | 925 | $1,275 | $1.38 | 0d | 1 | 1.25mi |
| 3900 N Shadeland Ave Indianapolis, IN | 1.0–2.0 | 1.0 | 1070 | $1,075 | $1.00 | 4d | 6 | 1.29mi |
| 7171 Twin Oaks Dr Indianapolis, IN | 3.0 | 1.0–1.5 | 801 | $1,399 | $1.75 | 25d | 9 | 1.29mi |
| 3525 Luewan Ct Indianapolis, IN | 4.0 | 1.0 | 1107 | $1,750 | $1.58 | 25d | 1 | 1.37mi |
| 3519 Jerome Ct Indianapolis, IN | 4.0 | 1.0 | 1107 | $1,995 | $1.80 | 25d | 1 | 1.41mi |
| 3962 Strathmore Dr Indianapolis, IN | 3.0 | 1.0 | 925 | $1,250 | $1.35 | 25d | 1 | 1.46mi |
Listing history 4 events
-
2026-06-19status $135,000 Pending 2 DOM
-
2026-06-18days on market $135,000 Active 2 DOM
-
2026-06-17remarks 699-char remark
-
2026-06-17$135,000 Active 1 DOM
ⓘ Source: listings_history table (triggers on properties + properties_extension) + one-shot
backfill from property_details.listing_events for pre-trigger history.
Tax reassessment forecast IN · Partial reset (capped growth)
- Current annual tax
- $1,850 · $154/mo
- Projected year-2 tax
- $1,850 · $154/mo
- Expected delta
- $0/yr ($0/mo · 0.0%)
ⓘ Screening estimate from a state-policy table — verify with the county assessor before closing.
Climate risk First Street
- Flood 1/10 Low FEMA zone X (unshaded) · 0% chance over 30 yrs
- Wildfire 1/10 Low
- Heat 3/10 Moderate 7 d/yr ≥101°F today · 18 d/yr by 30 yrs out
- Wind 2/10 Low 0% chance of damaging wind over 30 yrs
- Air quality 3/10 Moderate 3 unhealthy d/yr today · 4 by 30 yrs out
Nearby sold comps map
Loading sold comps map…
Walkable amenities ~0.75 mi
Loading nearby amenities…
Taxation est. · year 1
- Rental income
- $16,551
- − Mortgage interest
- −$7,562
- − Property taxes
- −$1,850
- − Insurance
- −$675
- − Repairs & maintenance
- −$1,324
- − Management
- −$1,324
- − Depreciation
- −$3,927
- Taxable loss
- −$111
- Est. tax savings @ 24.0%
- +$27
- After-tax cash flow
- $2,082/yr
For passive investors: Depreciation is non-cash, so a rental often shows a tax loss while cash-flowing — sheltering income. Rental losses are passive: they offset passive income freely, and up to $25,000/yr can offset ordinary (W-2) income if you actively participate and your MAGI is under $100k (phasing out to $0 by $150k); unused losses carry forward. On sale, claimed depreciation is recaptured at up to 25%, and gains may owe capital-gains tax (a 1031 exchange can defer both). Figures are a year-1 estimate at your 24.0% rate — not tax advice; consult a CPA.
Schools (NCES district)
- District
- Indianapolis Public Schools
- NCES district ID
- 1804770
- Math proficiency
- 14% ▼ -7.00%
- Reading proficiency
- 20% ▼ -3.00%
- Median HH income
- $32,034
- Composite
- 13.69/100
- National rank
- #9499
- State rank
- #286 of 301 in IN
Livability — Indianapolis city (balance)
No livability data for this city. (Only ~50 U.S. cities are tracked.)
Census & demographics
- Census place
- Indianapolis city (balance), IN
- County
- Marion County · 998,460 people
- City population
- 881,119
- Metro
- Indianapolis-Carmel-Anderson, IN
- Population (ZIP)
- 47,099
- Household income
- $50,325
- Rent vs Own
- Severe rent burden
- 2742.0
Population outlook (Marion County) Hauer SSP2
- Today (2025)
- 1,025,572 people
- By 2030
- 1,065,727 · +3.9%
- By 2040
- 1,141,577 · +11.3%
- By 2050
- 1,208,920 · +17.9%
- By 2075
- 1,367,288 · +33.3%
- By 2100
- 1,438,201 · +40.2%
Race, ethnicity, and origin ACS 2023
- Neighborhood character
- Diverse neighborhood (Simpson 0.62)
- Race & ethnicity
- Black 53% White 25% Hispanic / Latino 17% Two or more races 9% Asian 2%
- Hispanic origin (detail)
- Mexican 11%
- Common ancestry
- Lithuanian 1% Italian 1% Romanian 1%
- Foreign-born
- 11% · Canada
- Languages at home
- 86% English-only · Spanish 10% French/Haitian/Cajun 1% Other Asian/Pacific 1%
Political lean MEDSL · Marion
- 2024 margin
- Strong D (+27.7) · D 63.0% · R 35.3% · Other 1.7%
- 2008→2024 swing
- -0.7pp no change · 2008: 28.4pp · 2024: 27.7pp
- All cycles
- 2024: D+27.7 2020: D+29.1 2016: D+22.8 2012: D+22.2 2008: D+28.4
Not yet ingested
- Civics
- —
Market trends
- HPI YoY
- ▼ -218.85%
- Current HPI
- 239.43
- Rent YoY
- ▲ 6.76%
- Metro
- Indianapolis-Carmel-Anderson, IN
- State GDP YoY
- ▲ 2.90%
- F500 in state
- 18
Industry mix (Fortune 500 HQ in IN)
| Industry | F500 HQs | Revenue |
|---|---|---|
| Industrial Machinery | 2 | $37B |
|
||
| Healthcare | 1 | $177B |
|
||
| Pharmaceuticals | 1 | $45B |
|
||
| Metals / Steel | 1 | $18B |
|
||
| Agriculture | 1 | $17B |
|
||
| Packaging | 1 | $12B |
|
||
Price history
+100.0% since first listed19 events — show timeline
- 2026-06-16 Listed $135,000 MIBOR as Distributed by MLS Grid
- 2018-09-11 Sold (MLS) $53,000 MIBOR as Distributed by MLS Grid
- 2018-08-09 Pending — MIBOR as Distributed by MLS Grid
- 2018-08-02 Listed $59,900 MIBOR as Distributed by MLS Grid
- 2018-07-31 Listing Removed — MIBOR as Distributed by MLS Grid
- 2018-05-11 Relisted — MIBOR as Distributed by MLS Grid
- 2018-05-03 Pending — MIBOR as Distributed by MLS Grid
- 2018-04-19 Listed $59,900 MIBOR as Distributed by MLS Grid
- 2011-09-26 Listing Removed — MIBOR as Distributed by MLS Grid
- 2011-09-21 Sold (MLS) $26,300 MIBOR as Distributed by MLS Grid
- 2011-08-10 Listed $29,900 MIBOR as Distributed by MLS Grid
- 2007-02-16 Sold (MLS) $35,900 MIBOR as Distributed by MLS Grid
- 2006-12-27 Listed $36,900 MIBOR as Distributed by MLS Grid
- 2005-05-23 Sold (MLS) $80,000 MIBOR as Distributed by MLS Grid
- 2005-01-28 Listed $82,900 MIBOR as Distributed by MLS Grid
- 2003-10-15 Listing Removed — MIBOR as Distributed by MLS Grid
- 2003-05-01 Listed $67,500 MIBOR as Distributed by MLS Grid
- 2001-03-31 Listing Removed — MIBOR as Distributed by MLS Grid
- 2000-10-16 Listed $67,500 MIBOR as Distributed by MLS Grid
Property tax history
+15.8%/yrLatest (2025): $1,850 · +8.6% YoY. Source: county tax records.
Cash-flow waterfall
monthlySold comps — $/sqft
last 12 mo · ≤1 miLoading sold comps…