 Multi-family
0 Southlawn Package · Amarillo, TX
Flood risk 4/10 · Minor
- FEMA flood zone
- X (unshaded)
- Chance of flooding over 30 yrs
- 0.22%
- Est. flood insurance / yr
- $507 – $1,088
Fire risk 8/10 · Major
- Est. fire insurance / yr
- $1,222 – $2,270
Heat risk 4/10 · Minor
- Hot days now (above 97°F)
- 7 days/yr
- Hot days in 30 yrs
- 20 days/yr
Wind risk 2/10 · Minimal
- Chance of severe wind over 30 yrs
- —
Air-quality risk 2/10 · Minimal
- Unhealthy air days now
- 1 days/yr
- Unhealthy air days in 30 yrs
- 1 days/yr
Risk factors via First Street. Map © Google.
Why this score? — see what drove the C grade
The composite is a weighted blend of 9 inputs, each scored 0–100. Each bar is that input's sub-score; the figure is the points it added to the 100-point composite (weight × sub-score).
- Cash flow +23.3/30.0
- DSCR +7.5/10.0
- ARV discount +7.5/15.0
- 1% rule +6.1/10.0
- Rent growth +4.0/5.0
- Schools +3.6/10.0
- Livability +3.3/5.0
- Condition / age +2.8/5.0
- Appreciation +0.0/10.0
$950,000
🖨 Deal sheet 📄 Offer letter ✓ Due diligence
Multi-family units
County records classify this as Multi-Family (2-4 Unit). Listing-text estimate: 1 unit. estimate disagrees with records
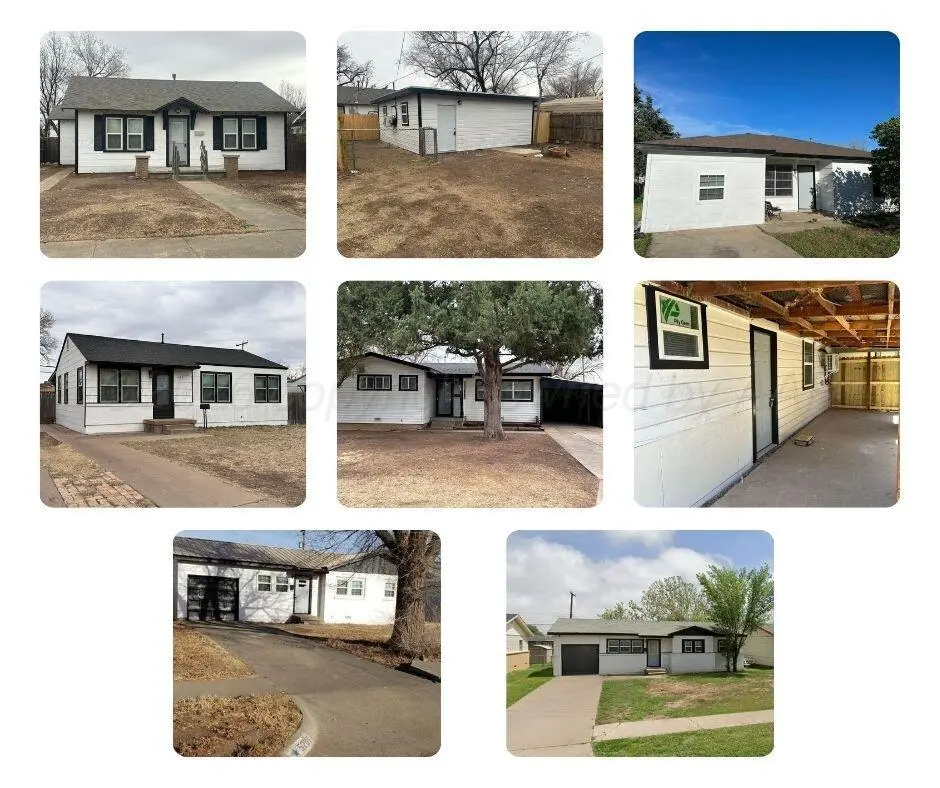
Listing remarks
Needing to do a 1031 exchange or looking for a great investment portfolio? Look no further! 6 addresses, 8 doors, all remodeled inside and out. 3705 S Tyler St (2 Units: 3/1, 1/1), 4121 S Hayden St (3/1), 4303 S Hayden St (3/1), 4424 S Lipscomb St (2 Units: 3/1.5, 1/1), 5201 Parker St (3/1), 5207 Parker St (3/1) Rent roll available upon request. All properties are occupied- NO TRESPASSING.
Key facts
- Built 1980
- Listed 41 days
Neighborhood map
What this means for you Summary
Snapshot
- This is a multifamily listed at $950k. Condition is rated average.
Deal economics
- At list price, monthly cash flow is $2k ($21k/yr) — positive.
- The deal already cash-flows at list — no discount required.
- Meets the 1% rule at list price ($11k rent vs $950k).
- Recommended offer: $922k (3.0% below list) — sets the bar for market timing.
Location & tenants
- Location reads 66/100 on livability (#624 in TX) — a middle-class / working-renter tenant base. Strengths: cost of living A+, housing A+; Watch: amenities C-, schools D, crime F.
- Amarillo ISD (urban): math 44% / reading 41% proficiency, ranked #336 of 826 in TX (top 41%) — families likely to look elsewhere, expect single-tenant / working-renter base with shorter leases.
- Market conditions: Rents rising fast (+6.0%/yr); 65 active listings in the ZIP; 15 comparable units currently listed for rent nearby; rentals at typical pace (median 21d on market — plan ~3-4 weeks tenant-placement turnaround); 47% of comp listings sitting > 30 days — soft ceiling on asking rent; 1,214 units permitted in Potter County in 2024 (650 in 5+ unit buildings).
- At $10,521/mo this rent would consume 189% of the median local household income ($67k/yr) (locally 208% of renters already pay >50% of income on rent) — very limited rent-growth headroom before tenants either downsize or default.
Forward outlook
- Local home prices are declining (-3.0%/yr); year-one equity from $7k of loan paydown is wiped out by about $28k of value loss. Plan a longer hold.
- At projected returns (-3.0% appreciation + 6.0% rent growth), your $266k cash investment doubles in ~9 years — after that, you're playing with house money.
Negotiation context
- It's been on market 42 days — a 3% lower offer ($922k) is reasonable based on typical stale-listing flexibility.
Risks & watch-outs
- Climate carrying-cost: severe wildfire risk — expect insurance premiums to compound above CPI over the hold.
Questions for the listing agent
- It's been on market 42 days. Have you received any prior offers? Is the seller open to a 3% concession, seller financing, or rate buy-down credit?
- Is there a deadline driving the sale (1031 exchange, divorce, estate, relocation)? That informs how much negotiation room exists.
- Schools are D-rated, which usually means shorter tenancies and higher turnover. Who's the typical renter profile here, and what's been the actual vacancy rate?
- Crime grade is F in this area — have there been break-ins, vandalism, or insurance claims at this property in the last 3 years? What carrier currently insures it and at what premium?
- What's the average days-on-market for RENTAL listings here right now (not sales)? A rising rental-DOM trend means longer vacancies and softer asking-rent achievability than the comps imply.
- What's the recent tenant-quality profile in this submarket — average credit score on applications, eviction rate, late-payment / NSF rate, and stable-employment percentage? A property-management company in the area should have these aggregated.
- How much new apartment / multifamily construction is in the pipeline within 1–3 miles? Heavy new supply (>2% of stock underway) typically softens rents 12–24 months out; light construction supports rent growth.
Investment metrics
- 1% rule
- 1.11% ✓
- Cap rate
- 8.50%
- Cash-on-cash
- 7.88%
- DSCR
- 1.35
- GRM
- 7.5
CMA / ARV
No comps found within radius.
Projected returns pro-forma
-3.0% appreciation · 6.04% rent growth · sell at horizon
- IRR
- -0.9%
- Equity multiple
- 0.96×
- Total profit
- $-9,397
- Equity at exit
- $141,648
- IRR
- 11.8%
- Equity multiple
- 2.05×
- Total profit
- $280,525
- Equity at exit
- $82,139
Cash invested: $266,000 (down + closing). Projections, not guarantees.
Landlord ↔ Tenant lean methodology
- Overall (STATE)
- 87 Strongly Landlord-Friendly
- State Texas
- 87 Strongly Landlord-Friendly · R+5
- County
- — inherits STATE
- City
- — inherits STATE
ZIP-level market 79110
- Rents YoY
- 6.0%
- Active inventory
- 65
- Price-to-rent
- 52.7×
Monthly cashflow live
- Estimated rent
- $10,521 high interval (Pro) →
- Mortgage (P&I)
- −$4,982
- Tax est. 1.5%
- −$1,188 /mo · $14,250/yr
- Insurance
- −$396
- HOA
- −$0
- Vacancy / Maint / Mgmt
- −$2,209
- Net cashflow
- $1,746
Break-even live
7-unit breakdown (identical units grouped — click to expand)
| Units | Beds | Baths | Est. rent |
|---|---|---|---|
| 6× units | 3 | 1 | $9,018 |
| #1 | 3 | 1 | $1,503 |
| #2 | 3 | 1 | $1,503 |
| #3 | 3 | 1 | $1,503 |
| #4 | 3 | 1 | $1,503 |
| #6 | 3 | 1 | $1,503 |
| #7 | 3 | 1 | $1,503 |
| 1× unit | 3 | 1.5 | $1,503 |
| Total (7 units) | $10,521 | ||
UW: 25.0% down · 7.5% · 30yr · 1.5% tax · 5.0% vac · 8.0% maint · 8.0% mgmt
Financing live
Cash to close
- Down payment
- $237,500
- Closing costs
- $28,500
- Reserves months
- —
- Total cash needed
- —
Loan-product check · same deal, 3 products live
Conventional
25% down · 7.5% · 30yr
- Down + closing
- —
- Monthly P&I
- —
- Monthly cashflow
- —
- DSCR
- —
- Eligible?
- —
Personal DTI + credit; lowest rate.
DSCR
20% down · 8.5% · 30yr
- Down + closing
- —
- Monthly P&I
- —
- Monthly cashflow
- —
- DSCR
- —
- Eligible?
- —
No personal income docs; deal must DSCR.
Hard money
10% down · 12.0% · 12mo
- Down + closing
- —
- Monthly P&I
- —
- Monthly cashflow
- —
- DSCR
- —
- Eligible?
- —
Short-term bridge; refi at stabilization.
Rent comps 15 comps
| Address | Beds | Baths | Sqft | Rent | $/sqft | DOM | Units | Dist |
|---|---|---|---|---|---|---|---|---|
| 6801 Wolflin Ave Amarillo, TX | 1.0–2.0 | 1.0–2.0 | 806 | $1,065 | $1.32 | 13d | 7 | 0.37mi |
| 1950 Howard Dr Unit 1952 Amarillo, TX | 2.0 | 1.0 | 1079 | $1,100 | $1.02 | 43d | 1 | 0.46mi |
| 1950 Howard Dr Unit 1950 Amarillo, TX | 2.0 | 1.0 | 1079 | $1,050 | $0.97 | 43d | 1 | 0.46mi |
| 1910 Howard Dr Amarillo, TX | 2.0 | 1.0 | 1055 | $1,150 | $1.09 | 43d | 1 | 0.51mi |
| 1921 Gregory Dr Amarillo, TX | 2.0 | 1.0 | 934 | $899 | $0.96 | 13d | 1 | 0.55mi |
| 1917 Gregory Dr Amarillo, TX | 2.0 | 1.0 | 928 | $899 | $0.97 | 13d | 1 | 0.55mi |
| 1915 Gregory Dr Amarillo, TX | 2.0 | 1.0 | 928 | $899 | $0.97 | 13d | 1 | 0.56mi |
| 7603 Canode Dr Amarillo, TX | 3.0 | 2.0 | 1739 | $2,200 | $1.27 | 13d | 1 | 0.88mi |
| 7727 Cervin Dr Amarillo, TX | 2.0 | 2.0 | 1696 | $2,200 | $1.30 | 43d | 1 | 1.01mi |
| 1509 Bell St Amarillo, TX | 3.0 | 2.0 | 1407 | $1,745 | $1.24 | 21d | 1 | 1.12mi |
| 2303 Larry St Amarillo, TX | 3.0 | 2.0 | 1522 | $1,900 | $1.25 | 13d | 1 | 1.23mi |
| 2801 Ranch House Rd Amarillo, TX | 3.0 | 2.0 | 1205 | $2,100 | $1.74 | 43d | 1 | 1.33mi |
| 8910 Hockley St Amarillo, TX | 2.0 | 2.0 | 1005 | $1,850 | $1.84 | 43d | 1 | 1.38mi |
| 2808 Haystack Way Amarillo, TX | 2.0 | 2.0 | 1010 | $1,850 | $1.83 | 43d | 1 | 1.42mi |
| 5117 SW 16th Ave Amarillo, TX | 3.0 | 2.0 | 1513 | $1,745 | $1.15 | 21d | 1 | 1.47mi |
Listing history 13 events
-
2026-06-15days on market $950,000 Active 42 DOM
-
2026-06-14days on market $950,000 Active 40 DOM
-
2026-06-13days on market $950,000 Active 39 DOM
-
2026-06-10days on market $950,000 Active 37 DOM
-
2026-06-09days on market $950,000 Active 36 DOM
-
2026-06-08days on market $950,000 Active 35 DOM
-
2026-06-07days on market $950,000 Active 34 DOM
-
2026-06-03days on market $950,000 Active 30 DOM
-
2026-06-02days on market $950,000 Active 29 DOM
-
2026-06-01days on market $950,000 Active 28 DOM
-
2026-05-31days on market $950,000 Active 27 DOM
-
2026-05-30days on market $950,000 Active 26 DOM
-
2026-05-04$950,000 Active 393-char remark
ⓘ Source: listings_history table (triggers on properties + properties_extension) + one-shot
backfill from property_details.listing_events for pre-trigger history.
Climate risk First Street
- Flood 4/10 Moderate FEMA zone X (unshaded) · 22% chance over 30 yrs
- Wildfire 8/10 Severe
- Heat 4/10 Moderate 7 d/yr ≥97°F today · 20 d/yr by 30 yrs out
- Wind 2/10 Low
- Air quality 2/10 Low 1 unhealthy d/yr today · 1 by 30 yrs out
Nearby sold comps map
Loading sold comps map…
Walkable amenities ~0.75 mi
Loading nearby amenities…
Taxation est. · year 1
- Rental income
- $126,252
- − Mortgage interest
- −$53,215
- − Property taxes
- −$14,250
- − Insurance
- −$4,750
- − Repairs & maintenance
- −$10,100
- − Management
- −$10,100
- − Depreciation
- −$27,636
- Taxable income
- $6,201
- Est. tax owed @ 24.0%
- −$1,488
- After-tax cash flow
- $19,468/yr
For passive investors: Depreciation is non-cash, so a rental often shows a tax loss while cash-flowing — sheltering income. Rental losses are passive: they offset passive income freely, and up to $25,000/yr can offset ordinary (W-2) income if you actively participate and your MAGI is under $100k (phasing out to $0 by $150k); unused losses carry forward. On sale, claimed depreciation is recaptured at up to 25%, and gains may owe capital-gains tax (a 1031 exchange can defer both). Figures are a year-1 estimate at your 24.0% rate — not tax advice; consult a CPA.
Condition & rehab AI · 11 photos
The property requires moderate repairs and maintenance, including painting and landscaping, to improve its condition and resale/rental value.
Repairs flagged
- Moderate Exterior siding — Some discoloration and wear visible on the white siding.
- Moderate Interior drywall — Exposed framing and drywall in unfinished areas.
- Minor Landscaping — Minimal landscaping with dry grass and a tree in the front yard.
Value-add opportunities
- Resale Paint exterior siding — Fresh paint can significantly improve the curb appeal and resale value.
- Resale Paint interior drywall — Fresh paint can improve the interior appearance and resale value.
- Both Landscaping — Improved landscaping can enhance curb appeal and attract potential tenants.
Renovation cost estimate screening
| Repair item | Severity | Est. cost |
|---|---|---|
| Exterior siding · Some discoloration and wear visible on the white siding. | Moderate | $3,000–15,000 |
| Interior drywall · Exposed framing and drywall in unfinished areas. | Moderate | $3,000–15,000 |
| Landscaping · Minimal landscaping with dry grass and a tree in the front yard. | Minor | $500–3,000 |
| Total estimated repair cost · 3 items | $6,500–33,000 |
Value-add ROI direction
- Resale Paint exterior siding — Fresh paint can significantly improve the curb appeal and resale value. ↑
- Resale Paint interior drywall — Fresh paint can improve the interior appearance and resale value. ↑
- Both Landscaping — Improved landscaping can enhance curb appeal and attract potential tenants. ↑
ⓘ Cost ranges are severity-bucket heuristics (US national rule-of-thumb). Get contractor quotes + a written scope before underwriting a rehab budget.
Schools (NCES district)
- District
- Amarillo ISD
- NCES district ID
- 4808130
- Math proficiency
- 44% ▼ -9.00%
- Reading proficiency
- 41% ▼ -3.00%
- Median HH income
- $43,478
- Composite
- 35.96/100
- National rank
- #4798
- State rank
- #336 of 826 in TX
Livability — Amarillo
- Score
- 66/100
- State rank
- #624
- US rank
- #11876
Category grades
Schools grade is shown separately in the Schools card above.
Census & demographics
- Census place
- Amarillo, TX
- County
- Randall County · 137,351 people
- City population
- 185,802
- Metro
- Amarillo, TX
- Population (ZIP)
- 16,994
- Household income
- $66,683
- Rent vs Own
- Severe rent burden
- 208.0
Population outlook (Potter County) Hauer SSP2
- Today (2025)
- 121,296 people
- By 2030
- 120,883 · -0.3%
- By 2040
- 119,668 · -1.3%
- By 2050
- 117,788 · -2.9%
- By 2075
- 110,250 · -9.1%
- By 2100
- 92,923 · -23.4%
Race, ethnicity, and origin ACS 2023
- Neighborhood character
- Majority White (61%)
- Race & ethnicity
- White 61% Hispanic / Latino 32% Two or more races 13% Black 4% Asian 1%
- Hispanic origin (detail)
- Mexican 29%
- Common ancestry
- Italian 2% Slovak 1% Lithuanian 1%
- Foreign-born
- 5% · Canada, Vietnam
- Languages at home
- 83% English-only · Spanish 13% Other Indo-European 2% Other Asian/Pacific 1%
Political lean MEDSL · Potter
- 2024 margin
- Solid R (+44.4) · D 27.3% · R 71.7% · Other 1.1%
- 2008→2024 swing
- -5.0pp toward R · 2008: -39.4pp · 2024: -44.4pp
- All cycles
- 2024: R+44.4 2020: R+38.7 2016: R+41.9 2012: R+44.6 2008: R+39.4
Not yet ingested
- Civics
- —
Market trends
- HPI YoY
- ▼ -226.16%
- Current HPI
- 180.2164
- Rent YoY
- ▲ 6.04%
- Metro
- Amarillo, TX
- State GDP YoY
- ▲ 3.95%
- F500 in state
- 110
Industry mix (Fortune 500 HQ in TX)
| Industry | F500 HQs | Revenue |
|---|---|---|
| Energy | 16 | $1,198B |
|
||
| Technology | 5 | $198B |
|
||
| Engineering / Construction | 4 | $72B |
|
||
| Energy Services | 3 | $60B |
|
||
| Utilities | 3 | $41B |
|
||
| Healthcare | 2 | $330B |
|
||
Cash-flow waterfall
monthlySold comps — $/sqft
last 12 mo · ≤1 miLoading sold comps…