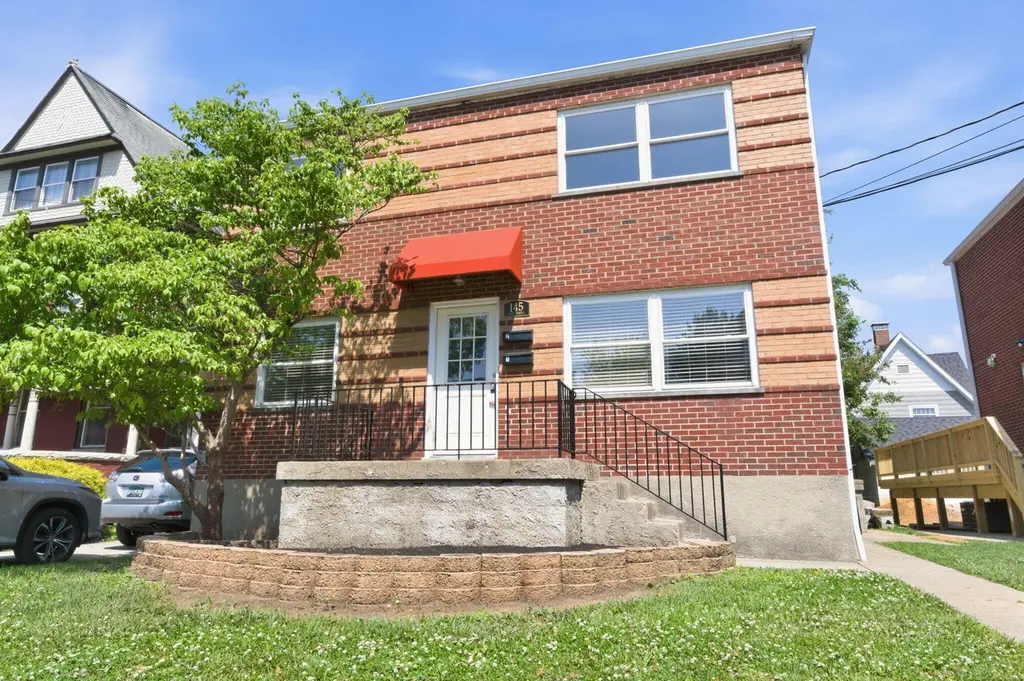
145 Lake St · Bellevue, KY
Flood risk 1/10 · Minimal
- FEMA flood zone
- X (unshaded)
- Chance of flooding over 30 yrs
- 0.0%
- Est. flood insurance / yr
- $507 – $1,088
Fire risk 1/10 · Minimal
- Est. fire insurance / yr
- $839 – $1,559
Heat risk 5/10 · Moderate
- Hot days now (above 103°F)
- 7 days/yr
- Hot days in 30 yrs
- 19 days/yr
Wind risk 2/10 · Minimal
- Chance of severe wind over 30 yrs
- 1.0%
Air-quality risk 3/10 · Minor
- Unhealthy air days now
- 2 days/yr
- Unhealthy air days in 30 yrs
- 3 days/yr
Risk factors via First Street. Map © Google.
Why this score? — see what drove the D grade
The composite is a weighted blend of 9 inputs, each scored 0–100. Each bar is that input's sub-score; the figure is the points it added to the 100-point composite (weight × sub-score).
- Cash flow +14.9/30.0
- ARV discount +7.5/15.0
- DSCR +4.6/10.0
- Livability +4.6/5.0
- 1% rule +3.2/10.0
- Rent growth +2.5/5.0
- Condition / age +2.5/5.0
- Schools +2.2/10.0
- Appreciation +0.0/10.0
$375,000
🖨 Deal sheet (PDF) 📄 Offer letter ✓ Due diligence
Listing remarks MLS
Upgrades, Upgrades, Upgrades. Here is a perfect opportunity to live on one of Bellevue's best streets and have a rental unit to help pay the mortgage. Minutes from downtown and a short walk from restaurants and shops.
Key facts
- Open floor plan
- Turnkey duplex
- Fully updated
Tags
Property features AI
Exterior
- Parking: Driveway; Rear-facing garage; Two garage spaces (2 total parking spaces)
- Utilities: Public water; Public sewer; Natural gas available; Sewer available; Water available
- Home design: Duplex (two levels); Multi-family property; Built in 1951; Has a view; Existing structure
- Construction: Brick construction; Block foundation; Asphalt roof
- Exterior features: Awnings; Vinyl window frames
Interior
- Kitchen: Electric range; Dishwasher; Microwave; Refrigerator
- Bathrooms: Two full bathrooms
- Heating & cooling: Central air conditioning; Forced air heating
- Interior features: Eat-in kitchen; High-speed internet access; Full basement; Fireplace (inoperable)
- Laundry & utility: Laundry on lower level
Neighborhood map
What this means for you Summary
Snapshot
- This is a 4-bed/2.0-bath other listed at $375k.
Deal economics
- At list price, monthly cash flow is $113 ($1k/yr) — positive.
- The deal already cash-flows at list — no discount required.
- To meet the 1% rule (rent ≥ 1% of price), the offer needs to be $307k (18.0% below list).
- Recommended offer: $307k (18.0% below list) — sets the bar for 1% rule.
- Cap rate 6.7% vs local median 4.5% in Bellevue — top-decile yield for the area; either an underpriced asset or a hidden risk that comps aren't pricing in. Stress-test before assuming the spread holds.
Location & tenants
- Location reads 92/100 on livability (#8 in KY, #24 nationally) — a professional / high-income tenant draw. Strengths: crime A+, amenities A+, commute A+.
- Bellevue Independent (suburban): math 17% / reading 33% proficiency, ranked #136 of 165 in KY (top 82%) — low school quality limits family demand, transient renter base, plan for 1-2y turnover.
- Zoned schools: Grandview Elementary School (math 8% / reading 32%, grade F, #568 of 676 statewide, top 84%, 277 students, 65% FRL); Bellevue High School (math 22% / reading 32%, grade F, #158 of 254 statewide, top 68%, 362 students, 61% FRL).
- Market conditions: Rents flat; 49 active listings in the ZIP; 18 comparable units currently listed for rent nearby; rentals leasing fast (median 13d on market — plan ~1-2 weeks tenant-placement turnaround); 247 units permitted in Campbell County in 2024 (77 in 5+ unit buildings).
- At $3,075/mo this rent would consume 52% of the median local household income ($71k/yr) (locally 173% of renters already pay >50% of income on rent) — very limited rent-growth headroom before tenants either downsize or default.
Forward outlook
- Local home prices are declining (-3.0%/yr); year-one equity from $3k of loan paydown is wiped out by about $11k of value loss. Plan a longer hold.
Negotiation context
- It's been on market 33 days — a 3% lower offer ($364k) is reasonable based on typical stale-listing flexibility.
- 3 sale attempts since 25y ago with the ask held roughly flat each time — persistent listings suggest the price (not the market) is what's stuck; bring a comps-based counter.
- Current owner paid $130k; list at $375k implies a 188% gain — meaningful room to come down on a strong offer.
Risks & watch-outs
- Watch-outs: built in 1951 — expect roof / HVAC / electrical / plumbing capex.
- Climate carrying-cost: extreme-heat days projected 7→19/yr by 2055 (HVAC capex compounding) — expect insurance premiums to compound above CPI over the hold.
Questions for the listing agent
- It's been on market 33 days. Have you received any prior offers? Is the seller open to a 18% concession, seller financing, or rate buy-down credit?
- Built in 1951 — when were the roof, HVAC, electrical panel, plumbing, and water heater last replaced?
- Is there a deadline driving the sale (1031 exchange, divorce, estate, relocation)? That informs how much negotiation room exists.
- The area grade is low — what's the realistic commute time and amenity access for the typical tenant pool here? Any planned neighborhood developments (good or bad) we should know about?
- What's the average days-on-market for RENTAL listings here right now (not sales)? A rising rental-DOM trend means longer vacancies and softer asking-rent achievability than the comps imply.
- What's the recent tenant-quality profile in this submarket — average credit score on applications, eviction rate, late-payment / NSF rate, and stable-employment percentage? A property-management company in the area should have these aggregated.
- How much new for-sale + rental construction is in the pipeline within 1–3 miles? Heavy new supply typically softens prices + rents 12–24 months out; constrained supply supports both.
Investment metrics
- 1% rule
- 0.82% ✗
- Cap rate
- 6.65%
- Cash-on-cash
- 1.29%
- DSCR
- 1.06
- GRM
- 10.2
CMA / ARV
No comps found within radius.
Projected returns pro-forma
-3.0% appreciation · 0.19% rent growth · sell at horizon
- IRR
- -17.2%
- Equity multiple
- 0.41×
- Total profit
- $-62,146
- Equity at exit
- $55,914
- IRR
- -14.7%
- Equity multiple
- 0.26×
- Total profit
- $-78,148
- Equity at exit
- $32,423
Cash invested: $105,000 (down + closing). Projections, not guarantees.
Landlord ↔ Tenant lean methodology
- Overall (STATE)
- 83 Strongly Landlord-Friendly
- State Kentucky
- 83 Strongly Landlord-Friendly · R+16
- County
- — inherits STATE
- City
- — inherits STATE
ZIP-level market 41073
- Rents YoY
- 0.2%
- Active inventory
- 49
- Price-to-rent
- 10.2×
Monthly cashflow live
- Estimated rent
- $3,075 high interval (Pro) →
- Mortgage (P&I)
- −$1,967
- Tax from tax record
- −$193 /mo · $2,321/yr
- Insurance
- −$156
- HOA
- −$0
- Vacancy / Maint / Mgmt
- −$646
- Net cashflow
- $113
Break-even live
Sensitivity live
| Price | -10% $325 | -5% $219 | +0% $113 | +5% $7 | +10% $-99 |
|---|---|---|---|---|---|
| Rent | -10% $-130 | -5% $-8 | +0% $113 | +5% $235 | +10% $356 |
| Rate | -1.0pp $302 | -0.5pp $208 | base $113 | +0.5pp $16 | +1.0pp $-83 |
UW: 25.0% down · 7.5% · 30yr · 1.5% tax · 5.0% vac · 8.0% maint · 8.0% mgmt
Financing live
Cash to close
- Down payment
- $93,750
- Closing costs
- $11,250
- Reserves months
- —
- Total cash needed
- —
Loan-product check · same deal, 3 products live
Conventional
25% down · 7.5% · 30yr
- Down + closing
- —
- Monthly P&I
- —
- Monthly cashflow
- —
- DSCR
- —
- Eligible?
- —
Personal DTI + credit; lowest rate.
DSCR
20% down · 8.5% · 30yr
- Down + closing
- —
- Monthly P&I
- —
- Monthly cashflow
- —
- DSCR
- —
- Eligible?
- —
No personal income docs; deal must DSCR.
Hard money
10% down · 12.0% · 12mo
- Down + closing
- —
- Monthly P&I
- —
- Monthly cashflow
- —
- DSCR
- —
- Eligible?
- —
Short-term bridge; refi at stabilization.
Rent comps 18 comps
| Address | Beds | Baths | Sqft | Rent | $/sqft | DOM | Units | Dist |
|---|---|---|---|---|---|---|---|---|
| 236 Ward Ave Bellevue, KY | 3.0 | 2.0 | 1500 | $2,585 | $1.72 | 13d | 1 | 0.36mi |
| 118 Beech St Newport, KY | 3.0 | 2.0 | 1610 | $2,400 | $1.49 | 3d | 1 | 0.37mi |
| 100 Aqua Way Newport, KY | 1.0–3.0 | 1.0–2.0 | 1092 | $3,850 | $3.53 | 3d | 4 | 0.70mi |
| 1055 St Paul Pl Cincinnati, OH | 3.0 | 1.0–2.0 | 975 | $2,995 | $3.07 | 3d | 10 | 0.82mi |
| 601 E Pete Rose Way Cincinnati, OH | 3.0 | 1.0–2.5 | 1039 | $2,936 | $2.83 | 3d | 22 | 0.87mi |
| 923 Paradrome St Cincinnati, OH | 3.0 | 2.5 | 2098 | $3,000 | $1.43 | 25d | 1 | 0.87mi |
| 1287 Ida St Cincinnati, OH | 3.0 | 2.5 | 2494 | $4,700 | $1.88 | 19d | 1 | 0.96mi |
| 516 E 12th St Unit 1314562P Cincinnati, OH | 4.0 | 2.0 | 2023 | $10,170 | $5.03 | 25d | 1 | 1.23mi |
| 1304 Broadway Unit 1056130P Cincinnati, OH | 1.0–5.0 | 1.0–4.0 | 2072 | $7,152 | $3.45 | 12d | 2 | 1.36mi |
| 1326 Broadway Unit 1324946P Cincinnati, OH | 1.0–3.0 | 1.0–3.0 | 1162 | $10,683 | $9.19 | 25d | 2 | 1.39mi |
| 918 Windsor St Cincinnati, OH | 3.0 | 1.0 | 2583 | $1,675 | $0.65 | 25d | 1 | 1.40mi |
| 424 Liberty Hl Unit 1056033P Cincinnati, OH | 3.0 | 2.0 | 1453 | $5,780 | $3.98 | 3d | 1 | 1.40mi |
| 2331 Park Ave Unit 1 Cincinnati, OH | 3.0 | 2.5 | 2200 | $2,350 | $1.07 | 3d | 1 | 1.41mi |
| 1354 Broadway Unit 1056136P Cincinnati, OH | 4.0 | 3.0 | 2529 | $7,307 | $2.89 | 4d | 1 | 1.43mi |
| 923 Rogers Pl Cincinnati, OH | 3.0 | 1.0 | 2061 | $1,600 | $0.78 | 25d | 1 | 1.43mi |
| 2025 Burnet Ave Unit 2 Cincinnati, OH | 3.0 | 2.0 | 1513 | $1,795 | $1.19 | 5d | 1 | 1.45mi |
| 1410 Mansfield St Apt 4 Cincinnati, OH | 3.0 | 2.0 | 1412 | $2,387 | $1.69 | 12d | 1 | 1.47mi |
| 1410 Mansfield St Apt 3 Cincinnati, OH | 3.0 | 2.0 | 1412 | $2,401 | $1.70 | 12d | 1 | 1.47mi |
Listing history 21 events
-
2026-06-21days on market $375,000 Active 33 DOM
-
2026-06-18days on market $375,000 Active 30 DOM
-
2026-06-17days on market $375,000 Active 29 DOM
-
2026-06-16days on market $375,000 Active 28 DOM
-
2026-06-15days on market $375,000 Active 27 DOM
-
2026-06-13days on market $375,000 Active 25 DOM
-
2026-06-13days on market $375,000 Active 24 DOM
-
2026-06-09days on market $375,000 Active 21 DOM
-
2026-06-08days on market $375,000 Active 20 DOM
-
2026-06-07days on market $375,000 Active 19 DOM
-
2026-06-03days on market $375,000 Active 15 DOM
-
2026-06-02days on market $375,000 Active 14 DOM
-
2026-06-01days on market $375,000 Active 13 DOM
-
2026-05-31days on market $375,000 Active 12 DOM
-
2026-05-19$385,000 Active
-
2011-01-03soldstatus $130,000
-
2010-12-30soldstatus $130,000 217-char remark
Show marketing remark (217 chars)
Upgrades, Upgrades, Upgrades. Here is a perfect opportunity to live on one of Bellevue's best streets and have a rental unit to help pay the mortgage. Minutes from downtown and a short walk from restaurants and shops.
-
2010-10-21$144,000 217-char remark
Show marketing remark (217 chars)
Upgrades, Upgrades, Upgrades. Here is a perfect opportunity to live on one of Bellevue's best streets and have a rental unit to help pay the mortgage. Minutes from downtown and a short walk from restaurants and shops.
-
2001-10-12soldstatus $115,000
-
2001-09-22soldstatus $115,000 214-char remark
Show marketing remark (214 chars)
Nice Brick 2 Family. Average Rents Between $525-$575. Nice Hardwood Floor Good Condition. Central Air/ Separate Utilities. Roof Appr. 3 Yrs Old. Newer Windows. Fenced Yard. 2 Car Garage. Good Income. Close To Town.
-
2001-07-05$122,500 214-char remark
Show marketing remark (214 chars)
Nice Brick 2 Family. Average Rents Between $525-$575. Nice Hardwood Floor Good Condition. Central Air/ Separate Utilities. Roof Appr. 3 Yrs Old. Newer Windows. Fenced Yard. 2 Car Garage. Good Income. Close To Town.
ⓘ Source: listings_history table (triggers on properties + properties_extension) + one-shot
backfill from property_details.listing_events for pre-trigger history.
Tax reassessment forecast KY · Resets to sale price
- Current annual tax
- $2,321 · $193/mo
- Projected year-2 tax
- $3,225 · $269/mo
- Expected delta
- +$904/yr (+$75/mo · 39.0%)
ⓘ Screening estimate from a state-policy table — verify with the county assessor before closing.
Climate risk First Street
- Flood 1/10 Low FEMA zone X (unshaded) · 0% chance over 30 yrs
- Wildfire 1/10 Low
- Heat 5/10 Major 7 d/yr ≥103°F today · 19 d/yr by 30 yrs out
- Wind 2/10 Low 100% chance of damaging wind over 30 yrs
- Air quality 3/10 Moderate 2 unhealthy d/yr today · 3 by 30 yrs out
Nearby sold comps map
Loading sold comps map…
Walkable amenities ~0.75 mi
Loading nearby amenities…
Taxation est. · year 1
- Rental income
- $36,900
- − Mortgage interest
- −$21,006
- − Property taxes
- −$2,321
- − Insurance
- −$1,875
- − Repairs & maintenance
- −$2,952
- − Management
- −$2,952
- − Depreciation
- −$10,909
- Taxable loss
- −$5,115
- Est. tax savings @ 24.0%
- +$1,228
- After-tax cash flow
- $2,584/yr
For passive investors: Depreciation is non-cash, so a rental often shows a tax loss while cash-flowing — sheltering income. Rental losses are passive: they offset passive income freely, and up to $25,000/yr can offset ordinary (W-2) income if you actively participate and your MAGI is under $100k (phasing out to $0 by $150k); unused losses carry forward. On sale, claimed depreciation is recaptured at up to 25%, and gains may owe capital-gains tax (a 1031 exchange can defer both). Figures are a year-1 estimate at your 24.0% rate — not tax advice; consult a CPA.
Schools (NCES district)
- District
- Bellevue Independent
- NCES district ID
- 2100420
- Math proficiency
- 17% ▼ -16.00%
- Reading proficiency
- 33% ▼ -12.00%
- Median HH income
- $51,374
- Composite
- 22.13/100
- National rank
- #8173
- State rank
- #136 of 165 in KY
Livability — Bellevue
- Score
- 92/100
- State rank
- #8
- US rank
- #24
Category grades
Schools grade is shown separately in the Schools card above.
Census & demographics
- Census place
- Bellevue, KY
- County
- Campbell County · 84,793 people
- City population
- 5,636
- Metro
- Cincinnati, OH-KY-IN
- Population (ZIP)
- 5,636
- Household income
- $71,166
- Rent vs Own
- Severe rent burden
- 173.0
Population outlook (Campbell County) Hauer SSP2
- Today (2025)
- 95,668 people
- By 2030
- 96,886 · +1.3%
- By 2040
- 97,734 · +2.2%
- By 2050
- 96,413 · +0.8%
- By 2075
- 90,211 · -5.7%
- By 2100
- 79,434 · -17.0%
Race, ethnicity, and origin ACS 2023
- Neighborhood character
- Predominantly White (90%)
- Race & ethnicity
- White 90% Hispanic / Latino 4% Two or more races 2%
- Common ancestry
- Lithuanian 3% Slovak 3% Iranian 2%
- Foreign-born
- 2% · Canada
- Languages at home
- 95% English-only · Spanish 3% German/W. Germanic 2%
Political lean MEDSL · Campbell
- 2024 margin
- R (+19.7) · D 39.2% · R 58.9% · Other 1.9%
- 2008→2024 swing
- +1.2pp toward D · 2008: -20.9pp · 2024: -19.7pp
- All cycles
- 2024: R+19.7 2020: R+18.6 2016: R+24.5 2012: R+22.8 2008: R+20.9
Not yet ingested
- Civics
- —
Market trends
- HPI YoY
- ▼ -186.80%
- Current HPI
- 252.0078
- Rent YoY
- ▲ 0.19%
- Metro
- Cincinnati, OH-KY-IN
- State GDP YoY
- ▲ 1.81%
- F500 in state
- 4
Industry mix (Fortune 500 HQ in KY)
| Industry | F500 HQs | Revenue |
|---|---|---|
| Healthcare | 1 | $118B |
|
||
| Food / Beverage | 1 | $7B |
|
||
Price history
+214.3% since first listed7 events — show timeline
- 2026-05-19 Listed $385,000 NKMLS
- 2011-01-03 Sold (Public Records) $130,000 Public Records
- 2010-12-30 Sold (MLS) $130,000 NKMLS
- 2010-10-21 Listed $144,000 NKMLS
- 2001-10-12 Sold (Public Records) $115,000 Public Records
- 2001-09-22 Sold (MLS) $115,000 NKMLS
- 2001-07-05 Listed $122,500 NKMLS
Property tax history
+3.2%/yrLatest (2025): $2,321 · +0.5% YoY. Source: county tax records.
Cash-flow waterfall
monthlySold comps — $/sqft
last 12 mo · ≤1 miLoading sold comps…