134 Meadowview Dr · Radcliff, KY
Flood risk 1/10 · Minimal
- FEMA flood zone
- X (unshaded)
- Chance of flooding over 30 yrs
- 0.0%
- Est. flood insurance / yr
- $507 – $1,088
Fire risk 4/10 · Minor
- Est. fire insurance / yr
- $839 – $1,559
Heat risk 4/10 · Minor
- Hot days now (above 103°F)
- 7 days/yr
- Hot days in 30 yrs
- 19 days/yr
Wind risk 2/10 · Minimal
- Chance of severe wind over 30 yrs
- 2.0%
Air-quality risk 2/10 · Minimal
- Unhealthy air days now
- 0 days/yr
- Unhealthy air days in 30 yrs
- 2 days/yr
Risk factors via First Street. Map © Google.
Why this score? — see what drove the C+ grade
The composite is a weighted blend of 9 inputs, each scored 0–100. Each bar is that input's sub-score; the figure is the points it added to the 100-point composite (weight × sub-score).
- Cash flow +24.5/30.0
- ARV discount +15.0/15.0
- DSCR +7.9/10.0
- 1% rule +5.2/10.0
- Rent growth +3.3/5.0
- Schools +3.2/10.0
- Livability +3.1/5.0
- Condition / age +2.5/5.0
- Appreciation +0.0/10.0
$159,900
🖨 Deal sheet 📄 Offer letter ✓ Due diligence
Listing remarks
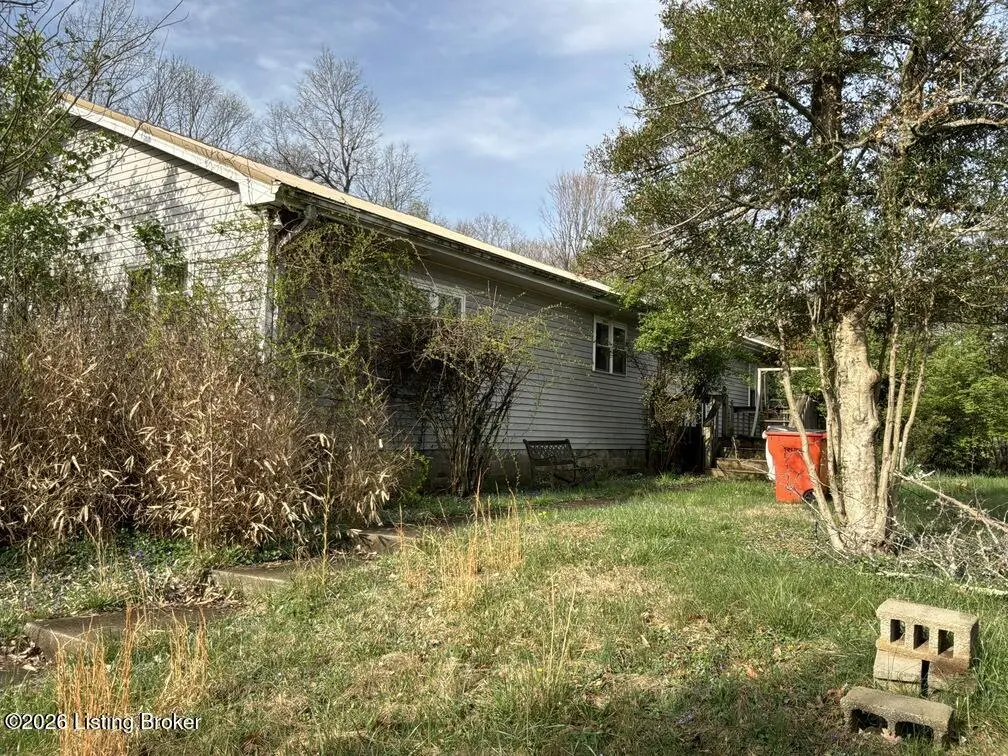
Buyer responsible to verify all utilities. Buyer to have utilities turned on if desire inspections, at own expense. Offers subject to court approval. Court approval contract/offer required. Closing to occur no sooner than 31 days from court approval date. Title to be transferred as quit claim deed. Addendum 1 (under other) MUST BE SUBMITTED WITH ALL OFFERS GOOD FAITH DEPOSIT MUST BE HELD IN LISTING BROKERAGE ESCROW ACCOUNT. WHEN SUBMITTING OFFERS PLEASE ALLOW 2 BUSINESS DAYS TO RESPOND. Pictures are accurate dress accordingly. Includes parcels 182-40-01-040, 182-40-01-041, and 182-40-01-042. (Please write in other provisions when submitting any offers)
Key facts
- 1.55 acre lot
- 3 garage spots
- Built 1980
Property features AI
Finance
- HOA & community: No association fee
Exterior
- Parking: Detached 3-car garage
- Utilities: No utilities listed
- Home design: Single-family ranch-style home; One story
- Construction: Built in 1980; Shingle roof; Vinyl siding with wood frame construction; Crawl space foundation
- Exterior features: Approximately 1.55-acre lot; Located in Longview Estates subdivision; Directions: 65 South, Exit 102, left on S. Dixie Blvd, to Forest Dr to Meadowview Dr
Interior
- Kitchen: Kitchen on the first floor
- Bedrooms: Three bedrooms — all on the first floor
- Bathrooms: One full bathroom
- Heating & cooling: Heating present
- Interior features: Seven total rooms; Dining area on the first floor; Family room on the first floor; Living room on the first floor; No basement
- Laundry & utility: First-floor laundry
Neighborhood map
What this means for you Summary
Snapshot
- This is a 3-bed/1.0-bath single-family listed at $160k.
Deal economics
- At list price, monthly cash flow is $329 ($4k/yr) — positive.
- The deal already cash-flows at list — no discount required.
- Meets the 1% rule at list price ($2k rent vs $160k).
- Recommended offer: $158k (1.5% below list) — sets the bar for market timing.
- Cap rate 8.8% vs local median 3.5% in Radcliff — top-decile yield for the area; either an underpriced asset or a hidden risk that comps aren't pricing in. Stress-test before assuming the spread holds.
Location & tenants
- Location reads 61/100 on livability (#367 in KY) — a middle-class / working-renter tenant base. Strengths: cost of living A+, housing A+, crime B; Watch: schools D-, amenities F, commute F.
- Hardin County (suburban): math 30% / reading 43% proficiency, ranked #47 of 165 in KY (top 28%) — families likely to look elsewhere, expect single-tenant / working-renter base with shorter leases.
- Market conditions: Rents rising (+3.3%/yr); 539 active listings in the ZIP; 1 comparable units currently listed for rent nearby; 946 units permitted in Hardin County in 2024 (464 in 5+ unit buildings).
Forward outlook
- Local home prices are declining (-3.0%/yr); year-one equity from $1k of loan paydown is wiped out by about $5k of value loss. Plan a longer hold.
- Hardin County population projected at -16% by 2050 — secular population decline; favor cash flow + early exit over multi-decade hold.
Negotiation context
- It's been on market 27 days — a 2% lower offer ($158k) is reasonable based on typical stale-listing flexibility.
- 2 sale attempts with the ask held roughly flat each time — persistent listings suggest the price (not the market) is what's stuck; bring a comps-based counter.
Questions for the listing agent
- Is there a deadline driving the sale (1031 exchange, divorce, estate, relocation)? That informs how much negotiation room exists.
- Schools are D-rated, which usually means shorter tenancies and higher turnover. Who's the typical renter profile here, and what's been the actual vacancy rate?
- What's the average days-on-market for RENTAL listings here right now (not sales)? A rising rental-DOM trend means longer vacancies and softer asking-rent achievability than the comps imply.
- What's the recent tenant-quality profile in this submarket — average credit score on applications, eviction rate, late-payment / NSF rate, and stable-employment percentage? A property-management company in the area should have these aggregated.
- How much new for-sale + rental construction is in the pipeline within 1–3 miles? Heavy new supply typically softens prices + rents 12–24 months out; constrained supply supports both.
Investment metrics
- 1% rule
- 1.02% ✓
- Cap rate
- 8.76%
- Cash-on-cash
- 8.82%
- DSCR
- 1.39
- GRM
- 8.2
CMA / ARV
- ARV (on-the-fly)
- $269,412
- Comps found
- 4
Show comp detail 4 sales within ~0.75 mi
| Address | Dist | Beds/Ba | Sqft | Sold | Price | $/sf | Match |
|---|---|---|---|---|---|---|---|
| 429 Meadowview Dr | 0.23mi | 3/1.5 | 1,627 (-5%) | 24mo | $222,000 | $136 | 59 |
| 204 Fentress Blvd | 0.43mi | 3/2.0 | 1,500 (-13%) | 1mo | $180,000 | $120 | 54 |
| 200 Emmaus Cir | 0.68mi | 3/2.0 | 1,912 (+11%) | 6mo | $300,000 | $157 | 40 |
| 408 Promise Ln | 0.75mi | 3/3.0 | 1,764 (+3%) | 20mo | $310,000 | $176 | 36 |
Match score weights: distance 35% · size 25% · config 20% · recency 20%. Top-matched comps best support the ARV.
Projected returns pro-forma
-3.0% appreciation · 3.32% rent growth · sell at horizon
- IRR
- -2.7%
- Equity multiple
- 0.90×
- Total profit
- $-4,495
- Equity at exit
- $23,842
- IRR
- 7.3%
- Equity multiple
- 1.56×
- Total profit
- $24,967
- Equity at exit
- $13,825
Cash invested: $44,772 (down + closing). Projections, not guarantees.
Landlord ↔ Tenant lean methodology
- Overall (STATE)
- 83 Strongly Landlord-Friendly
- State Kentucky
- 83 Strongly Landlord-Friendly · R+16
- County
- — inherits STATE
- City
- — inherits STATE
ZIP-level market 42701
- Home prices YoY
- -29.8%
- Rents YoY
- 3.3%
- Active inventory
- 539
- Price-to-rent
- 8.2×
Monthly cashflow live
- Estimated rent
- $1,625 medium interval (Pro) →
- Mortgage (P&I)
- −$839
- Tax from tax record
- −$50 /mo · $596/yr
- Insurance
- −$67
- HOA
- −$0
- Vacancy / Maint / Mgmt
- −$341
- Net cashflow
- $329
Break-even live
UW: 25.0% down · 7.5% · 30yr · 1.5% tax · 5.0% vac · 8.0% maint · 8.0% mgmt
Financing live
Cash to close
- Down payment
- $39,975
- Closing costs
- $4,797
- Reserves months
- —
- Total cash needed
- —
Loan-product check · same deal, 3 products live
Conventional
25% down · 7.5% · 30yr
- Down + closing
- —
- Monthly P&I
- —
- Monthly cashflow
- —
- DSCR
- —
- Eligible?
- —
Personal DTI + credit; lowest rate.
DSCR
20% down · 8.5% · 30yr
- Down + closing
- —
- Monthly P&I
- —
- Monthly cashflow
- —
- DSCR
- —
- Eligible?
- —
No personal income docs; deal must DSCR.
Hard money
10% down · 12.0% · 12mo
- Down + closing
- —
- Monthly P&I
- —
- Monthly cashflow
- —
- DSCR
- —
- Eligible?
- —
Short-term bridge; refi at stabilization.
Rent comps 1 comps
| Address | Beds | Baths | Sqft | Rent | $/sqft | DOM | Units | Dist |
|---|---|---|---|---|---|---|---|---|
| 845 Pine Valley Dr Elizabethtown, KY | 2.0–3.0 | 2.0–3.0 | 1412 | $1,350 | $0.96 | 21d | 1 | 1.36mi |
Listing history 4 events
-
2026-05-12status Pending
-
2026-04-16status Active
-
2026-04-16$159,900 Active
-
2026-04-14historical
ⓘ Source: listings_history table (triggers on properties + properties_extension) + one-shot
backfill from property_details.listing_events for pre-trigger history.
Tax reassessment forecast KY · Resets to sale price
- Current annual tax
- $596 · $50/mo
- Projected year-2 tax
- $1,375 · $115/mo
- Expected delta
- +$779/yr (+$65/mo · 130.8%)
ⓘ Screening estimate from a state-policy table — verify with the county assessor before closing.
Climate risk First Street
- Flood 1/10 Low FEMA zone X (unshaded) · 0% chance over 30 yrs
- Wildfire 4/10 Moderate
- Heat 4/10 Moderate 7 d/yr ≥103°F today · 19 d/yr by 30 yrs out
- Wind 2/10 Low 2% chance of damaging wind over 30 yrs
- Air quality 2/10 Low 0 unhealthy d/yr today · 2 by 30 yrs out
Nearby sold comps map
Loading sold comps map…
Walkable amenities ~0.75 mi
Loading nearby amenities…
Taxation est. · year 1
- Rental income
- $19,502
- − Mortgage interest
- −$8,957
- − Property taxes
- −$596
- − Insurance
- −$800
- − Repairs & maintenance
- −$1,560
- − Management
- −$1,560
- − Depreciation
- −$4,652
- Taxable income
- $1,378
- Est. tax owed @ 24.0%
- −$331
- After-tax cash flow
- $3,618/yr
For passive investors: Depreciation is non-cash, so a rental often shows a tax loss while cash-flowing — sheltering income. Rental losses are passive: they offset passive income freely, and up to $25,000/yr can offset ordinary (W-2) income if you actively participate and your MAGI is under $100k (phasing out to $0 by $150k); unused losses carry forward. On sale, claimed depreciation is recaptured at up to 25%, and gains may owe capital-gains tax (a 1031 exchange can defer both). Figures are a year-1 estimate at your 24.0% rate — not tax advice; consult a CPA.
Schools (NCES district)
- District
- Hardin County
- NCES district ID
- 2102490
- Math proficiency
- 30% ▼ -13.00%
- Reading proficiency
- 43% ▼ -10.00%
- Median HH income
- $50,728
- Composite
- 31.61/100
- National rank
- #5945
- State rank
- #47 of 165 in KY
Livability — Radcliff
- Score
- 61/100
- State rank
- #367
- US rank
- #17445
Category grades
Schools grade is shown separately in the Schools card above.
Census & demographics
- County
- Hardin County · 77,611 people
- City population
- 23,624
- Metro
- Elizabethtown-Fort Knox, KY
- Population (ZIP)
- 53,987
- Household income
- $69,619
- Rent vs Own
- Severe rent burden
- 1663.0
Population outlook (Hardin County) Hauer SSP2
- Today (2025)
- 105,573 people
- By 2030
- 103,563 · -1.9%
- By 2040
- 97,077 · -8.0%
- By 2050
- 88,367 · -16.3%
- By 2075
- 65,405 · -38.0%
- By 2100
- 42,245 · -60.0%
Race, ethnicity, and origin ACS 2023
- Neighborhood character
- Predominantly White (79%)
- Race & ethnicity
- White 79% Black 9% Two or more races 6% Hispanic / Latino 5% Asian 2%
- Hispanic origin (detail)
- Mexican 3% Puerto Rican 1%
- Common ancestry
- Italian 3% Slovak 2% Romanian 2%
- Foreign-born
- 4% · Canada, South Korea
- Languages at home
- 94% English-only · Spanish 3% German/W. Germanic 1% Other Indo-European 1%
Political lean MEDSL · Hardin
- 2024 margin
- Strong R (+29.3) · D 34.5% · R 63.8% · Other 1.7%
- 2008→2024 swing
- -8.7pp toward R · 2008: -20.6pp · 2024: -29.3pp
- All cycles
- 2024: R+29.3 2020: R+24.0 2016: R+30.2 2012: R+20.8 2008: R+20.6
Not yet ingested
- Civics
- —
Market trends
- HPI YoY
- ▼ -96.94%
- Current HPI
- 228.7091
- Rent YoY
- ▲ 3.32%
- Metro
- Elizabethtown-Fort Knox, KY
- State GDP YoY
- ▲ 1.81%
- F500 in state
- 4
Industry mix (Fortune 500 HQ in KY)
| Industry | F500 HQs | Revenue |
|---|---|---|
| Healthcare | 1 | $118B |
|
||
| Food / Beverage | 1 | $7B |
|
||
Price history
4 events — show timeline
- 2026-05-12 Pending — Metro Search MLS
- 2026-04-16 Relisted — Metro Search MLS
- 2026-04-16 Listed $159,900 Metro Search MLS
- 2026-04-14 Listing Removed — Metro Search MLS
Property tax history
+3.1%/yrLatest (2025): $596 · -2.2% YoY. Source: county tax records.
Cash-flow waterfall
monthlySold comps — $/sqft
last 12 mo · ≤1 miLoading sold comps…