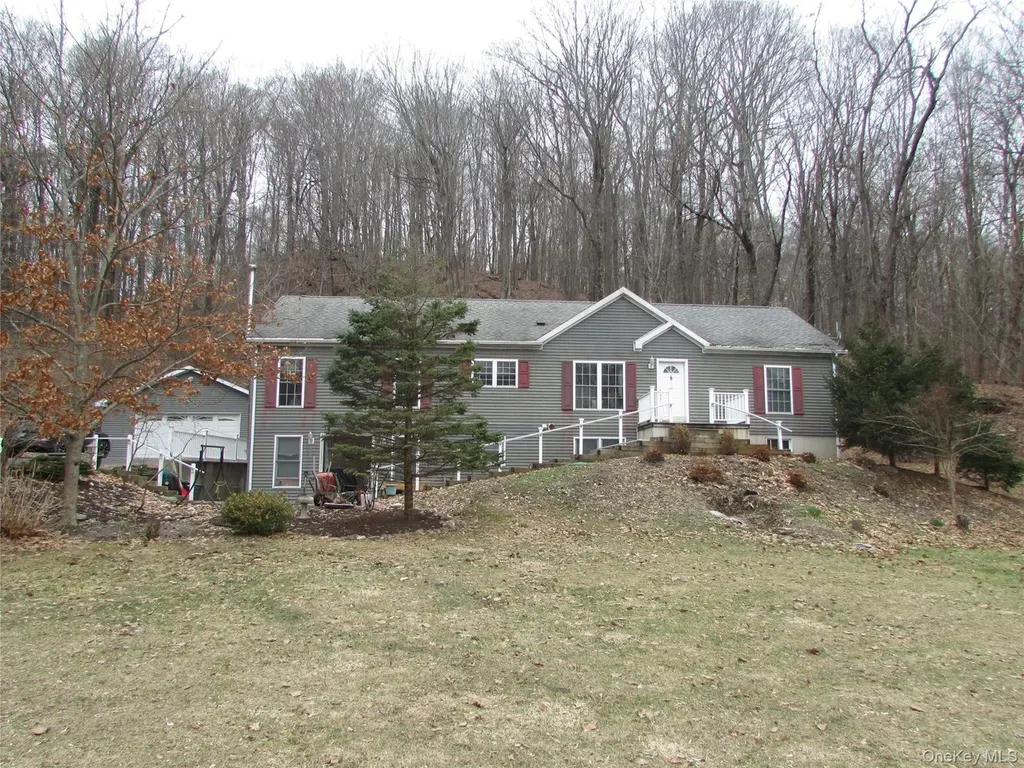
236 South Rd · Pine Plains, NY
Flood risk 1/10 · Minimal
- FEMA flood zone
- X (unshaded)
- Chance of flooding over 30 yrs
- 0.0%
- Est. flood insurance / yr
- $473 – $860
Fire risk 5/10 · Moderate
- Est. fire insurance / yr
- $691 – $1,283
Heat risk 3/10 · Minor
- Hot days now (above 96°F)
- 7 days/yr
- Hot days in 30 yrs
- 14 days/yr
Wind risk 4/10 · Minor
- Chance of severe wind over 30 yrs
- 11.0%
Air-quality risk 3/10 · Minor
- Unhealthy air days now
- 2 days/yr
- Unhealthy air days in 30 yrs
- 3 days/yr
Risk factors via First Street. Map © Google.
Why this score? — see what drove the F grade
The composite is a weighted blend of 9 inputs, each scored 0–100. Each bar is that input's sub-score; the figure is the points it added to the 100-point composite (weight × sub-score).
- Appreciation +10.0/10.0
- ARV discount +7.5/15.0
- Schools +4.8/10.0
- Livability +3.2/5.0
- Cash flow +2.9/30.0
- Rent growth +2.5/5.0
- Condition / age +2.5/5.0
- 1% rule +0.0/10.0
- DSCR +0.0/10.0
$689,000
🖨 Deal sheet (PDF) 📄 Offer letter ✓ Due diligence
Listing remarks
Spacious legal mother-daughter ranch offering 3 bedrooms, 3 full baths, and 2 half baths—ideal for extended or multi-generational living. The upper level features two bedrooms plus a versatile office space, a bright kitchen, and a formal dining area. The primary suite includes a walk-in closet and a private full bath, with sliding glass doors off of living room leading to a secluded deck—perfect for relaxing or entertaining. The lower level provides a fully equipped separate living area with its own kitchen, dining space, one bedroom with a full bath, a comfortable den, and an additional half bath. Also featured is a soundproof recording studio—ideal for musicians, content
Key facts
- Secluded deck
- Private full bath
- 2.27 acre lot
Tags
Property features AI
Exterior
- Parking: Detached garage; 2 garage spaces; Driveway parking; Off-street parking; Private parking
- Utilities: Septic tank; Cable connected; Electricity connected; Propane available
- Home design: Single-family residence
- Construction: Frame construction
- Exterior features: Frame construction; Not waterfront
Interior
- Kitchen: Dishwasher; Gas range; Microwave; Refrigerator; Granite counters; Kitchen island; Eat-in kitchen; Open kitchen
- Bedrooms: Bedroom on the first floor
- Bathrooms: 3 full bathrooms; 2 half bathrooms
- Heating & cooling: Propane heating; Heating details — see remarks; No central cooling
- Interior features: First-floor bedroom; First-floor full bathroom; Eat-in kitchen; Entrance foyer; Formal dining room; Granite countertops; Kitchen island; Open floor plan; Open kitchen; Primary bathroom; Washer/dryer hookup; Finished basement; Scuttle attic; Total of 9 rooms
- Laundry & utility: Washer/dryer hookup; Gas water heater
Neighborhood map
What this means for you Summary
Snapshot
- This is a 3-bed/2.5-bath single-family listed at $689k.
Deal economics
- At list price, monthly cash flow is $-2k ($-27k/yr) — negative.
- To cash-flow at today's rent, offer at most $290k (57.9% below list).
- To meet the 1% rule (rent ≥ 1% of price), the offer needs to be $313k (54.6% below list).
- Recommended offer: $290k (57.9% below list) — sets the bar for cash-flow.
Location & tenants
- Location reads 64/100 on livability (#746 in NY) — a middle-class / working-renter tenant base. Strengths: crime A+, housing A+, employment B+; Watch: cost of living D+, amenities F, commute F.
- Pine Plains Central School District (rural): math 55% / reading 50% proficiency, ranked #372 of 755 in NY (top 49%) — acceptable for families but not a draw, mixed tenant base, ~2y average lease.
- Zoned schools: Cold Spring Early Learning Center (165 students, 12% FRL); Stissing Mountain Junior/Senior High School (math 92% / reading 75%, grade A, #409 of 1,100 statewide, top 39%, 460 students, 36% FRL) — zoned schools at 24% FRL track the district average.
- Zoned-school proficiency averages 84% at this address vs 52% district-wide (+31 pts) — the actual schools serving this property are materially stronger than the Pine Plains Central School District average implies; a family-tenant draw the district grade alone would hide.
- Market conditions: 12 active listings in the ZIP; 620 units permitted in Dutchess County in 2024 (242 in 5+ unit buildings).
Forward outlook
- In year one you build about $74k of equity ($5k loan paydown + $69k appreciation (10.0% local appreciation)).
- Dutchess County population projected at -11% by 2050 — secular population decline; favor cash flow + early exit over multi-decade hold.
- By year 2, paydown + projected appreciation supports a ~$118k cash-out refi (75% LTV) — recoverable capital for the next deal without selling this one.
Negotiation context
- It's been on market 51 days — a 3% lower offer ($668k) is reasonable based on typical stale-listing flexibility.
- Current owner paid $70k; list at $689k implies a 884% gain — meaningful room to come down on a strong offer.
Risks & watch-outs
- Climate carrying-cost: moderate wildfire risk — expect insurance premiums to compound above CPI over the hold.
Questions for the listing agent
- What do current leases actually rent for vs. the listed asking? Can we see a recent rent roll and the last 12 months of T-12 income?
- It's been on market 51 days. Have you received any prior offers? Is the seller open to a 58% concession, seller financing, or rate buy-down credit?
- Is there a deadline driving the sale (1031 exchange, divorce, estate, relocation)? That informs how much negotiation room exists.
- The area grade is low — what's the realistic commute time and amenity access for the typical tenant pool here? Any planned neighborhood developments (good or bad) we should know about?
- What's the average days-on-market for RENTAL listings here right now (not sales)? A rising rental-DOM trend means longer vacancies and softer asking-rent achievability than the comps imply.
- What's the recent tenant-quality profile in this submarket — average credit score on applications, eviction rate, late-payment / NSF rate, and stable-employment percentage? A property-management company in the area should have these aggregated.
- How much new for-sale + rental construction is in the pipeline within 1–3 miles? Heavy new supply typically softens prices + rents 12–24 months out; constrained supply supports both.
Investment metrics
- 1% rule
- 0.45% ✗
- Cap rate
- 2.36%
- Cash-on-cash
- -14.05%
- DSCR
- 0.37
- GRM
- 18.4
CMA / ARV
- ARV (median comp)
- $2,096,495
- List price
- $689,000
- Delta
- -67.14%
- Verdict
- UNDERPRICED
- Comps
- 2 within 1.0 mi
Projected returns pro-forma
10.0% appreciation · 3.0% rent growth · sell at horizon
- IRR
- 14.5%
- Equity multiple
- 2.20×
- Total profit
- $231,374
- Equity at exit
- $620,706
- IRR
- 14.4%
- Equity multiple
- 5.12×
- Total profit
- $794,579
- Equity at exit
- $1,338,575
Cash invested: $192,920 (down + closing). Projections, not guarantees.
Landlord ↔ Tenant lean methodology
- Overall (STATE)
- 15 Strongly Tenant-Friendly
- State New York
- 15 Strongly Tenant-Friendly · D+10
- County
- — inherits STATE
- City
- — inherits STATE
ZIP-level market 12581
- Home prices YoY
- 8.7%
- Active inventory
- 12
- Price-to-rent
- 18.4×
Monthly cashflow live
- Estimated rent
- $3,129 medium interval (Pro) →
- Mortgage (P&I)
- −$3,613
- Tax from tax record
- −$831 /mo · $9,970/yr
- Insurance
- −$287
- HOA
- −$0
- Vacancy / Maint / Mgmt
- −$657
- Net cashflow
- $-2,259
Break-even live
Sensitivity live
| Price | -10% $-1,869 | -5% $-2,064 | +0% $-2,259 | +5% $-2,454 | +10% $-2,649 |
|---|---|---|---|---|---|
| Rent | -10% $-2,507 | -5% $-2,383 | +0% $-2,259 | +5% $-2,136 | +10% $-2,012 |
| Rate | -1.0pp $-1,912 | -0.5pp $-2,084 | base $-2,259 | +0.5pp $-2,438 | +1.0pp $-2,620 |
UW: 25.0% down · 7.5% · 30yr · 1.5% tax · 5.0% vac · 8.0% maint · 8.0% mgmt
Financing live
Cash to close
- Down payment
- $172,250
- Closing costs
- $20,670
- Reserves months
- —
- Total cash needed
- —
Loan-product check · same deal, 3 products live
Conventional
25% down · 7.5% · 30yr
- Down + closing
- —
- Monthly P&I
- —
- Monthly cashflow
- —
- DSCR
- —
- Eligible?
- —
Personal DTI + credit; lowest rate.
DSCR
20% down · 8.5% · 30yr
- Down + closing
- —
- Monthly P&I
- —
- Monthly cashflow
- —
- DSCR
- —
- Eligible?
- —
No personal income docs; deal must DSCR.
Hard money
10% down · 12.0% · 12mo
- Down + closing
- —
- Monthly P&I
- —
- Monthly cashflow
- —
- DSCR
- —
- Eligible?
- —
Short-term bridge; refi at stabilization.
Listing history 21 events
-
2026-06-22days on market $689,000 Active 51 DOM
-
2026-06-18days on market $689,000 Active 48 DOM
-
2026-06-17days on market $689,000 Active 47 DOM
-
2026-06-16days on market $689,000 Active 46 DOM
-
2026-06-15days on market $689,000 Active 45 DOM
-
2026-06-14days on market $689,000 Active 43 DOM
-
2026-06-10days on market $689,000 Active 40 DOM
-
2026-06-09days on market $689,000 Active 39 DOM
-
2026-06-08days on market $689,000 Active 38 DOM
-
2026-06-07days on market $689,000 Active 37 DOM
-
2026-06-05days on market $689,000 Active 34 DOM
-
2026-06-03days on market $689,000 Active 33 DOM
-
2026-06-02days on market $689,000 Active 32 DOM
-
2026-06-01days on market $689,000 Active 31 DOM
-
2026-05-31days on market $689,000 Active 30 DOM
-
2026-05-30days on market $689,000 Active 29 DOM
-
2026-05-15price $689,000 1019-char remark
-
2026-05-01$699,000 Active 1019-char remark
-
2025-09-30historical
-
2025-09-19historical
-
2006-03-20soldstatus $70,000
ⓘ Source: listings_history table (triggers on properties + properties_extension) + one-shot
backfill from property_details.listing_events for pre-trigger history.
Tax reassessment forecast NY · Partial reset (capped growth)
- Current annual tax
- $9,970 · $831/mo
- Projected year-2 tax
- $10,807 · $901/mo
- Expected delta
- +$837/yr (+$70/mo · 8.4%)
ⓘ Screening estimate from a state-policy table — verify with the county assessor before closing.
Climate risk First Street
- Flood 1/10 Low FEMA zone X (unshaded) · 0% chance over 30 yrs
- Wildfire 5/10 Major
- Heat 3/10 Moderate 7 d/yr ≥96°F today · 14 d/yr by 30 yrs out
- Wind 4/10 Moderate 11% chance of damaging wind over 30 yrs
- Air quality 3/10 Moderate 2 unhealthy d/yr today · 3 by 30 yrs out
Nearby sold comps map
Loading sold comps map…
Walkable amenities ~0.75 mi
Loading nearby amenities…
Taxation est. · year 1
- Rental income
- $37,545
- − Mortgage interest
- −$38,595
- − Property taxes
- −$9,970
- − Insurance
- −$3,445
- − Repairs & maintenance
- −$3,004
- − Management
- −$3,004
- − Depreciation
- −$20,044
- Taxable loss
- −$40,515
- Est. tax savings @ 24.0%
- +$9,724
- After-tax cash flow
- $-17,389/yr
For passive investors: Depreciation is non-cash, so a rental often shows a tax loss while cash-flowing — sheltering income. Rental losses are passive: they offset passive income freely, and up to $25,000/yr can offset ordinary (W-2) income if you actively participate and your MAGI is under $100k (phasing out to $0 by $150k); unused losses carry forward. On sale, claimed depreciation is recaptured at up to 25%, and gains may owe capital-gains tax (a 1031 exchange can defer both). Figures are a year-1 estimate at your 24.0% rate — not tax advice; consult a CPA.
Schools (NCES district)
- District
- Pine Plains Central School District
- NCES district ID
- 3623040
- Math proficiency
- 55% ▬ 0.00%
- Reading proficiency
- 50% ▲ 1.00%
- Median HH income
- $66,189
- Composite
- 48.33/100
- National rank
- #4688
- State rank
- #372 of 755 in NY
Livability — Pine Plains
- Score
- 64/100
- State rank
- #746
- US rank
- #14240
Category grades
Schools grade is shown separately in the Schools card above.
Census & demographics
- City population
- 2,498
- Population (ZIP)
- 1,928
Population outlook (Dutchess County) Hauer SSP2
- Today (2025)
- 291,768 people
- By 2030
- 287,131 · -1.6%
- By 2040
- 274,881 · -5.8%
- By 2050
- 259,971 · -10.9%
- By 2075
- 235,366 · -19.3%
- By 2100
- 208,786 · -28.4%
Race, ethnicity, and origin ACS 2023
- Neighborhood character
- Predominantly White (81%)
- Race & ethnicity
- White 81% Hispanic / Latino 11% Two or more races 5% Asian 3%
- Hispanic origin (detail)
- Mexican 3% Puerto Rican 8%
- Common ancestry
- Romanian 4% Iranian 3% Lithuanian 3%
- Foreign-born
- 6% · Canada, China
- Languages at home
- 83% English-only · Spanish 10% Chinese 2% German/W. Germanic 1%
Political lean MEDSL · Dutchess
- 2024 margin
- Lean D (+5.4) · D 52.7% · R 47.3%
- 2008→2024 swing
- -3.2pp toward R · 2008: 8.6pp · 2024: 5.4pp
- All cycles
- 2024: D+5.4 2020: D+9.6 2016: R+1.1 2012: D+6.6 2008: D+8.6
Not yet ingested
- Civics
- —
Market trends
- HPI YoY
- ▲ 21.70%
- Current HPI
- 270.6533
- Rent YoY
- —
- Metro
- —
- State GDP YoY
- ▲ 2.60%
- F500 in state
- 92
Industry mix (Fortune 500 HQ in NY)
| Industry | F500 HQs | Revenue |
|---|---|---|
| Financial Services | 10 | $950B |
|
||
| Consumer Goods | 9 | $162B |
|
||
| Insurance | 4 | $225B |
|
||
| Telecommunications | 2 | $144B |
|
||
| Pharmaceuticals | 2 | $112B |
|
||
| Media / Entertainment | 2 | $69B |
|
||
Price history
+884.3% since first listed5 events — show timeline
- 2026-05-15 Price Changed $689,000 OneKey® MLS as Distributed by MLS Grid
- 2026-05-01 Listed $699,000 OneKey® MLS as Distributed by MLS Grid
- 2025-09-30 Listing Removed — OneKey® MLS as Distributed by MLS Grid
- 2025-09-19 Coming Soon — OneKey® MLS as Distributed by MLS Grid
- 2006-03-20 Sold (Public Records) $70,000 Public Records
Property tax history
+5.0%/yrLatest (2025): $9,970 · +43.9% YoY. Source: county tax records.
Cash-flow waterfall
monthlySold comps — $/sqft
last 12 mo · ≤1 miLoading sold comps…