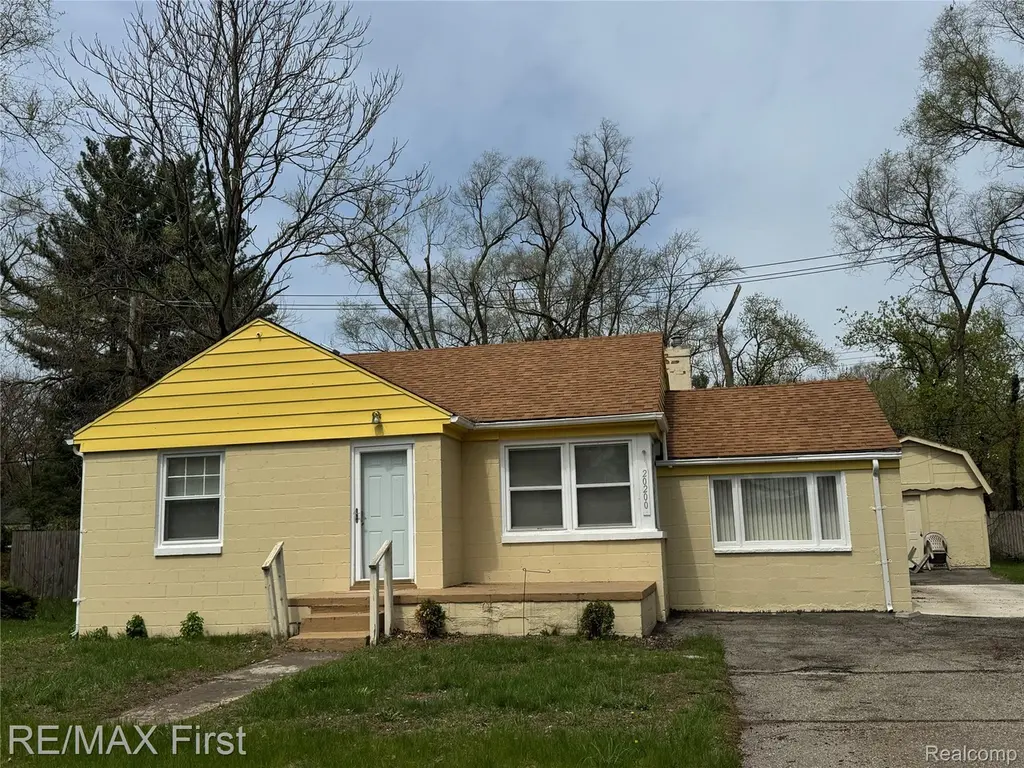
20200 Westhampton Ave · Southfield, MI
Flood risk 1/10 · Minimal
- FEMA flood zone
- X (unshaded)
- Chance of flooding over 30 yrs
- 0.0%
- Est. flood insurance / yr
- $507 – $1,088
Fire risk 1/10 · Minimal
- Est. fire insurance / yr
- $784 – $1,456
Heat risk 2/10 · Minimal
- Hot days now (above 97°F)
- 7 days/yr
- Hot days in 30 yrs
- 15 days/yr
Wind risk 2/10 · Minimal
- Chance of severe wind over 30 yrs
- —
Air-quality risk 3/10 · Minor
- Unhealthy air days now
- 2 days/yr
- Unhealthy air days in 30 yrs
- 5 days/yr
Risk factors via First Street. Map © Google.
Why this score? — see what drove the D+ grade
The composite is a weighted blend of 9 inputs, each scored 0–100. Each bar is that input's sub-score; the figure is the points it added to the 100-point composite (weight × sub-score).
- ARV discount +12.9/15.0
- Cash flow +11.4/30.0
- 1% rule +4.6/10.0
- Rent growth +4.5/5.0
- Livability +3.6/5.0
- DSCR +3.3/10.0
- Condition / age +2.5/5.0
- Schools +2.4/10.0
- Appreciation +0.0/10.0
$139,000
🖨 Deal sheet (PDF) 📄 Offer letter ✓ Due diligence
Listing remarks MLS
EXCELLENT INVESTMENT OPPORTUNITY!!! Cozy 2 bedroom home situation on a spacious lot, offering both comfort and functionality. This property features a brand new roof in 2024, vinyl windows, and an inviting eat-in kitchen. The bedrooms are generously sized, and the home showcases beautiful wood floors throughout. A large back room provides the perfect space for entertaining or relaxing. Outside, you'll find a sizable shed, ideal for storing garden tools and outdoor equipment.
Key facts
- Vinyl windows
- Wood floors
- Eat-in kitchen
Tags
Property features AI
Exterior
- Parking: No garage
- Utilities: Public water; Public sewer
- Home design: Single-family residence; One story; Ground-level entry
- Construction: Aluminum siding and block construction; Composition roof; Slab foundation; Built area above grade: 1,135
- Exterior features: Front porch; Fenced backyard; Shed; Paved road access
Interior
- Kitchen: Free-standing gas range; Free-standing refrigerator
- Bathrooms: One full bathroom
- Heating & cooling: Forced air heating (natural gas); Ceiling fan(s); No central air
- Interior features: Gas water heater; Free-standing gas range; Free-standing refrigerator; Crawl space basement; Five total rooms
Neighborhood map
What this means for you Summary
Snapshot
- This is a 2-bed/1.0-bath single-family listed at $139k.
Deal economics
- At list price, monthly cash flow is $-49 ($-593/yr) — negative.
- To cash-flow at today's rent, offer at most $130k (6.3% below list).
- To meet the 1% rule (rent ≥ 1% of price), the offer needs to be $133k (4.3% below list).
- Recommended offer: $130k (6.3% below list) — sets the bar for cash-flow.
- Cap rate 5.9% vs local median 4.2% in Southfield — top-decile yield for the area; either an underpriced asset or a hidden risk that comps aren't pricing in. Stress-test before assuming the spread holds.
Location & tenants
- Location reads 72/100 on livability (#248 in MI) — a middle-class / working-renter tenant base. Strengths: commute A+, cost of living A+, housing A+; Watch: schools D, health & safety D, crime F.
- Southfield Public School District (urban): math 17% / reading 37% proficiency, ranked #392 of 540 in MI (top 73%) — low school quality limits family demand, transient renter base, plan for 1-2y turnover.
- Market conditions: Rents rising fast (+8.1%/yr); 95 active listings in the ZIP; 30 comparable units currently listed for rent nearby; rentals at typical pace (median 25d on market — plan ~3-4 weeks tenant-placement turnaround); 43% of comp listings sitting > 30 days — soft ceiling on asking rent; 2,614 units permitted in Oakland County in 2024 (721 in 5+ unit buildings).
Forward outlook
- Local home prices are declining (-3.0%/yr); year-one equity from $961 of loan paydown is wiped out by about $4k of value loss. Plan a longer hold.
- Oakland County population projected at +10% by 2050 — modest demand growth; plan on rents tracking national, not racing it.
Negotiation context
- Only 11 days on market — expect competitive offers; lowballing is unlikely to land.
- 10 sale attempts since 22y ago with the ask held roughly flat each time — persistent listings suggest the price (not the market) is what's stuck; bring a comps-based counter.
- Current owner paid $105k; 32% above their basis — modest negotiation headroom, anchor on the comps not their cost.
Risks & watch-outs
- Watch-outs: property tax is 2.7% of price; built in 1947 — expect roof / HVAC / electrical / plumbing capex.
Questions for the listing agent
- What do current leases actually rent for vs. the listed asking? Can we see a recent rent roll and the last 12 months of T-12 income?
- Built in 1947 — when were the roof, HVAC, electrical panel, plumbing, and water heater last replaced?
- Property tax is high relative to price — has the assessment been appealed recently, and will the sale trigger a re-assessment?
- Is there a deadline driving the sale (1031 exchange, divorce, estate, relocation)? That informs how much negotiation room exists.
- Schools are D-rated, which usually means shorter tenancies and higher turnover. Who's the typical renter profile here, and what's been the actual vacancy rate?
- Crime grade is F in this area — have there been break-ins, vandalism, or insurance claims at this property in the last 3 years? What carrier currently insures it and at what premium?
- The area grade is low — what's the realistic commute time and amenity access for the typical tenant pool here? Any planned neighborhood developments (good or bad) we should know about?
- What's the average days-on-market for RENTAL listings here right now (not sales)? A rising rental-DOM trend means longer vacancies and softer asking-rent achievability than the comps imply.
- What's the recent tenant-quality profile in this submarket — average credit score on applications, eviction rate, late-payment / NSF rate, and stable-employment percentage? A property-management company in the area should have these aggregated.
- How much new for-sale + rental construction is in the pipeline within 1–3 miles? Heavy new supply typically softens prices + rents 12–24 months out; constrained supply supports both.
Investment metrics
- 1% rule
- 0.96% ✗
- Cap rate
- 5.87%
- Cash-on-cash
- -1.52%
- DSCR
- 0.93
- GRM
- 8.7
CMA / ARV
- ARV (median comp)
- $158,036
- List price
- $139,000
- Delta
- -12.05%
- Verdict
- UNDERPRICED
- Comps
- 20 within 1.0 mi
Show comp detail 12 sales within ~0.75 mi
| Address | Dist | Beds/Ba | Sqft | Sold | Price | $/sf | Match |
|---|---|---|---|---|---|---|---|
| 20210 Westhampton Ave | 0.02mi | 2/1.0 | 895 (0%) | 7mo | $125,000 | $140 | 93 |
| 20429 Midway Ave | 0.41mi | 2/1.0 | 864 (-4%) | 6mo | $74,900 | $87 | 70 |
| 19971 Patton St | 0.57mi | 2/1.5 | 901 (+1%) | 3mo | $54,000 | $60 | 68 |
| 20450 Midway Ave | 0.46mi | 3/1.0 (+1) | 864 (-4%) | 5mo | $150,000 | $174 | 64 |
| 20061 Pierson St | 0.58mi | 2/1.5 | 869 (-3%) | 4mo | $50,000 | $58 | 63 |
| 20746 Westland Dr | 0.32mi | 2/1.0 | 973 (+9%) | 11mo | $145,000 | $149 | 61 |
| 20634 Pembroke Ave | 0.67mi | 2/1.0 | 874 (-2%) | 9mo | $35,000 | $40 | 58 |
| 20619 Midway Ave | 0.47mi | 3/1.0 (+1) | 950 (+6%) | 8mo | $113,500 | $119 | 56 |
| 20575 Annchester Rd | 0.31mi | 3/1.0 (+1) | 1,018 (+14%) | 10mo | $94,000 | $92 | 50 |
| 20242 Braile St | 0.44mi | 3/1.0 (+1) | 1,015 (+13%) | 6mo | $115,000 | $113 | 48 |
| 20290 Stout St | 0.33mi | 3/2.0 (+1) | 1,024 (+14%) | 11mo | $78,000 | $76 | 42 |
| 20089 Trinity St | 0.65mi | 3/2.0 (+1) | 1,025 (+14%) | 4mo | $201,349 | $196 | 33 |
Match score weights: distance 35% · size 25% · config 20% · recency 20%. Top-matched comps best support the ARV.
Projected returns pro-forma
-3.0% appreciation · 8.0% rent growth · sell at horizon
- IRR
- -12.5%
- Equity multiple
- 0.52×
- Total profit
- $-18,535
- Equity at exit
- $20,725
- IRR
- 3.5%
- Equity multiple
- 1.31×
- Total profit
- $12,240
- Equity at exit
- $12,018
Cash invested: $38,920 (down + closing). Projections, not guarantees.
Landlord ↔ Tenant lean methodology
- Overall (STATE)
- 62 Landlord-Friendly
- State Michigan
- 62 Landlord-Friendly · EVEN
- County
- — inherits STATE
- City
- — inherits STATE
ZIP-level market 48075
- Rents YoY
- 8.1%
- Active inventory
- 95
- Price-to-rent
- 8.7×
Monthly cashflow live
- Estimated rent
- $1,331 high interval (Pro) →
- Mortgage (P&I)
- −$729
- Tax from tax record
- −$314 /mo · $3,764/yr
- Insurance
- −$58
- HOA
- −$0
- Vacancy / Maint / Mgmt
- −$279
- Net cashflow
- $-49
Break-even live
Sensitivity live
| Price | -10% $29 | -5% $-10 | +0% $-49 | +5% $-89 | +10% $-128 |
|---|---|---|---|---|---|
| Rent | -10% $-155 | -5% $-102 | +0% $-49 | +5% $3 | +10% $56 |
| Rate | -1.0pp $21 | -0.5pp $-14 | base $-49 | +0.5pp $-85 | +1.0pp $-122 |
UW: 25.0% down · 7.5% · 30yr · 1.5% tax · 5.0% vac · 8.0% maint · 8.0% mgmt
Financing live
Cash to close
- Down payment
- $34,750
- Closing costs
- $4,170
- Reserves months
- —
- Total cash needed
- —
Loan-product check · same deal, 3 products live
Conventional
25% down · 7.5% · 30yr
- Down + closing
- —
- Monthly P&I
- —
- Monthly cashflow
- —
- DSCR
- —
- Eligible?
- —
Personal DTI + credit; lowest rate.
DSCR
20% down · 8.5% · 30yr
- Down + closing
- —
- Monthly P&I
- —
- Monthly cashflow
- —
- DSCR
- —
- Eligible?
- —
No personal income docs; deal must DSCR.
Hard money
10% down · 12.0% · 12mo
- Down + closing
- —
- Monthly P&I
- —
- Monthly cashflow
- —
- DSCR
- —
- Eligible?
- —
Short-term bridge; refi at stabilization.
Rent comps 30 comps
| Address | Beds | Baths | Sqft | Rent | $/sqft | DOM | Units | Dist |
|---|---|---|---|---|---|---|---|---|
| 20271 Grandville Ave Detroit, MI | 3.0 | 1.0 | 1010 | $1,550 | $1.53 | 24d | 1 | 0.49mi |
| 19781 Fielding St Detroit, MI | 3.0 | 1.0 | 1000 | $1,294 | $1.29 | 5d | 1 | 0.71mi |
| 19457 Evergreen Rd Detroit, MI | 2.0 | 1.0 | 1100 | $1,200 | $1.09 | 44d | 1 | 0.83mi |
| 20011 Avon Ave Detroit, MI | 3.0 | 1.0 | 1000 | $1,200 | $1.20 | 5d | 1 | 0.85mi |
| 21210 Lahser Rd Southfield, MI | 1.0 | 1.0 | 770 | $1,175 | $1.53 | 6d | 1 | 0.88mi |
| 21422 Pembroke Ave Detroit, MI | 3.0 | 1.5 | 1000 | $1,695 | $1.70 | 17d | 1 | 0.93mi |
| 47129 Wedgewood Southfield, MI | 1.0–2.0 | 1.0–2.0 | 1000 | $1,275 | $1.27 | 44d | 1 | 0.95mi |
| 20068 Faust Ave Detroit, MI | 2.0 | 1.0 | 750 | $1,100 | $1.47 | 25d | 1 | 0.95mi |
| 20527 Rosemont Ave Detroit, MI | 2.0 | 2.0 | 975 | $1,528 | $1.57 | 44d | 1 | 0.96mi |
| 19372 Grandville Ave Detroit, MI | 2.0 | 1.5 | 733 | $1,050 | $1.43 | 15d | 1 | 1.00mi |
| 20555 Lahser Rd Detroit, MI | 1.0–2.0 | 1.0 | 737 | $975 | $1.32 | 44d | 2 | 1.01mi |
| 22045 Michigan 102 Detroit, MI | 1.0 | 1.0 | 750 | $775 | $1.03 | 44d | 1 | 1.02mi |
| 20539 Southfield Rd Detroit, MI | 1.0 | 1.0 | 700 | $800 | $1.14 | 11d | 4 | 1.07mi |
| 19445 Avon Ave Detroit, MI | 3.0 | 1.0 | 1023 | $1,550 | $1.52 | 44d | 1 | 1.08mi |
| 19176 Grandville Ave Detroit, MI | 3.0 | 1.0 | 941 | $1,300 | $1.38 | 5d | 1 | 1.14mi |
| 19970 Ashton Ave Detroit, MI | 3.0 | 1.0 | 1000 | $1,000 | $1.00 | 44d | 1 | 1.14mi |
| 19329 Stahelin Ave Unit 1 Detroit, MI | 3.0 | 1.5 | 833 | $1,250 | $1.50 | 44d | 1 | 1.15mi |
| 19928 Houghton St Detroit, MI | 3.0 | 1.0 | 880 | $1,495 | $1.70 | 11d | 1 | 1.19mi |
| 20043 Fenmore St Detroit, MI | 3.0 | 1.0 | 1030 | $1,453 | $1.41 | 44d | 1 | 1.23mi |
| 22238 Pembroke Ave Detroit, MI | 3.0 | 1.5 | 1100 | $1,500 | $1.36 | 44d | 1 | 1.25mi |
| 19918 Southfield Fwy Detroit, MI | 3.0 | 1.0 | 915 | $1,375 | $1.50 | 15d | 1 | 1.25mi |
| 20259 Oakfield St Detroit, MI | 3.0 | 1.0 | 1056 | $1,250 | $1.18 | 17d | 1 | 1.30mi |
| 19818 Fenmore St Detroit, MI | 3.0 | 1.0 | 902 | $1,275 | $1.41 | 44d | 1 | 1.31mi |
| 18699 Shaftsbury Ave Detroit, MI | 2.0 | 1.0 | 800 | $1,000 | $1.25 | 44d | 1 | 1.33mi |
| 18556 Kentfield St Detroit, MI | 3.0 | 1.0 | 952 | $1,250 | $1.31 | 3d | 1 | 1.34mi |
| 18659 Shaftsbury Ave Detroit, MI | 3.0 | 1.0 | 763 | $1,373 | $1.80 | 13d | 1 | 1.37mi |
| 20203 Gilchrist St Detroit, MI | 3.0 | 1.0 | 1031 | $1,250 | $1.21 | 5d | 1 | 1.42mi |
| 18461 Heyden St Detroit, MI | 2.0 | 1.0 | 1000 | $1,050 | $1.05 | 5d | 1 | 1.43mi |
| 20314 Gilchrist St Detroit, MI | 3.0 | 1.0 | 1042 | $1,500 | $1.44 | 5d | 1 | 1.43mi |
| 18450 Edinborough Rd Detroit, MI | 3.0 | 1.0 | 1000 | $1,500 | $1.50 | 44d | 1 | 1.47mi |
Listing history 38 events
-
2026-06-21days on market $139,000 Active 11 DOM
-
2026-06-18days on market $139,000 Active 8 DOM
-
2026-06-17days on market $139,000 Active 7 DOM
-
2026-06-16days on market $139,000 Active 6 DOM
-
2026-06-15days on market $139,000 Active 5 DOM
-
2026-06-13days on market $139,000 Active 3 DOM
-
2026-06-13days on market $139,000 Active 2 DOM
-
2026-06-09days on market $139,000 Active 49 DOM
-
2026-06-08days on market $139,000 Active 48 DOM
-
2026-06-07days on market $139,000 Active 47 DOM
-
2026-06-04days on market $139,000 Active 44 DOM
-
2026-06-03days on market $139,000 Active 43 DOM
-
2026-06-02days on market $139,000 Active 42 DOM
-
2026-06-01days on market $139,000 Active 41 DOM
-
2026-05-31days on market $139,000 Active 40 DOM
-
2026-04-21$139,000 Active 592-char remark
-
2026-04-21$139,000 Active 592-char remark
-
2024-04-10soldstatus $105,000
-
2024-02-21soldstatus $105,000 Sold
-
2024-02-21soldstatus $105,000 Closed
-
2024-01-12status Pending
-
2024-01-12status Pending
-
2024-01-02historical Accepting Backup Offers
-
2024-01-02historical Accepting Backup Offers
-
2023-11-15$125,000 Active
-
2023-11-15$125,000 Active
-
2023-11-12historical $125,000
-
2023-11-12historical $125,000
-
2013-03-14historical
-
2013-03-14historical
-
2013-01-17$26,800
-
2013-01-17$26,800
-
2005-04-01soldstatus $123,000
-
2005-01-19historical
-
2004-11-01$109,000
-
2004-10-28soldstatus $66,000
-
2004-10-22soldstatus $66,000
-
2004-08-13$67,400
ⓘ Source: listings_history table (triggers on properties + properties_extension) + one-shot
backfill from property_details.listing_events for pre-trigger history.
Tax reassessment forecast MI · Partial reset (capped growth)
- Current annual tax
- $3,764 · $314/mo
- Projected year-2 tax
- $3,764 · $314/mo
- Expected delta
- $0/yr ($0/mo · 0.0%)
ⓘ Screening estimate from a state-policy table — verify with the county assessor before closing.
Climate risk First Street
- Flood 1/10 Low FEMA zone X (unshaded) · 0% chance over 30 yrs
- Wildfire 1/10 Low
- Heat 2/10 Low 7 d/yr ≥97°F today · 15 d/yr by 30 yrs out
- Wind 2/10 Low
- Air quality 3/10 Moderate 2 unhealthy d/yr today · 5 by 30 yrs out
Nearby sold comps map
Loading sold comps map…
Walkable amenities ~0.75 mi
Loading nearby amenities…
Taxation est. · year 1
- Rental income
- $15,966
- − Mortgage interest
- −$7,786
- − Property taxes
- −$3,764
- − Insurance
- −$695
- − Repairs & maintenance
- −$1,277
- − Management
- −$1,277
- − Depreciation
- −$4,044
- Taxable loss
- −$2,878
- Est. tax savings @ 24.0%
- +$691
- After-tax cash flow
- $97/yr
For passive investors: Depreciation is non-cash, so a rental often shows a tax loss while cash-flowing — sheltering income. Rental losses are passive: they offset passive income freely, and up to $25,000/yr can offset ordinary (W-2) income if you actively participate and your MAGI is under $100k (phasing out to $0 by $150k); unused losses carry forward. On sale, claimed depreciation is recaptured at up to 25%, and gains may owe capital-gains tax (a 1031 exchange can defer both). Figures are a year-1 estimate at your 24.0% rate — not tax advice; consult a CPA.
Schools (NCES district)
- District
- Southfield Public School District
- NCES district ID
- 2632310
- Math proficiency
- 17% ▼ -3.00%
- Reading proficiency
- 37% ▲ 1.00%
- Median HH income
- $51,400
- Composite
- 23.77/100
- National rank
- #7814
- State rank
- #392 of 540 in MI
Livability — Southfield
- Score
- 72/100
- State rank
- #248
- US rank
- #6175
Category grades
Schools grade is shown separately in the Schools card above.
Census & demographics
- Census place
- Southfield, MI
- County
- Oakland County · 1,009,092 people
- City population
- 54,914
- Metro
- Detroit-Warren-Dearborn, MI
- Population (ZIP)
- 22,841
- Household income
- $65,384
- Rent vs Own
- Severe rent burden
- 1336.0
Population outlook (Oakland County) Hauer SSP2
- Today (2025)
- 1,335,747 people
- By 2030
- 1,375,100 · +2.9%
- By 2040
- 1,435,385 · +7.5%
- By 2050
- 1,469,250 · +10.0%
- By 2075
- 1,531,946 · +14.7%
- By 2100
- 1,450,485 · +8.6%
Race, ethnicity, and origin ACS 2023
- Neighborhood character
- Majority Black (65%)
- Race & ethnicity
- Black 65% White 26% Two or more races 7% Hispanic / Latino 1%
- Common ancestry
- Romanian 2% Scotch-Irish 2% Subsaharan African 1%
- Foreign-born
- 4% · Canada
- Languages at home
- 94% English-only · Russian/Polish/Slavic 1% Spanish 1% German/W. Germanic 1%
Political lean MEDSL · Oakland
- 2024 margin
- D (+10.6) · D 54.4% · R 43.8% · Other 1.9%
- 2008→2024 swing
- -3.9pp toward R · 2008: 14.5pp · 2024: 10.6pp
- All cycles
- 2024: D+10.6 2020: D+14.1 2016: D+8.1 2012: D+8.1 2008: D+14.5
Not yet ingested
- Civics
- —
Market trends
- HPI YoY
- ▼ -209.20%
- Current HPI
- 190.3275
- Rent YoY
- ▲ 8.06%
- Metro
- Detroit-Warren-Dearborn, MI
- State GDP YoY
- ▲ 1.37%
- F500 in state
- 28
Industry mix (Fortune 500 HQ in MI)
| Industry | F500 HQs | Revenue |
|---|---|---|
| Automotive Parts | 3 | $48B |
|
||
| Automotive | 2 | $372B |
|
||
| Chemicals | 1 | $45B |
|
||
| Automotive Retail | 1 | $29B |
|
||
| Healthcare / Medical Devices | 1 | $23B |
|
||
| Automotive Technology | 1 | $20B |
|
||
Price history
+106.2% since first listed27 events — show timeline
- 2026-06-10 Listed $139,000 REALCOMP
- 2026-06-10 Listing Removed — REALCOMP
- 2026-06-10 Listing Removed — MiRealSource-MiMLS
- 2026-06-10 Listed $139,000 MiRealSource-MiMLS
- 2026-04-21 Listed $139,000 REALCOMP
- 2026-04-21 Listed $139,000 MiRealSource-MiMLS
- 2024-04-10 Sold (Public Records) $105,000 Public Records
- 2024-02-21 Sold (MLS) $105,000 MiRealSource-MiMLS
- 2024-02-21 Sold (MLS) $105,000 REALCOMP
- 2024-01-12 Pending — MiRealSource-MiMLS
- 2024-01-12 Pending — REALCOMP
- 2024-01-02 Contingent — MiRealSource-MiMLS
- 2024-01-02 Contingent — REALCOMP
- 2023-11-15 Listed $125,000 MiRealSource-MiMLS
- 2023-11-15 Listed $125,000 REALCOMP
- 2023-11-12 Coming Soon $125,000 MiRealSource-MiMLS
- 2023-11-12 Coming Soon $125,000 REALCOMP
- 2013-03-14 Listing Removed — REALCOMP
- 2013-03-14 Listing Removed — MiRealSource-MiMLS
- 2013-01-17 Listed $26,800 REALCOMP
- 2013-01-17 Listed $26,800 MiRealSource-MiMLS
- 2005-04-01 Sold (Public Records) $123,000 Public Records
- 2005-01-19 Listing Removed — REALCOMP
- 2004-11-01 Listed $109,000 REALCOMP
- 2004-10-28 Sold (Public Records) $66,000 Public Records
- 2004-10-22 Sold (MLS) $66,000 REALCOMP
- 2004-08-13 Listed $67,400 REALCOMP
Property tax history
+8.4%/yrLatest (2025): $3,764 · +161.5% YoY. Source: county tax records.
Cash-flow waterfall
monthlySold comps — $/sqft
last 12 mo · ≤1 miLoading sold comps…