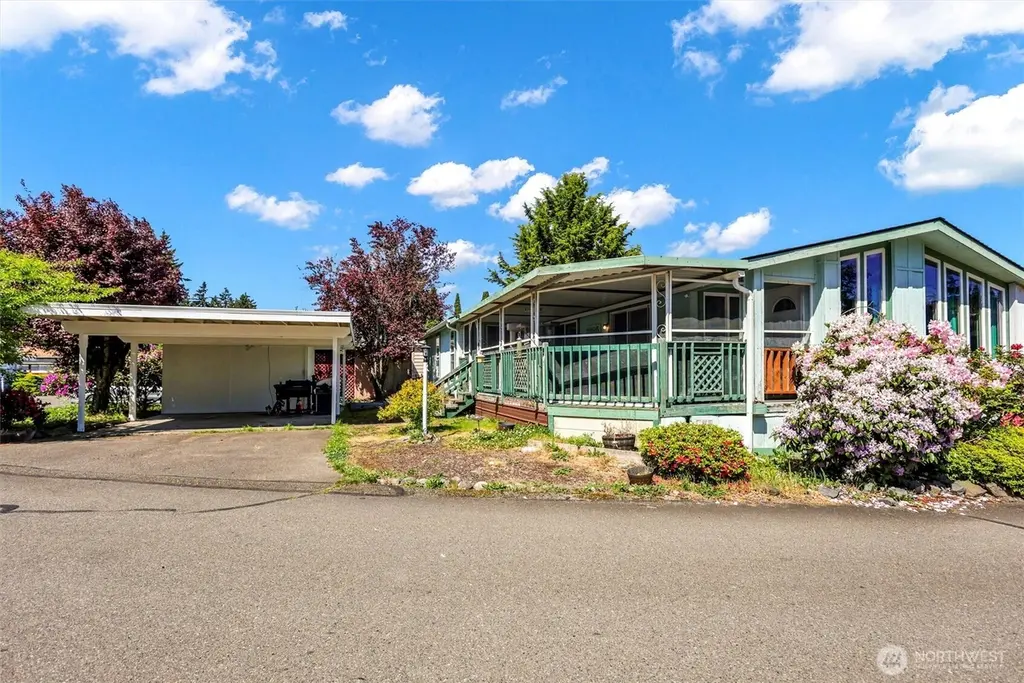
5303 90th St E #1 · Summit, WA
Flood risk 1/10 · Minimal
- FEMA flood zone
- X (unshaded)
- Chance of flooding over 30 yrs
- 0.0%
- Est. flood insurance / yr
- $507 – $1,088
Fire risk 1/10 · Minimal
- Est. fire insurance / yr
- $604 – $1,122
Heat risk 3/10 · Minor
- Hot days now (above 87°F)
- 7 days/yr
- Hot days in 30 yrs
- 16 days/yr
Wind risk 1/10 · Minimal
- Chance of severe wind over 30 yrs
- —
Air-quality risk 7/10 · Major
- Unhealthy air days now
- 10 days/yr
- Unhealthy air days in 30 yrs
- 12 days/yr
Risk factors via First Street. Map © Google.
Why this score? — see what drove the B grade
The composite is a weighted blend of 9 inputs, each scored 0–100. Each bar is that input's sub-score; the figure is the points it added to the 100-point composite (weight × sub-score).
- Cash flow +30.0/30.0
- 1% rule +10.0/10.0
- DSCR +10.0/10.0
- ARV discount +7.5/15.0
- Schools +3.9/10.0
- Rent growth +3.8/5.0
- Livability +3.3/5.0
- Condition / age +2.5/5.0
- Appreciation +0.0/10.0
$105,000
🖨 Deal sheet 📄 Offer letter ✓ Due diligence
Listing remarks
Enjoy comfortable easy living in this doublewide manufactured home located in a quiet Summit area park. The enclosed covered porch offers additional useable space and connects seamlessly with a slider leading to the main living area with vaulted ceilings and a cozy wood burning fireplace and central A/C! New roof installed 2021. The large primary suite provides a generous walk-in closet and nicely remodeled bathroom featuring a clawfoot soaking tub and separate shower. Large second bedroom also attached to updated full bath! Large functional utility room with w/ d included leads to the back deck and fenced yard! Great layout! Don't miss this opportunity for this affordable low maintenanc
Key facts
- Clawfoot soaking tub
- Walk-in closet
- Separate shower
Tags
Property features AI
Finance
- Other: Property type: Residential (Manufactured Home); Style: Manuf-Double Wide; Structure type: Manufactured house; Calculated building area: 1579; Levels: One
- Financial info: Cash offers only
- HOA & community: Canyon Heights park (77 homes); Park approved for sale; Senior exemption available; Land lease: $785
Exterior
- Parking: Carport
- Utilities: Electric energy source; Public water (Guardian); Sewer service (Guardian); Power by Tacoma Public Utilities; Electric water heater located on deck; Internet: Xfinity
- Home design: Manufactured double-wide home; One level; Average condition; Manufactured after 6/15/1976; Mobile home remains; Lancr make; Entry with vaulted ceilings
- Construction: Wood construction; Composition roof; Tie-down foundation
- Exterior features: Wood exterior; Paved lot; Patio/porch/deck
Interior
- Kitchen: Dishwasher; Stove/Range; Refrigerator
- Bedrooms: 2 bedrooms
- Flooring: Vinyl plank; Carpet
- Bathrooms: 2 full bathrooms; 2 bathtubs; 2 showers
- Heating & cooling: Forced air heating; Central air conditioning
- Interior features: Water heater; Wet bar; Vaulted ceilings; Double pane windows; Patio/porch/deck
- Laundry & utility: Washer; Dryer
Neighborhood map
What this means for you Summary
Snapshot
- This is a 2-bed/2.0-bath manufactured listed at $105k.
Deal economics
- At list price, monthly cash flow is $1k ($12k/yr) — positive.
- The deal already cash-flows at list — no discount required.
- Meets the 1% rule at list price ($2k rent vs $105k).
- Recommended offer: $103k (1.5% below list) — sets the bar for market timing.
- Cap rate 17.9% vs local median 2.5% in Summit — top-decile yield for the area; either an underpriced asset or a hidden risk that comps aren't pricing in. Stress-test before assuming the spread holds.
Location & tenants
- Location reads 66/100 on livability (#318 in WA) — a middle-class / working-renter tenant base. Strengths: housing A+, health & safety A+, employment A; Watch: schools D-, amenities F, commute F.
- Franklin Pierce School District (suburban): math 35% / reading 51% proficiency, ranked #197 of 291 in WA (top 68%) — families likely to look elsewhere, expect single-tenant / working-renter base with shorter leases.
- Market conditions: Rents rising fast (+5.2%/yr); 116 active listings in the ZIP; 6 comparable units currently listed for rent nearby; rentals leasing fast (median 5d on market — plan ~1-2 weeks tenant-placement turnaround); solid renter incomes; 3,209 units permitted in Pierce County in 2024 (1,269 in 5+ unit buildings).
Forward outlook
- Local home prices are declining (-3.0%/yr); year-one equity from $726 of loan paydown is wiped out by about $3k of value loss. Plan a longer hold.
- Pierce County population projected at +26% by 2050 — long-run rental-demand tailwind backs the buy-and-hold thesis.
- At projected returns (-3.0% appreciation + 5.2% rent growth), your $29k cash investment doubles in ~3 years — after that, you're playing with house money.
Negotiation context
- It's been on market 30 days — a 2% lower offer ($103k) is reasonable based on typical stale-listing flexibility.
- 3 sale attempts since 5y ago with the ask held roughly flat each time — persistent listings suggest the price (not the market) is what's stuck; bring a comps-based counter.
- Current owner paid $70k; list at $105k implies a 50% gain — meaningful room to come down on a strong offer.
Questions for the listing agent
- Built in 1979 — when were the roof, HVAC, electrical panel, plumbing, and water heater last replaced?
- Is there a deadline driving the sale (1031 exchange, divorce, estate, relocation)? That informs how much negotiation room exists.
- Schools are D-rated, which usually means shorter tenancies and higher turnover. Who's the typical renter profile here, and what's been the actual vacancy rate?
- What's the average days-on-market for RENTAL listings here right now (not sales)? A rising rental-DOM trend means longer vacancies and softer asking-rent achievability than the comps imply.
- What's the recent tenant-quality profile in this submarket — average credit score on applications, eviction rate, late-payment / NSF rate, and stable-employment percentage? A property-management company in the area should have these aggregated.
- How much new for-sale + rental construction is in the pipeline within 1–3 miles? Heavy new supply typically softens prices + rents 12–24 months out; constrained supply supports both.
Investment metrics
- 1% rule
- 2.08% ✓
- Cap rate
- 17.95%
- Cash-on-cash
- 41.62%
- DSCR
- 2.85
- GRM
- 4.0
CMA / ARV
- ARV (median comp)
- $257,500
- List price
- $105,000
- Delta
- -59.22%
- Verdict
- UNDERPRICED
- Comps
- 17 within 1.0 mi
Show comp detail 12 sales within ~0.75 mi
| Address | Dist | Beds/Ba | Sqft | Sold | Price | $/sf | Match |
|---|---|---|---|---|---|---|---|
| 5902 89th Street Ct E #11 | 0.36mi | 2/2.0 | 1,596 (+1%) | 1mo | $289,000 | $181 | 80 |
| 9314 Canyon Rd E #82 | 0.22mi | 2/2.0 | 1,526 (-3%) | 5mo | $100,000 | $66 | 80 |
| 9314 Canyon Rd E #39 | 0.22mi | 3/2.0 (+1) | 1,504 (-5%) | 3mo | $168,000 | $112 | 75 |
| 9314 Canyon Rd E #85 | 0.22mi | 3/2.0 (+1) | 1,460 (-8%) | 0mo | $119,000 | $82 | 72 |
| 5115 88th Street Ct E #29 | 0.15mi | 2/2.0 | 1,436 (-9%) | 9mo | $129,950 | $90 | 70 |
| 6022 89th Street Ct E #20 | 0.47mi | 3/2.0 (+1) | 1,528 (-3%) | 2mo | $257,500 | $169 | 66 |
| 6011 89th St E #59 | 0.42mi | 2/2.0 | 1,692 (+7%) | 4mo | $280,000 | $165 | 66 |
| 5801 89th Street Ct E #5 | 0.30mi | 3/2.0 (+1) | 1,496 (-5%) | 10mo | $151,000 | $101 | 63 |
| 6012 91st Street Ct E | 0.47mi | 3/2.0 (+1) | 1,599 (+1%) | 10mo | $309,000 | $193 | 63 |
| 5916 89th Street Ct E #14 | 0.40mi | 2/2.0 | 1,712 (+8%) | 10mo | $350,100 | $204 | 59 |
| 6124 91ST St E #148 | 0.53mi | 3/2.0 (+1) | 1,716 (+9%) | 6mo | $310,000 | $181 | 51 |
| 6009 90th Street Ct E #107 | 0.45mi | 3/2.0 (+1) | 1,771 (+12%) | 7mo | $320,000 | $181 | 48 |
Match score weights: distance 35% · size 25% · config 20% · recency 20%. Top-matched comps best support the ARV.
Projected returns pro-forma
-3.0% appreciation · 5.17% rent growth · sell at horizon
- IRR
- 40.7%
- Equity multiple
- 2.80×
- Total profit
- $52,834
- Equity at exit
- $15,656
- IRR
- 48.0%
- Equity multiple
- 6.12×
- Total profit
- $150,664
- Equity at exit
- $9,078
Cash invested: $29,400 (down + closing). Projections, not guarantees.
Landlord ↔ Tenant lean methodology
- Overall (STATE)
- 28 Tenant-Leaning
- State Washington
- 28 Tenant-Leaning · D+8
- County
- — inherits STATE
- City
- — inherits STATE
ZIP-level market 98446
- Rents YoY
- 5.2%
- Active inventory
- 116
- Price-to-rent
- 4.0×
Monthly cashflow live
- Estimated rent
- $2,188 high interval (Pro) →
- Mortgage (P&I)
- −$551
- Tax from tax record
- −$114 /mo · $1,372/yr
- Insurance
- −$44
- HOA
- −$0
- Vacancy / Maint / Mgmt
- −$459
- Net cashflow
- $1,020
Break-even live
UW: 25.0% down · 7.5% · 30yr · 1.5% tax · 5.0% vac · 8.0% maint · 8.0% mgmt
Financing live
Cash to close
- Down payment
- $26,250
- Closing costs
- $3,150
- Reserves months
- —
- Total cash needed
- —
Loan-product check · same deal, 3 products live
Conventional
25% down · 7.5% · 30yr
- Down + closing
- —
- Monthly P&I
- —
- Monthly cashflow
- —
- DSCR
- —
- Eligible?
- —
Personal DTI + credit; lowest rate.
DSCR
20% down · 8.5% · 30yr
- Down + closing
- —
- Monthly P&I
- —
- Monthly cashflow
- —
- DSCR
- —
- Eligible?
- —
No personal income docs; deal must DSCR.
Hard money
10% down · 12.0% · 12mo
- Down + closing
- —
- Monthly P&I
- —
- Monthly cashflow
- —
- DSCR
- —
- Eligible?
- —
Short-term bridge; refi at stabilization.
Rent comps 6 comps
| Address | Beds | Baths | Sqft | Rent | $/sqft | DOM | Units | Dist |
|---|---|---|---|---|---|---|---|---|
| 2506 103rd St E Puyallup, WA | 2.0 | 1.0 | 1025 | $1,877 | $1.83 | 4d | 3 | 0.93mi |
| 5923 111th Street Ct E Puyallup, WA | 3.0 | 2.5 | 1364 | $2,600 | $1.91 | 1d | 1 | 1.44mi |
| 5909 111th Street Ct E Puyallup, WA | 3.0 | 2.5 | 1356 | $2,395 | $1.77 | 15d | 1 | 1.47mi |
| 6115 111th St E Puyallup, WA | 1.0–3.0 | 1.0–2.0 | 911 | $1,995 | $2.19 | 1d | 16 | 1.47mi |
| 9604 S Fruitland Unit 7502 Puyallup, WA | 2.0 | 2.0 | 1492 | $2,500 | $1.68 | 1d | 1 | 1.47mi |
| 5617 112th St E Puyallup, WA | 1.0–3.0 | 1.0–2.0 | 947 | $1,880 | $1.99 | 11d | 17 | 1.49mi |
Listing history 21 events
-
2026-06-18days on market $105,000 Active 30 DOM
-
2026-06-17days on market $105,000 Active 29 DOM
-
2026-06-16days on market $105,000 Active 28 DOM
-
2026-06-15days on market $105,000 Active 27 DOM
-
2026-06-13days on market $105,000 Active 25 DOM
-
2026-06-13days on market $105,000 Active 24 DOM
-
2026-06-09days on market $105,000 Active 21 DOM
-
2026-06-08days on market $105,000 Active 20 DOM
-
2026-06-07pricedays on market $105,000 Active 19 DOM
-
2026-06-04days on market $110,000 Active 16 DOM
-
2026-06-03days on market $110,000 Active 15 DOM
-
2026-06-02days on market $110,000 Active 14 DOM
-
2026-06-01days on market $110,000 Active 13 DOM
-
2026-05-31days on market $110,000 Active 12 DOM
-
2026-05-17status Pending
-
2026-05-14$110,000 Active
-
2021-09-22soldstatus $70,000 Closed
-
2021-09-04status Pending
-
2021-08-31price $70,000
-
2021-08-26price $80,000
-
2021-08-20$90,000 Active
ⓘ Source: listings_history table (triggers on properties + properties_extension) + one-shot
backfill from property_details.listing_events for pre-trigger history.
Tax reassessment forecast WA · Resets to sale price
- Current annual tax
- $1,372 · $114/mo
- Projected year-2 tax
- $1,372 · $114/mo
- Expected delta
- $0/yr ($0/mo · 0.0%)
ⓘ Screening estimate from a state-policy table — verify with the county assessor before closing.
Climate risk First Street
- Flood 1/10 Low FEMA zone X (unshaded) · 0% chance over 30 yrs
- Wildfire 1/10 Low
- Heat 3/10 Moderate 7 d/yr ≥87°F today · 16 d/yr by 30 yrs out
- Wind 1/10 Low
- Air quality 7/10 Severe 10 unhealthy d/yr today · 12 by 30 yrs out
Nearby sold comps map
Loading sold comps map…
Walkable amenities ~0.75 mi
Loading nearby amenities…
Taxation est. · year 1
- Rental income
- $26,255
- − Mortgage interest
- −$5,882
- − Property taxes
- −$1,372
- − Insurance
- −$525
- − Repairs & maintenance
- −$2,100
- − Management
- −$2,100
- − Depreciation
- −$3,055
- Taxable income
- $11,221
- Est. tax owed @ 24.0%
- −$2,693
- After-tax cash flow
- $9,544/yr
For passive investors: Depreciation is non-cash, so a rental often shows a tax loss while cash-flowing — sheltering income. Rental losses are passive: they offset passive income freely, and up to $25,000/yr can offset ordinary (W-2) income if you actively participate and your MAGI is under $100k (phasing out to $0 by $150k); unused losses carry forward. On sale, claimed depreciation is recaptured at up to 25%, and gains may owe capital-gains tax (a 1031 exchange can defer both). Figures are a year-1 estimate at your 24.0% rate — not tax advice; consult a CPA.
Schools (NCES district)
- District
- Franklin Pierce School District
- NCES district ID
- 5302940
- Math proficiency
- 35% ▬ 0.00%
- Reading proficiency
- 51% ▲ 2.00%
- Median HH income
- $49,240
- Composite
- 39.18/100
- National rank
- #8227
- State rank
- #197 of 291 in WA
Livability — Summit
- Score
- 66/100
- State rank
- #318
- US rank
- #11661
Category grades
Schools grade is shown separately in the Schools card above.
Census & demographics
- Census place
- Summit, WA
- County
- Pierce County · 788,257 people
- Metro
- Seattle-Tacoma-Bellevue, WA
- Population (ZIP)
- 14,634
- Household income
- $101,938
- Rent vs Own
- Severe rent burden
- 246.0
Population outlook (Pierce County) Hauer SSP2
- Today (2025)
- 956,648 people
- By 2030
- 1,010,862 · +5.7%
- By 2040
- 1,113,170 · +16.4%
- By 2050
- 1,206,524 · +26.1%
- By 2075
- 1,436,425 · +50.2%
- By 2100
- 1,563,654 · +63.5%
Race, ethnicity, and origin ACS 2023
- Neighborhood character
- Diverse neighborhood (Simpson 0.59)
- Race & ethnicity
- White 61% Two or more races 17% Hispanic / Latino 17% Black 6% Asian 4% Pacific Islander 3% Native American 2%
- Hispanic origin (detail)
- Mexican 11% Puerto Rican 1%
- Common ancestry
- Portuguese 4% Serbian 3% Italian 3%
- Foreign-born
- 7% · Canada, South Korea
- Languages at home
- 80% English-only · Spanish 11% Other Asian/Pacific 3% Russian/Polish/Slavic 2%
Political lean MEDSL · Pierce
- 2024 margin
- D (+10.8) · D 53.9% · R 43.1% · Other 3.0%
- 2008→2024 swing
- -1.4pp toward R · 2008: 12.2pp · 2024: 10.8pp
- All cycles
- 2024: D+10.8 2020: D+11.2 2016: D+7.5 2012: D+11.0 2008: D+12.2
Not yet ingested
- Civics
- —
Market trends
- HPI YoY
- ▼ -562.34%
- Current HPI
- 322.6286
- Rent YoY
- ▲ 5.17%
- Metro
- Seattle-Tacoma-Bellevue, WA
- State GDP YoY
- ▲ 4.65%
- F500 in state
- 22
Industry mix (Fortune 500 HQ in WA)
| Industry | F500 HQs | Revenue |
|---|---|---|
| Retail | 2 | $269B |
|
||
| Technology / Retail | 1 | $638B |
|
||
| Technology | 1 | $245B |
|
||
| Telecommunications | 1 | $38B |
|
||
| Food / Beverage | 1 | $36B |
|
||
| Automotive / Trucks | 1 | $34B |
|
||
Price history
+16.7% since first listed9 events — show timeline
- 2026-06-05 Price Changed $105,000 NWMLS as Distributed by MLS Grid
- 2026-05-23 Relisted — NWMLS as Distributed by MLS Grid
- 2026-05-17 Pending — NWMLS as Distributed by MLS Grid
- 2026-05-14 Listed $110,000 NWMLS as Distributed by MLS Grid
- 2021-09-22 Sold (MLS) $70,000 NWMLS as Distributed by MLS Grid
- 2021-09-04 Pending — NWMLS as Distributed by MLS Grid
- 2021-08-31 Price Changed $70,000 NWMLS as Distributed by MLS Grid
- 2021-08-26 Price Changed $80,000 NWMLS as Distributed by MLS Grid
- 2021-08-20 Listed $90,000 NWMLS as Distributed by MLS Grid
Property tax history
+9.4%/yrLatest (2026): $1,372 · +12.7% YoY. Source: county tax records.
Cash-flow waterfall
monthlySold comps — $/sqft
last 12 mo · ≤1 miLoading sold comps…