2190 Arbour Walk Cir #2221 · Pine Ridge, FL
Flood risk 4/10 · Minor
- FEMA flood zone
- X (shaded)
- Chance of flooding over 30 yrs
- 0.18%
- Est. flood insurance / yr
- $507 – $1,088
Fire risk 1/10 · Minimal
- Est. fire insurance / yr
- $947 – $1,759
Heat risk 10/10 · Severe
- Hot days now (above 107°F)
- 7 days/yr
- Hot days in 30 yrs
- 30 days/yr
Wind risk 10/10 · Severe
- Chance of severe wind over 30 yrs
- 99.0%
Air-quality risk 2/10 · Minimal
- Unhealthy air days now
- 2 days/yr
- Unhealthy air days in 30 yrs
- 2 days/yr
Risk factors via First Street. Map © Google.
Why this score? — see what drove the D grade
The composite is a weighted blend of 9 inputs, each scored 0–100. Each bar is that input's sub-score; the figure is the points it added to the 100-point composite (weight × sub-score).
- Cash flow +7.5/30.0
- ARV discount +7.5/15.0
- 1% rule +5.6/10.0
- Appreciation +5.1/10.0
- Schools +5.0/10.0
- Livability +3.4/5.0
- Rent growth +2.7/5.0
- Condition / age +2.5/5.0
- DSCR +1.6/10.0
$205,000
🖨 Deal sheet (PDF) 📄 Offer letter ✓ Due diligence
Listing remarks
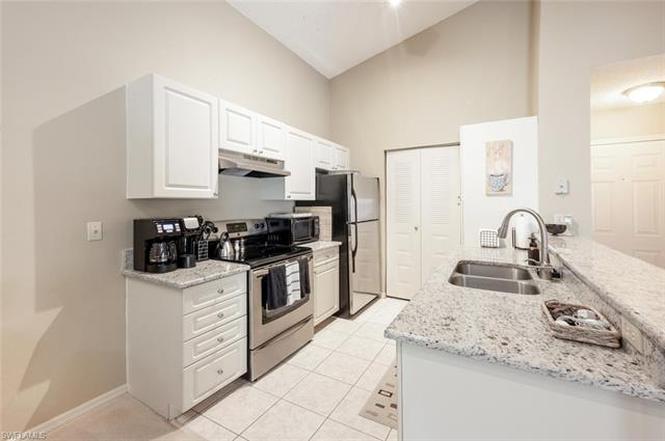
LOCATION, LOCATION, LOCATION! Situated in NORTH NAPLES, West of I-75, this desirable community is just 12 minutes to VANDERBILT BEACH, 8 minutes to MERCATO'S premier shopping and dining, and 15 minutes to beautiful Downtown Naples. OASIS offers an enviable location. PRICED TO SELL, this is A SECOND FLOOR, 2-bedroom, 2-bath residence in pristine, MOVE-IN ready. The home features an UPGRADED KITCHEN with STAINLESS STEEL APPLIANCES and GRANITE countertops, along with large walk-in closets and a FULLY RENOVATED PRIMARY BATHROOM. A NEWER ROOF (2019) for your peace of mind (Wind Mitigation Report available). Residents enjoy GREAT amenities including a resort-style pool, spa, tennis courts, and a
Key facts
- Newer roof
- Upgraded kitchen
- Walk-in closets
Tags
Property features AI
Finance
- HOA & community: Mandatory HOA with professional management; Monthly condo fee; Monthly condo fee amount is charged (fee covers insurance, irrigation water, lawn/land maintenance, exterior pest control, sewer, street lights, street maintenance, and water); Community amenities include clubhouse, community pool, community room, community spa/hot tub, exercise room, internet access, play area, and tennis court; Non-gated community with tennis
Exterior
- Parking: Common parking
- Utilities: Assessment-paid water; Central sewer; Cable available
- Home design: Residential property in a low-rise (1-3) building; Garden-style, multi-story home; Rear exposure faces north; Built in 1992; Located in the OASIS development
- Construction: Wood frame construction
- Exterior features: Stucco exterior; Single-hung windows; Shingle roof; Central irrigation; View of parking lot; No canal/dock
Interior
- Kitchen: Dishwasher; Microwave; Range; Refrigerator
- Bedrooms: 2 bedrooms with split-bedroom floor plan
- Flooring: Carpet; Tile
- Bathrooms: 2 full bathrooms; Primary bath with shower only
- Heating & cooling: Central electric heat; Central electric cooling; Smoke detector
- Interior features: Cable prewire; Dining area in living room; Screened lanai/porch
- Laundry & utility: Washer and dryer in unit; Laundry in residence
Neighborhood map
What this means for you Summary
Snapshot
- This is a 2-bed/2.0-bath condo listed at $205k.
Deal economics
- At list price, monthly cash flow is $-259 ($-3k/yr) — negative.
- To cash-flow at today's rent, offer at most $159k (22.3% below list).
- Meets the 1% rule at list price ($2k rent vs $205k).
- Recommended offer: $159k (22.3% below list) — sets the bar for cash-flow.
- Cap rate 4.8% vs local median 3.4% in Pine Ridge — top-decile yield for the area; either an underpriced asset or a hidden risk that comps aren't pricing in. Stress-test before assuming the spread holds.
Location & tenants
- Location reads 67/100 on livability (#565 in FL) — a middle-class / working-renter tenant base. Strengths: crime A+, housing A+, cost of living A-; Watch: health & safety C-, amenities F, commute F.
- Collier (suburban): math 60% / reading 56% proficiency, ranked #16 of 73 in FL (top 22%) — acceptable for families but not a draw, mixed tenant base, ~2y average lease.
- Zoned schools: Pelican Marsh Elementary School (math 87% / reading 83%, grade A+, #35 of 2,144 statewide, top 2%, 709 students, 29% FRL); Pine Ridge Middle School (math 74% / reading 70%, grade A, #52 of 571 statewide, top 10%, 832 students, 31% FRL); Barron Collier High School (math 62% / reading 68%, grade B, #76 of 667 statewide, top 11%, 1,650 students, 26% FRL) — zoned schools average 29% FRL vs 55% district-wide (26 pts lower); this property's tenant base skews higher-income than the district average.
- Zoned-school proficiency averages 74% at this address vs 58% district-wide (+16 pts) — the actual schools serving this property are materially stronger than the Collier average implies; a family-tenant draw the district grade alone would hide.
- Market conditions: Rents flat; 424 active listings in the ZIP; 40 comparable units currently listed for rent nearby; rentals at typical pace (median 23d on market — plan ~3-4 weeks tenant-placement turnaround); solid renter incomes; 3,520 units permitted in Collier County in 2024 (959 in 5+ unit buildings).
Forward outlook
- In year one you build about $2k of equity ($1k loan paydown + $605 appreciation (0.3% local appreciation)).
- Collier County population projected at +30% by 2050 — long-run rental-demand tailwind backs the buy-and-hold thesis.
Negotiation context
- It's been on market 156 days — a 12% lower offer ($180k) is reasonable based on typical stale-listing flexibility.
- 4 sale attempts since 11y ago; this cycle's ask has dropped $15k (7%) from the opening price — seller is motivated, your offer sets the floor, not the list.
- Current owner paid $58k; list at $205k implies a 253% gain — meaningful room to come down on a strong offer.
Risks & watch-outs
- Watch-outs: HOA is 32% of rent.
- Climate carrying-cost: severe wind risk, 99% chance of damaging wind over 30y; extreme-heat days projected 7→30/yr by 2055 (HVAC capex compounding) — expect insurance premiums to compound above CPI over the hold.
Questions for the listing agent
- What do current leases actually rent for vs. the listed asking? Can we see a recent rent roll and the last 12 months of T-12 income?
- It's been on market 156 days. Have you received any prior offers? Is the seller open to a 22% concession, seller financing, or rate buy-down credit?
- What does the HOA fee cover, when was the last increase, and are there any pending special assessments or reserve-fund shortfalls?
- Any open or pending special assessments — roof, HVAC, plumbing, elevator, façade? What's the per-unit balance and payoff schedule, and is the seller paying it off at close or rolling it to the buyer?
- Why hasn't it sold? Are there any deal-killer items the seller is aware of (foundation, flood, title, zoning, code violations)?
- Is there a deadline driving the sale (1031 exchange, divorce, estate, relocation)? That informs how much negotiation room exists.
- Schools are F-rated, which usually means shorter tenancies and higher turnover. Who's the typical renter profile here, and what's been the actual vacancy rate?
- The area grade is low — what's the realistic commute time and amenity access for the typical tenant pool here? Any planned neighborhood developments (good or bad) we should know about?
- What's the average days-on-market for RENTAL listings here right now (not sales)? A rising rental-DOM trend means longer vacancies and softer asking-rent achievability than the comps imply.
- What's the recent tenant-quality profile in this submarket — average credit score on applications, eviction rate, late-payment / NSF rate, and stable-employment percentage? A property-management company in the area should have these aggregated.
- How much new apartment / multifamily construction is in the pipeline within 1–3 miles? Heavy new supply (>2% of stock underway) typically softens rents 12–24 months out; light construction supports rent growth.
Investment metrics
- 1% rule
- 1.06% ✓
- Cap rate
- 4.78%
- Cash-on-cash
- -5.42%
- DSCR
- 0.76
- GRM
- 7.9
CMA / ARV
No comps found within radius.
Projected returns pro-forma
0.29% appreciation · 0.92% rent growth · sell at horizon
- IRR
- -8.8%
- Equity multiple
- 0.59×
- Total profit
- $-23,713
- Equity at exit
- $62,566
- IRR
- -4.6%
- Equity multiple
- 0.52×
- Total profit
- $-27,694
- Equity at exit
- $77,679
Cash invested: $57,400 (down + closing). Projections, not guarantees.
Landlord ↔ Tenant lean methodology
- Overall (STATE)
- 87 Strongly Landlord-Friendly
- State Florida
- 87 Strongly Landlord-Friendly · R+3
- County
- — inherits STATE
- City
- — inherits STATE
ZIP-level market 34109
- Home prices YoY
- 0.1%
- Rents YoY
- 0.9%
- Active inventory
- 424
- Price-to-rent
- 7.9×
Monthly cashflow live
- Estimated rent
- $2,164 high interval (Pro) →
- Mortgage (P&I)
- −$1,075
- Tax from tax record
- −$109 /mo · $1,311/yr
- Insurance
- −$85
- HOA
- −$699
- Vacancy / Maint / Mgmt
- −$454
- Net cashflow
- $-259
Break-even live
Sensitivity live
| Price | -10% $-143 | -5% $-201 | +0% $-259 | +5% $-317 | +10% $-375 |
|---|---|---|---|---|---|
| Rent | -10% $-430 | -5% $-345 | +0% $-259 | +5% $-174 | +10% $-88 |
| Rate | -1.0pp $-156 | -0.5pp $-207 | base $-259 | +0.5pp $-312 | +1.0pp $-366 |
UW: 25.0% down · 7.5% · 30yr · 1.5% tax · 5.0% vac · 8.0% maint · 8.0% mgmt
Financing live
Cash to close
- Down payment
- $51,250
- Closing costs
- $6,150
- Reserves months
- —
- Total cash needed
- —
Loan-product check · same deal, 3 products live
Conventional
25% down · 7.5% · 30yr
- Down + closing
- —
- Monthly P&I
- —
- Monthly cashflow
- —
- DSCR
- —
- Eligible?
- —
Personal DTI + credit; lowest rate.
DSCR
20% down · 8.5% · 30yr
- Down + closing
- —
- Monthly P&I
- —
- Monthly cashflow
- —
- DSCR
- —
- Eligible?
- —
No personal income docs; deal must DSCR.
Hard money
10% down · 12.0% · 12mo
- Down + closing
- —
- Monthly P&I
- —
- Monthly cashflow
- —
- DSCR
- —
- Eligible?
- —
Short-term bridge; refi at stabilization.
Rent comps 40 comps
| Address | Beds | Baths | Sqft | Rent | $/sqft | DOM | Units | Dist |
|---|---|---|---|---|---|---|---|---|
| 2094 Arbour Walk Cir Naples, FL | 1.0 | 1.0 | 648 | $1,588 | $2.45 | 25d | 2 | 0.03mi |
| 2118 Arbour Walk Cir Naples, FL | 1.0 | 1.0 | 750 | $1,300 | $1.73 | 25d | 1 | 0.04mi |
| 2130 Arbour Walk Cir #2724 Naples, FL | 2.0 | 2.0 | 1022 | $1,800 | $1.76 | 25d | 1 | 0.04mi |
| 2070 Arbour Walk Cir #3214 Naples, FL | 1.0 | 1.0 | 760 | $1,600 | $2.11 | 23d | 1 | 0.13mi |
| 2058 Arbour Walk Cir #3322 Naples, FL | 2.0 | 2.0 | 918 | $2,000 | $2.18 | 25d | 1 | 0.13mi |
| 2226 Arbour Walk Cir #1913 Naples, FL | 1.0 | 1.0 | 740 | $1,475 | $1.99 | 25d | 1 | 0.16mi |
| 2277 Arbour Walk Cir Naples, FL | 1.0–2.0 | 1.0–2.0 | 937 | $2,540 | $2.71 | 16d | 25 | 0.22mi |
| 2602 Fountain View Cir Naples, FL | 1.0–2.0 | 1.0–2.0 | 995 | $2,277 | $2.29 | 15d | 41 | 0.47mi |
| 7712 Jewel Ln Naples, FL | 2.0 | 2.0 | 1022 | $1,850 | $1.81 | 25d | 1 | 0.85mi |
| 7719 Jewel Ln #103 Naples, FL | 2.0 | 2.0 | 1022 | $3,800 | $3.72 | 25d | 1 | 0.87mi |
| 7800 Emerald Cir #104 Naples, FL | 2.0 | 2.0 | 1022 | $2,200 | $2.15 | 23d | 1 | 0.87mi |
| 7800 Emerald Cir Unit B104 Naples, FL | 2.0 | 2.0 | 1022 | $2,200 | $2.15 | 16d | 1 | 0.87mi |
| 7794 Emerald Cir Unit A-102 Naples, FL | 2.0 | 2.0 | 1022 | $4,000 | $3.91 | 16d | 1 | 0.90mi |
| 7754 Emerald Cir Unit T202 Naples, FL | 2.0 | 2.0 | 1022 | $3,850 | $3.77 | 16d | 1 | 0.96mi |
| 7791 Esmeralda Way #203 Naples, FL | 2.0 | 2.0 | 1022 | $1,950 | $1.91 | 16d | 1 | 0.98mi |
| 7750 Jewel Ln #103 Naples, FL | 2.0 | 2.0 | 1102 | $2,100 | $1.91 | 16d | 1 | 1.00mi |
| 7756 Jewel Ln #102 Naples, FL | 2.0 | 2.0 | 1022 | $3,700 | $3.62 | 25d | 1 | 1.03mi |
| 501 Forest Lakes Blvd #111 Naples, FL | 2.0 | 2.0 | 919 | $2,300 | $2.50 | 16d | 1 | 1.13mi |
| 499 Forest Lakes Blvd #105 Naples, FL | 2.0 | 2.0 | 919 | $1,950 | $2.12 | 16d | 1 | 1.14mi |
| 301 Ridge Dr Naples, FL | 2.0 | 2.0 | 900 | $6,000 | $6.67 | 25d | 1 | 1.15mi |
| 300 Forest Lakes Blvd Naples, FL | 2.0 | 2.0 | 842 | $2,700 | $3.21 | 25d | 2 | 1.18mi |
| 400 Forest Lakes Blvd Naples, FL | 2.0 | 2.0 | 842 | $2,350 | $2.79 | 23d | 4 | 1.19mi |
| 200 Forest Lakes Blvd #111 Naples, FL | 2.0 | 2.0 | 842 | $3,100 | $3.68 | 16d | 1 | 1.21mi |
| 100 Forest Lakes Blvd Naples, FL | 1.0–2.0 | 2.0 | 842 | $3,500 | $4.16 | 16d | 3 | 1.23mi |
| 175 Turtle Lake Ct Naples, FL | 1.0–2.0 | 1.0–2.0 | 740 | $1,650 | $2.23 | 16d | 2 | 1.24mi |
| 5301 Summerwind Dr Naples, FL | 1.0–2.0 | 1.0–2.0 | 836 | $1,864 | $2.23 | 16d | 12 | 1.24mi |
| 150 Turtle Lake Ct #307 Naples, FL | 1.0 | 1.0 | 638 | $1,500 | $2.35 | 25d | 1 | 1.26mi |
| 516 Gordonia Rd Naples, FL | 2.0 | 1.0 | 1100 | $3,200 | $2.91 | 25d | 1 | 1.29mi |
| 225 Turtle Lake Ct Naples, FL | 1.0–2.0 | 1.0–2.0 | 740 | $1,900 | $2.57 | 25d | 2 | 1.30mi |
| 1554 Oyster Catcher Pt Unit C Naples, FL | 2.0 | 2.0 | 1124 | $2,900 | $2.58 | 25d | 1 | 1.35mi |
| 5934 Premier Way Naples, FL | 1.0–3.0 | 1.0–3.0 | 1350 | $3,618 | $2.68 | 16d | 29 | 1.36mi |
| 200 Turtle Lake Ct #109 Naples, FL | 2.0 | 2.0 | 842 | $1,295 | $1.54 | 25d | 1 | 1.37mi |
| 170 Turtle Lake Ct Naples, FL | 2.0 | 2.0 | 842 | $2,975 | $3.53 | 16d | 1 | 1.39mi |
| 1545 Oyster Catcher Pt Unit A Naples, FL | 2.0 | 2.0 | 1124 | $2,200 | $1.96 | 16d | 1 | 1.39mi |
| 260 Quail Forest Blvd Naples, FL | 1.0–2.0 | 1.0–2.0 | 875 | $2,533 | $2.89 | 16d | 22 | 1.40mi |
| 1086 Forest Lakes Dr Unit 9303 Naples, FL | 2.0 | 2.0 | 1000 | $2,395 | $2.40 | 16d | 1 | 1.42mi |
| 190 Turtle Lake Ct Unit 6 Naples, FL | 2.0 | 2.0 | 842 | $2,100 | $2.49 | 16d | 1 | 1.43mi |
| 180 Turtle Lake Ct #102 Naples, FL | 2.0 | 2.0 | 842 | $1,850 | $2.20 | 23d | 1 | 1.43mi |
| 200 Cajeput Dr Naples, FL | 1.0 | 1.0 | 750 | $2,500 | $3.33 | 25d | 1 | 1.45mi |
| 287 Quail Forest Blvd #117 Naples, FL | 2.0 | 2.0 | 993 | $1,695 | $1.71 | 16d | 1 | 1.48mi |
HOA detail condo
- Monthly dues
- $699 · $8,388/yr
- Likely covers
- pool
- Assessments
- None detected in remarks — confirm with the listing agent.
Listing history 26 events
-
2026-06-21days on market $205,000 Active 156 DOM
-
2026-06-18days on market $205,000 Active 153 DOM
-
2026-06-17days on market $205,000 Active 152 DOM
-
2026-06-16days on market $205,000 Active 151 DOM
-
2026-06-15days on market $205,000 Active 150 DOM
-
2026-06-14days on market $205,000 Active 148 DOM
-
2026-06-10days on market $205,000 Active 145 DOM
-
2026-06-09days on market $205,000 Active 144 DOM
-
2026-06-08days on market $205,000 Active 143 DOM
-
2026-06-07days on market $205,000 Active 142 DOM
-
2026-06-03days on market $205,000 Active 138 DOM
-
2026-06-02days on market $205,000 Active 137 DOM
-
2026-06-01days on market $205,000 Active 136 DOM
-
2026-05-31days on market $205,000 Active 135 DOM
-
2026-05-30days on market $205,000 Active 134 DOM
-
2026-04-20price $205,000
-
2026-01-16$220,000 Active
-
2026-01-15historical
-
2025-06-19price $242,000
-
2025-02-18$255,000 Active
-
2024-05-13historical
-
2024-03-11price $275,000
-
2024-01-05$279,900 Active
-
2015-05-15$58,000
-
2010-10-05soldstatus $58,000
-
2010-08-10historical
ⓘ Source: listings_history table (triggers on properties + properties_extension) + one-shot
backfill from property_details.listing_events for pre-trigger history.
Tax reassessment forecast FL · Resets to sale price
- Current annual tax
- $1,311 · $109/mo
- Projected year-2 tax
- $1,702 · $142/mo
- Expected delta
- +$391/yr (+$33/mo · 29.8%)
ⓘ Screening estimate from a state-policy table — verify with the county assessor before closing.
Climate risk First Street
- Flood 4/10 Moderate FEMA zone X (shaded) · 18% chance over 30 yrs
- Wildfire 1/10 Low
- Heat 10/10 Extreme 7 d/yr ≥107°F today · 30 d/yr by 30 yrs out
- Wind 10/10 Extreme 99% chance of damaging wind over 30 yrs
- Air quality 2/10 Low 2 unhealthy d/yr today · 2 by 30 yrs out
Nearby sold comps map
Loading sold comps map…
Walkable amenities ~0.75 mi
Loading nearby amenities…
Taxation est. · year 1
- Rental income
- $25,967
- − Mortgage interest
- −$11,483
- − Property taxes
- −$1,311
- − Insurance
- −$1,025
- − Repairs & maintenance
- −$2,077
- − Management
- −$2,077
- − HOA
- −$8,388
- − Depreciation
- −$5,964
- Taxable loss
- −$6,359
- Est. tax savings @ 24.0%
- +$1,526
- After-tax cash flow
- $-1,585/yr
For passive investors: Depreciation is non-cash, so a rental often shows a tax loss while cash-flowing — sheltering income. Rental losses are passive: they offset passive income freely, and up to $25,000/yr can offset ordinary (W-2) income if you actively participate and your MAGI is under $100k (phasing out to $0 by $150k); unused losses carry forward. On sale, claimed depreciation is recaptured at up to 25%, and gains may owe capital-gains tax (a 1031 exchange can defer both). Figures are a year-1 estimate at your 24.0% rate — not tax advice; consult a CPA.
Schools (NCES district)
- District
- Collier
- NCES district ID
- 1200330
- Math proficiency
- 60% ▼ -4.00%
- Reading proficiency
- 56% ▼ -2.00%
- Median HH income
- $58,275
- Composite
- 50.23/100
- National rank
- #1892
- State rank
- #16 of 73 in FL
Livability — Pine Ridge
- Score
- 67/100
- State rank
- #565
- US rank
- #10798
Category grades
Schools grade is shown separately in the Schools card above.
Census & demographics
- County
- Collier County · 396,295 people
- City population
- 18,514
- Metro
- Naples-Marco Island, FL
- Population (ZIP)
- 27,273
- Household income
- $92,259
- Rent vs Own
- Severe rent burden
- 1712.0
Population outlook (Collier County) Hauer SSP2
- Today (2025)
- 420,858 people
- By 2030
- 450,054 · +6.9%
- By 2040
- 502,232 · +19.3%
- By 2050
- 544,932 · +29.5%
- By 2075
- 627,203 · +49.0%
- By 2100
- 659,015 · +56.6%
Race, ethnicity, and origin ACS 2023
- Neighborhood character
- Predominantly White (78%)
- Race & ethnicity
- White 78% Hispanic / Latino 11% Two or more races 9% Black 4% Asian 4%
- Hispanic origin (detail)
- Mexican 1% Puerto Rican 1% Cuban 3%
- Common ancestry
- Romanian 5% Scotch-Irish 3% Lithuanian 2%
- Foreign-born
- 20% · Canada, Jamaica, Vietnam
- Languages at home
- 77% English-only · Spanish 10% Other Indo-European 5% Russian/Polish/Slavic 3%
Political lean MEDSL · Collier
- 2024 margin
- Solid R (+33.1) · D 33.1% · R 66.2%
- 2008→2024 swing
- -10.6pp toward R · 2008: -22.5pp · 2024: -33.1pp
- All cycles
- 2024: R+33.1 2020: R+24.7 2016: R+26.0 2012: R+30.1 2008: R+22.5
Not yet ingested
- Civics
- —
Market trends
- HPI YoY
- ▲ 0.29%
- Current HPI
- 279.357
- Rent YoY
- ▲ 0.92%
- Metro
- Naples-Marco Island, FL
- State GDP YoY
- ▲ 3.28%
- F500 in state
- 36
Industry mix (Fortune 500 HQ in FL)
| Industry | F500 HQs | Revenue |
|---|---|---|
| Industrial Technology | 2 | $29B |
|
||
| Insurance | 2 | $17B |
|
||
| Retail | 1 | $60B |
|
||
| Technology Distribution | 1 | $58B |
|
||
| Homebuilding | 1 | $35B |
|
||
| Technology Manufacturing | 1 | $35B |
|
||
Price history
+253.4% since first listed11 events — show timeline
- 2026-04-20 Price Changed $205,000 NAPLESMLS
- 2026-01-16 Listed $220,000 NAPLESMLS
- 2026-01-15 Listing Removed — NAPLESMLS
- 2025-06-19 Price Changed $242,000 NAPLESMLS
- 2025-02-18 Listed $255,000 NAPLESMLS
- 2024-05-13 Listing Removed — FORTMLS
- 2024-03-11 Price Changed $275,000 FORTMLS
- 2024-01-05 Listed $279,900 FORTMLS
- 2015-05-15 Listed $58,000 FORTMLS
- 2010-10-05 Sold (MLS) $58,000 FORTMLS
- 2010-08-10 Listing Removed — FORTMLS
Property tax history
+6.0%/yrLatest (2025): $1,311 · +2.7% YoY. Source: county tax records.
Cash-flow waterfall
monthlySold comps — $/sqft
last 12 mo · ≤1 miLoading sold comps…