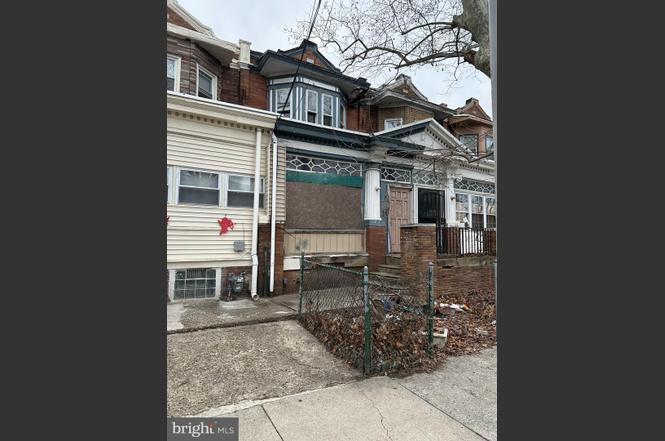
1510 Wildwood Ave · Camden, NJ
Flood risk 1/10 · Minimal
- FEMA flood zone
- X (unshaded)
- Chance of flooding over 30 yrs
- 0.0%
- Est. flood insurance / yr
- $507 – $1,088
Fire risk 1/10 · Minimal
- Est. fire insurance / yr
- $526 – $976
Heat risk 7/10 · Major
- Hot days now (above 103°F)
- 7 days/yr
- Hot days in 30 yrs
- 15 days/yr
Wind risk 6/10 · Moderate
- Chance of severe wind over 30 yrs
- 27.0%
Air-quality risk 4/10 · Minor
- Unhealthy air days now
- 5 days/yr
- Unhealthy air days in 30 yrs
- 6 days/yr
Risk factors via First Street. Map © Google.
Why this score? — see what drove the B+ grade
The composite is a weighted blend of 9 inputs, each scored 0–100. Each bar is that input's sub-score; the figure is the points it added to the 100-point composite (weight × sub-score).
- Cash flow +30.0/30.0
- ARV discount +15.0/15.0
- 1% rule +10.0/10.0
- DSCR +10.0/10.0
- Appreciation +3.8/10.0
- Livability +3.5/5.0
- Rent growth +2.5/5.0
- Condition / age +2.5/5.0
- Schools +0.7/10.0
$99,000
🖨 Deal sheet (PDF) 📄 Offer letter ✓ Due diligence
Key facts
- Built 1920
- Listed 390 days
Property features AI
Finance
- Financial info: Assessor indicates 1,388 finished above-grade square feet; Year built and square-foot sources listed as Assessor; Assessed improvement value $51,400 and land value $11,400
Exterior
- Home design: Interior townhouse/rowhouse; Fee simple ownership
- Construction: Concrete perimeter foundation; Above-grade and below-grade structures
- Exterior features: Townhouse/rowhouse setting; Lot dimensions approximately 15.00 x 0.00
Interior
- Bedrooms: Three bedrooms on the upper level
- Bathrooms: One full bathroom (upper level)
- Interior features: Unfinished basement
Neighborhood map
What this means for you Summary
Snapshot
- This is a 3-bed/1.0-bath single-family listed at $99k.
Deal economics
- At list price, monthly cash flow is $704 ($8k/yr) — positive.
- The deal already cash-flows at list — no discount required.
- Meets the 1% rule at list price ($2k rent vs $99k).
- Recommended offer: $87k (12.0% below list) — sets the bar for market timing.
- Cap rate 14.8% vs local median 7.1% in Camden — top-decile yield for the area; either an underpriced asset or a hidden risk that comps aren't pricing in. Stress-test before assuming the spread holds.
Location & tenants
- Location reads 70/100 on livability (#262 in NJ) — a middle-class / working-renter tenant base. Strengths: amenities A+, commute A+, cost of living A; Watch: schools F, crime F, employment F.
- Camden City School District (urban): math 3% / reading 16% proficiency, ranked #472 of 472 in NJ (top 100%) — low school quality limits family demand, transient renter base, plan for 1-2y turnover; 86% free/reduced lunch — lower-income household profile, screen leases tightly.
- Market conditions: 64 active listings in the ZIP; 22 comparable units currently listed for rent nearby; rentals at typical pace (median 21d on market — plan ~3-4 weeks tenant-placement turnaround); lower-income renter base — watch delinquency; 1,018 units permitted in Camden County in 2024 (509 in 5+ unit buildings).
- At $1,845/mo this rent would consume 60% of the median local household income ($37k/yr) (locally 1141% of renters already pay >50% of income on rent) — very limited rent-growth headroom before tenants either downsize or default.
Forward outlook
- Local home prices are declining (-2.4%/yr); year-one equity from $684 of loan paydown is wiped out by about $2k of value loss. Plan a longer hold.
- Camden County population projected to shrink 8% by 2050 — rents likely to lag national; underwrite the cash flow, not the appreciation.
- At projected returns (-2.4% appreciation + 3.0% rent growth), your $28k cash investment doubles in ~4 years — after that, you're playing with house money.
Negotiation context
- It's been on market 391 days — a 12% lower offer ($87k) is reasonable based on typical stale-listing flexibility.
Risks & watch-outs
- Watch-outs: built in 1920 — expect roof / HVAC / electrical / plumbing capex.
- Climate carrying-cost: major wind risk, 27% chance of damaging wind over 30y; extreme-heat days projected 7→15/yr by 2055 (HVAC capex compounding) — expect insurance premiums to compound above CPI over the hold.
Questions for the listing agent
- It's been on market 391 days. Have you received any prior offers? Is the seller open to a 12% concession, seller financing, or rate buy-down credit?
- Built in 1920 — when were the roof, HVAC, electrical panel, plumbing, and water heater last replaced?
- Why hasn't it sold? Are there any deal-killer items the seller is aware of (foundation, flood, title, zoning, code violations)?
- Is there a deadline driving the sale (1031 exchange, divorce, estate, relocation)? That informs how much negotiation room exists.
- Schools are F-rated, which usually means shorter tenancies and higher turnover. Who's the typical renter profile here, and what's been the actual vacancy rate?
- Crime grade is F in this area — have there been break-ins, vandalism, or insurance claims at this property in the last 3 years? What carrier currently insures it and at what premium?
- What's the average days-on-market for RENTAL listings here right now (not sales)? A rising rental-DOM trend means longer vacancies and softer asking-rent achievability than the comps imply.
- What's the recent tenant-quality profile in this submarket — average credit score on applications, eviction rate, late-payment / NSF rate, and stable-employment percentage? A property-management company in the area should have these aggregated.
- How much new for-sale + rental construction is in the pipeline within 1–3 miles? Heavy new supply typically softens prices + rents 12–24 months out; constrained supply supports both.
Investment metrics
- 1% rule
- 1.86% ✓
- Cap rate
- 14.83%
- Cash-on-cash
- 30.48%
- DSCR
- 2.36
- GRM
- 4.5
CMA / ARV
- ARV (on-the-fly)
- $154,068
- Comps found
- 9
Show comp detail 9 sales within ~0.75 mi
| Address | Dist | Beds/Ba | Sqft | Sold | Price | $/sf | Match |
|---|---|---|---|---|---|---|---|
| 1243 Magnolia Ave | 0.05mi | 3/1.0 | 1,460 (+5%) | 6mo | $115,000 | $79 | 84 |
| 1314 Atlantic Ave | 0.35mi | 3/1.5 | 1,380 (-1%) | 2mo | $245,000 | $178 | 79 |
| 1553 Wildwood Ave | 0.09mi | 3/2.0 | 1,440 (+4%) | 10mo | $128,000 | $89 | 77 |
| 1306 Thurman St | 0.54mi | 3/1.0 | 1,398 (+1%) | 4mo | $140,000 | $100 | 70 |
| 1460 Belleview Ave | 0.21mi | 3/1.0 | 1,483 (+7%) | 13mo | $194,000 | $131 | 68 |
| 1340 Atlantic Ave | 0.34mi | 3/1.0 | 1,472 (+6%) | 24mo | $165,000 | $112 | 54 |
| 1551 Norris St | 0.59mi | 3/1.5 | 1,352 (-3%) | 18mo | $225,000 | $166 | 52 |
| 1240 Chase Street St S | 0.65mi | 4/1.5 (+1) | 1,500 (+8%) | 2mo | $143,000 | $95 | 47 |
| 1128 Everett St | 0.59mi | 3/1.5 | 1,575 (+14%) | 12mo | $175,000 | $111 | 38 |
Match score weights: distance 35% · size 25% · config 20% · recency 20%. Top-matched comps best support the ARV.
Projected returns pro-forma
-2.36% appreciation · 3.0% rent growth · sell at horizon
- IRR
- 26.5%
- Equity multiple
- 2.14×
- Total profit
- $31,551
- Equity at exit
- $17,617
- IRR
- 33.3%
- Equity multiple
- 4.17×
- Total profit
- $87,847
- Equity at exit
- $13,548
Cash invested: $27,720 (down + closing). Projections, not guarantees.
Landlord ↔ Tenant lean methodology
- Overall (STATE)
- 21 Tenant-Leaning
- State New Jersey
- 21 Tenant-Leaning · D+6
- County
- — inherits STATE
- City
- — inherits STATE
ZIP-level market 08103
- Home prices YoY
- -1.4%
- Active inventory
- 64
- Price-to-rent
- 4.5×
Monthly cashflow live
- Estimated rent
- $1,845 high interval (Pro) →
- Mortgage (P&I)
- −$519
- Tax from tax record
- −$193 /mo · $2,315/yr
- Insurance
- −$41
- HOA
- −$0
- Vacancy / Maint / Mgmt
- −$387
- Net cashflow
- $704
Break-even live
Sensitivity live
| Price | -10% $760 | -5% $732 | +0% $704 | +5% $676 | +10% $648 |
|---|---|---|---|---|---|
| Rent | -10% $558 | -5% $631 | +0% $704 | +5% $777 | +10% $850 |
| Rate | -1.0pp $754 | -0.5pp $729 | base $704 | +0.5pp $678 | +1.0pp $652 |
UW: 25.0% down · 7.5% · 30yr · 1.5% tax · 5.0% vac · 8.0% maint · 8.0% mgmt
Financing live
Cash to close
- Down payment
- $24,750
- Closing costs
- $2,970
- Reserves months
- —
- Total cash needed
- —
Loan-product check · same deal, 3 products live
Conventional
25% down · 7.5% · 30yr
- Down + closing
- —
- Monthly P&I
- —
- Monthly cashflow
- —
- DSCR
- —
- Eligible?
- —
Personal DTI + credit; lowest rate.
DSCR
20% down · 8.5% · 30yr
- Down + closing
- —
- Monthly P&I
- —
- Monthly cashflow
- —
- DSCR
- —
- Eligible?
- —
No personal income docs; deal must DSCR.
Hard money
10% down · 12.0% · 12mo
- Down + closing
- —
- Monthly P&I
- —
- Monthly cashflow
- —
- DSCR
- —
- Eligible?
- —
Short-term bridge; refi at stabilization.
Rent comps 22 comps
| Address | Beds | Baths | Sqft | Rent | $/sqft | DOM | Units | Dist |
|---|---|---|---|---|---|---|---|---|
| 1455 Wildwood Ave Camden, NJ | 3.0 | 1.5 | 1353 | $1,900 | $1.40 | 11d | 1 | 0.06mi |
| 1509 Park Blvd Camden, NJ | 1.0–2.0 | 1.0 | 1075 | $1,650 | $1.53 | 25d | 1 | 0.13mi |
| 1364 Kaighn Ave Camden, NJ | 2.0 | 1.0 | 912 | $1,485 | $1.63 | 3d | 1 | 0.20mi |
| 1055 Kenwood Ave Camden, NJ | 4.0 | 1.0 | 1088 | $1,875 | $1.72 | 25d | 1 | 0.22mi |
| 1502 S 9th St Camden, NJ | 2.0 | 1.0 | 1050 | $1,475 | $1.40 | 20d | 1 | 0.76mi |
| 537 Newton Ave Camden, NJ | 2.0 | 1.0 | 1092 | $1,500 | $1.37 | 19d | 1 | 0.77mi |
| 537 Newton Ave Camden, NJ | 2.0 | 1.0 | 1092 | $1,500 | $1.37 | 13d | 1 | 0.77mi |
| 264 Boyd St Unit B Camden, NJ | 2.0 | 1.0 | 1616 | $1,700 | $1.05 | 25d | 1 | 0.78mi |
| 727 Berkley St Camden, NJ | 2.0 | 1.5 | 1008 | $1,660 | $1.65 | 25d | 1 | 0.79mi |
| 708 Royden St Camden, NJ | 3.0 | 1.0 | 1113 | $1,595 | $1.43 | 18d | 1 | 0.79mi |
| 324 S 27th St Camden, NJ | 3.0 | 1.0 | 1152 | $1,900 | $1.65 | 25d | 1 | 1.07mi |
| 457 Mechanic St Camden, NJ | 3.0 | 2.0 | 1200 | $1,950 | $1.62 | 19d | 1 | 1.09mi |
| 2752 Mickle St Camden, NJ | 3.0 | 1.0 | 1450 | $1,850 | $1.28 | 17d | 1 | 1.10mi |
| 609 Henry St Camden, NJ | 3.0 | 1.0 | 1290 | $1,600 | $1.24 | 25d | 1 | 1.12mi |
| 440 Henry St Camden, NJ | 3.0 | 1.5 | 1224 | $2,200 | $1.80 | 25d | 1 | 1.13mi |
| 209 Cedar Ave Oaklyn, NJ | 2.0 | 1.0 | 1400 | $1,800 | $1.29 | 6d | 1 | 1.24mi |
| 209 Cedar Ave Oaklyn, NJ | 2.0 | 1.0 | 1400 | $1,500 | $1.07 | 17d | 1 | 1.24mi |
| 380 Garden Ave Camden, NJ | 2.0 | 2.0 | 1184 | $2,100 | $1.77 | 25d | 1 | 1.29mi |
| 221 Haddon Ave Collingswood, NJ | 4.0 | 2.0 | 1744 | $3,100 | $1.78 | 4d | 1 | 1.34mi |
| 225 Haddon Ave Collingswood, NJ | 2.0 | 2.0 | 1211 | $3,372 | $2.78 | 2d | 6 | 1.36mi |
| 132 E Franklin Ave Unit A Collingswood, NJ | 2.0 | 1.0 | 1000 | $2,400 | $2.40 | 25d | 1 | 1.36mi |
| 4137 Marlton Pike Pennsauken Township, NJ | 2.0 | 1.0 | 900 | $1,800 | $2.00 | 25d | 1 | 1.45mi |
Listing history 19 events
-
2026-06-21days on market $99,000 Active 391 DOM
-
2026-06-18days on market $99,000 Active 388 DOM
-
2026-06-17days on market $99,000 Active 387 DOM
-
2026-06-16days on market $99,000 Active 386 DOM
-
2026-06-15days on market $99,000 Active 385 DOM
-
2026-06-13days on market $99,000 Active 383 DOM
-
2026-06-13days on market $99,000 Active 382 DOM
-
2026-06-09days on market $99,000 Active 379 DOM
-
2026-06-08days on market $99,000 Active 378 DOM
-
2026-06-07days on market $99,000 Active 377 DOM
-
2026-06-04days on market $99,000 Active 374 DOM
-
2026-06-03days on market $99,000 Active 373 DOM
-
2026-06-02days on market $99,000 Active 372 DOM
-
2026-06-02pricestatus $99,000 Active 371 DOM
-
2026-05-18historical Active Under Contract
-
2025-09-29price $115,888
-
2025-05-13price $128,888
-
2025-05-12$125,888 Active
-
2025-04-17soldstatus $567,823
ⓘ Source: listings_history table (triggers on properties + properties_extension) + one-shot
backfill from property_details.listing_events for pre-trigger history.
Tax reassessment forecast NJ · Partial reset (capped growth)
- Current annual tax
- $2,315 · $193/mo
- Projected year-2 tax
- $2,390 · $199/mo
- Expected delta
- +$75/yr (+$6/mo · 3.2%)
ⓘ Screening estimate from a state-policy table — verify with the county assessor before closing.
Climate risk First Street
- Flood 1/10 Low FEMA zone X (unshaded) · 0% chance over 30 yrs
- Wildfire 1/10 Low
- Heat 7/10 Severe 7 d/yr ≥103°F today · 15 d/yr by 30 yrs out
- Wind 6/10 Major 27% chance of damaging wind over 30 yrs
- Air quality 4/10 Moderate 5 unhealthy d/yr today · 6 by 30 yrs out
Nearby sold comps map
Loading sold comps map…
Walkable amenities ~0.75 mi
Loading nearby amenities…
Taxation est. · year 1
- Rental income
- $22,137
- − Mortgage interest
- −$5,546
- − Property taxes
- −$2,315
- − Insurance
- −$495
- − Repairs & maintenance
- −$1,771
- − Management
- −$1,771
- − Depreciation
- −$2,880
- Taxable income
- $7,359
- Est. tax owed @ 24.0%
- −$1,766
- After-tax cash flow
- $6,682/yr
For passive investors: Depreciation is non-cash, so a rental often shows a tax loss while cash-flowing — sheltering income. Rental losses are passive: they offset passive income freely, and up to $25,000/yr can offset ordinary (W-2) income if you actively participate and your MAGI is under $100k (phasing out to $0 by $150k); unused losses carry forward. On sale, claimed depreciation is recaptured at up to 25%, and gains may owe capital-gains tax (a 1031 exchange can defer both). Figures are a year-1 estimate at your 24.0% rate — not tax advice; consult a CPA.
Schools (NCES district)
- District
- Camden City School District
- NCES district ID
- 3402640
- Math proficiency
- 3% ▼ -6.00%
- Reading proficiency
- 16% ▬ 0.00%
- Median HH income
- $25,845
- Composite
- 6.85/100
- National rank
- #9981
- State rank
- #472 of 472 in NJ
Livability — Camden
- Score
- 70/100
- State rank
- #262
- US rank
- #7721
Category grades
Schools grade is shown separately in the Schools card above.
Census & demographics
- Census place
- Camden, NJ
- County
- Camden County · 407,624 people
- City population
- 20,865
- Metro
- Philadelphia-Camden-Wilmington, PA-NJ-DE-MD
- Population (ZIP)
- 12,573
- Household income
- $36,793
- Rent vs Own
- Severe rent burden
- 1141.0
Population outlook (Camden County) Hauer SSP2
- Today (2025)
- 507,964 people
- By 2030
- 502,182 · -1.1%
- By 2040
- 485,602 · -4.4%
- By 2050
- 465,630 · -8.3%
- By 2075
- 419,986 · -17.3%
- By 2100
- 369,492 · -27.3%
Race, ethnicity, and origin ACS 2023
- Neighborhood character
- Diverse neighborhood (Simpson 0.57)
- Race & ethnicity
- Black 54% Hispanic / Latino 36% Two or more races 9% White 5% Asian 1%
- Hispanic origin (detail)
- Mexican 4% Puerto Rican 19% Dominican 4%
- Common ancestry
- Hispanic 1%
- Foreign-born
- 12% · Canada, Jamaica
- Languages at home
- 75% English-only · Spanish 22% Tagalog/Filipino 2%
Political lean MEDSL · Camden
- 2024 margin
- Strong D (+27.4) · D 63.0% · R 35.5% · Other 1.5%
- 2008→2024 swing
- -8.8pp toward R · 2008: 36.2pp · 2024: 27.4pp
- All cycles
- 2024: D+27.4 2020: D+33.5 2016: D+32.4 2012: D+36.6 2008: D+36.2
Not yet ingested
- Civics
- —
Market trends
- HPI YoY
- ▼ -2.36%
- Current HPI
- 162.557
- Rent YoY
- —
- Metro
- Philadelphia-Camden-Wilmington, PA-NJ-DE-MD
- State GDP YoY
- ▲ 2.05%
- F500 in state
- 34
Industry mix (Fortune 500 HQ in NJ)
| Industry | F500 HQs | Revenue |
|---|---|---|
| Consumer Goods | 3 | $31B |
|
||
| Pharmaceuticals | 2 | $153B |
|
||
| Technology | 2 | $21B |
|
||
| Insurance | 2 | $20B |
|
||
| Healthcare | 2 | $19B |
|
||
| Financial Services | 1 | $70B |
|
||
Price history
-79.6% since first listed5 events — show timeline
- 2026-05-18 Contingent — BRIGHT MLS
- 2025-09-29 Price Changed $115,888 BRIGHT MLS
- 2025-05-13 Price Changed $128,888 BRIGHT MLS
- 2025-05-12 Listed $125,888 BRIGHT MLS
- 2025-04-17 Sold (Public Records) $567,823 Public Records
Property tax history
+2.3%/yrLatest (2025): $2,315 · +4.1% YoY. Source: county tax records.
Cash-flow waterfall
monthlySold comps — $/sqft
last 12 mo · ≤1 miLoading sold comps…