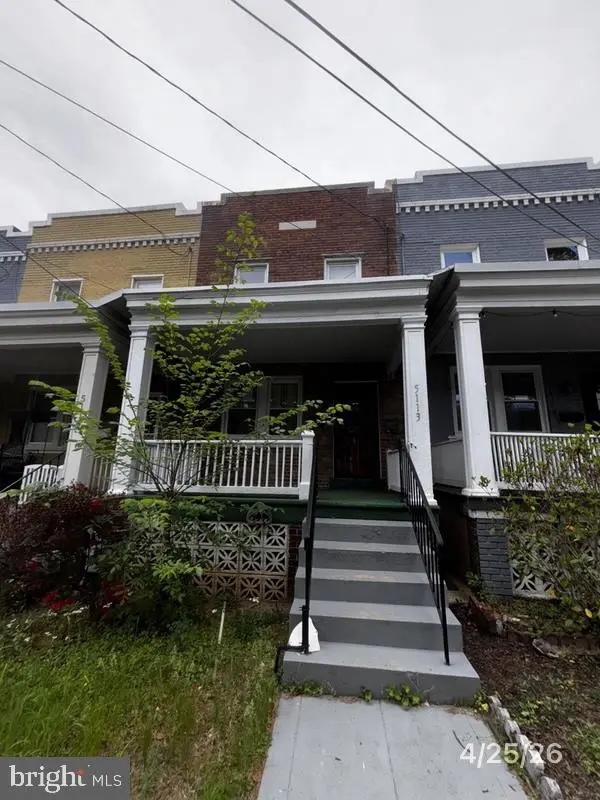
5113 8th St NW · Washington, DC
Flood risk 8/10 · Major
- FEMA flood zone
- X (unshaded)
- Chance of flooding over 30 yrs
- 0.78%
- Est. flood insurance / yr
- $473 – $860
Fire risk 1/10 · Minimal
- Est. fire insurance / yr
- $631 – $1,173
Heat risk 7/10 · Major
- Hot days now (above 104°F)
- 7 days/yr
- Hot days in 30 yrs
- 15 days/yr
Wind risk 4/10 · Minor
- Chance of severe wind over 30 yrs
- 16.0%
Air-quality risk 4/10 · Minor
- Unhealthy air days now
- 5 days/yr
- Unhealthy air days in 30 yrs
- 6 days/yr
Risk factors via First Street. Map © Google.
Why this score? — see what drove the C+ grade
The composite is a weighted blend of 9 inputs, each scored 0–100. Each bar is that input's sub-score; the figure is the points it added to the 100-point composite (weight × sub-score).
- Cash flow +20.6/30.0
- ARV discount +15.0/15.0
- DSCR +6.6/10.0
- 1% rule +5.6/10.0
- Livability +3.7/5.0
- Schools +3.6/10.0
- Rent growth +2.9/5.0
- Condition / age +2.5/5.0
- Appreciation +0.0/10.0
$299,000
🖨 Deal sheet (PDF) 📄 Offer letter ✓ Due diligence
Listing remarks
Multiple offers received. Please submit your highest and best offer as soon as possible. INVESTOR SPECIAL!! Welcome to 5113 8th St NW, Washington, DC 20011 — a townhouse located in the heart of Washington, DC. Attention homebuyers and investors! This property offers a rare opportunity to transform a solid structure into your ideal home or next investment. Full of potential, this diamond in the rough is perfect for those ready to add value with some TLC. Located in the vibrant Petworth/Brightwood area, this spacious 3-bedroom, 1-bath townhouse presents an excellent opportunity for investors or buyers looking to customize and renovate. The neighborhood is known for its energy, growing a
Key facts
- Energy
- Solid structure
- Nearby cafes
Tags
Property features AI
Finance
- Other: Above-grade finished area per assessor: 1,056; Below-grade unfinished area per assessor: 416; Total below-grade area: 416; Year built source: Assessor
- Financial info: Ownership is fee simple
Exterior
- Parking: On-street parking
- Utilities: Public water; Public sewer
- Home design: Interior townhouse/rowhouse; Brick front
- Construction: Block foundation; Major rehab needed
- Exterior features: No tidal water
Interior
- Bedrooms: Three bedrooms on the first upper level
- Bathrooms: One full bathroom (all upper levels)
- Interior features: Basement with interior access; Living area source: Assessor
Neighborhood map
What this means for you Summary
Snapshot
- This is a 3-bed/1.0-bath townhouse listed at $299k.
Deal economics
- At list price, monthly cash flow is $345 ($4k/yr) — positive.
- The deal already cash-flows at list — no discount required.
- Meets the 1% rule at list price ($3k rent vs $299k).
- Recommended offer: $290k (3.0% below list) — sets the bar for market timing.
- Cap rate 7.9% vs local median 2.5% in Washington — top-decile yield for the area; either an underpriced asset or a hidden risk that comps aren't pricing in. Stress-test before assuming the spread holds.
Location & tenants
- Location reads 73/100 on livability (#1 in DC) — a middle-class / working-renter tenant base. Strengths: amenities A+, commute A+, employment A+; Watch: crime F, cost of living F.
- District Of Columbia Public Schools (urban): math 33% / reading 40% proficiency, ranked #8 of 32 in DC (top 25%) — families likely to look elsewhere, expect single-tenant / working-renter base with shorter leases; 65% free/reduced lunch — lower-income household profile, screen leases tightly.
- Market conditions: Rents rising (+1.4%/yr); 370 active listings in the ZIP; 40 comparable units currently listed for rent nearby; rentals at typical pace (median 26d on market — plan ~3-4 weeks tenant-placement turnaround); high-income renter base; 1,737 units permitted in District of Columbia in 2024 (1,506 in 5+ unit buildings).
- This rent runs 34% of the median local income ($110k/yr) — at the standard rent-burdened threshold; future hikes will face affordability resistance.
Forward outlook
- Local home prices are declining (-3.0%/yr); year-one equity from $2k of loan paydown is wiped out by about $9k of value loss. Plan a longer hold.
- District of Columbia County population projected at +50% by 2050 — long-run rental-demand tailwind backs the buy-and-hold thesis.
Negotiation context
- It's been on market 50 days — a 3% lower offer ($290k) is reasonable based on typical stale-listing flexibility.
- 3 sale attempts since 2y ago with the ask held roughly flat each time — persistent listings suggest the price (not the market) is what's stuck; bring a comps-based counter.
Risks & watch-outs
- Watch-outs: flood insurance adds $56/mo; built in 1926 — expect roof / HVAC / electrical / plumbing capex.
- Climate carrying-cost: severe flood risk; extreme-heat days projected 7→15/yr by 2055 (HVAC capex compounding) — expect insurance premiums to compound above CPI over the hold.
Questions for the listing agent
- It's been on market 50 days. Have you received any prior offers? Is the seller open to a 3% concession, seller financing, or rate buy-down credit?
- Built in 1926 — when were the roof, HVAC, electrical panel, plumbing, and water heater last replaced?
- What's the actual annual flood-insurance premium (NFIP or private), and is the property in a SFHA with mandatory coverage?
- Is there a deadline driving the sale (1031 exchange, divorce, estate, relocation)? That informs how much negotiation room exists.
- Crime grade is F in this area — have there been break-ins, vandalism, or insurance claims at this property in the last 3 years? What carrier currently insures it and at what premium?
- What's the average days-on-market for RENTAL listings here right now (not sales)? A rising rental-DOM trend means longer vacancies and softer asking-rent achievability than the comps imply.
- What's the recent tenant-quality profile in this submarket — average credit score on applications, eviction rate, late-payment / NSF rate, and stable-employment percentage? A property-management company in the area should have these aggregated.
- How much new for-sale + rental construction is in the pipeline within 1–3 miles? Heavy new supply typically softens prices + rents 12–24 months out; constrained supply supports both.
Investment metrics
- 1% rule
- 1.06% ✓
- Cap rate
- 7.90%
- Cash-on-cash
- 5.74%
- DSCR
- 1.26
- GRM
- 7.9
CMA / ARV
- ARV (on-the-fly)
- $446,688
- Comps found
- 12
Show comp detail 12 sales within ~0.75 mi
| Address | Dist | Beds/Ba | Sqft | Sold | Price | $/sf | Match |
|---|---|---|---|---|---|---|---|
| 4924 7th St NW | 0.14mi | 3/2.0 | 1,044 (-1%) | 4mo | $395,000 | $378 | 84 |
| 645 Ingraham St NW | 0.18mi | 3/1.5 | 1,116 (+6%) | 6mo | $616,100 | $552 | 76 |
| 5401-5407 9th St NW #302 | 0.23mi | 2/2.0 (-1) | 1,018 (-4%) | 1mo | $473,000 | $465 | 74 |
| 4921 7th St NW | 0.16mi | 3/1.5 | 1,152 (+9%) | 2mo | $485,000 | $421 | 73 |
| 911 Kennedy St NW #4 | 0.32mi | 2/1.5 (-1) | 960 (-9%) | 8mo | $340,000 | $354 | 56 |
| 436 Crittenden St NW | 0.44mi | 3/1.5 | 1,184 (+12%) | 3mo | $625,000 | $528 | 55 |
| 435 Kennedy St NW #3 | 0.37mi | 2/2.0 (-1) | 925 (-12%) | 3mo | $320,000 | $346 | 50 |
| 817 Varnum St NW | 0.64mi | 2/2.0 (-1) | 1,004 (-5%) | 5mo | $615,000 | $613 | 49 |
| 318 Webster St NW Unit A | 0.69mi | 2/1.5 (-1) | 1,100 (+4%) | 7mo | $465,000 | $423 | 48 |
| 501 Longfellow St NW Unit B | 0.41mi | 3/3.0 | 1,201 (+14%) | 3mo | $535,000 | $445 | 48 |
| 911 Kennedy St NW #12 | 0.32mi | 2/2.5 (-1) | 911 (-14%) | 8mo | $377,500 | $414 | 44 |
| 5885 Colorado Ave NW #208 | 0.65mi | 2/1.5 (-1) | 900 (-15%) | 4mo | $320,000 | $356 | 35 |
Match score weights: distance 35% · size 25% · config 20% · recency 20%. Top-matched comps best support the ARV.
Projected returns pro-forma
-3.0% appreciation · 1.45% rent growth · sell at horizon
- IRR
- -10.4%
- Equity multiple
- 0.63×
- Total profit
- $-31,255
- Equity at exit
- $44,582
- IRR
- -3.4%
- Equity multiple
- 0.79×
- Total profit
- $-17,867
- Equity at exit
- $25,852
Cash invested: $83,720 (down + closing). Projections, not guarantees.
Landlord ↔ Tenant lean methodology
- Overall (CITY)
- 0 Strongly Tenant-Friendly
- State District of Columbia
- 12 Strongly Tenant-Friendly · D+43
- County
- — inherits STATE
- City Washington
- 0 Strongly Tenant-Friendly · D+43
ZIP-level market 20011
- Rents YoY
- 1.4%
- Active inventory
- 370
- Price-to-rent
- 7.9×
Monthly cashflow live
- Estimated rent
- $3,165 high interval (Pro) →
- Mortgage (P&I)
- −$1,568
- Tax from tax record
- −$408 /mo · $4,895/yr
- Insurance
- −$125
- Flood insurance flood zone
- −$56 /mo · $666/yr
- HOA
- −$0
- Vacancy / Maint / Mgmt
- −$665
- Net cashflow
- $345
Break-even live
Sensitivity live
| Price | -10% $514 | -5% $429 | +0% $345 | +5% $260 | +10% $175 |
|---|---|---|---|---|---|
| Rent | -10% $95 | -5% $220 | +0% $345 | +5% $470 | +10% $595 |
| Rate | -1.0pp $495 | -0.5pp $421 | base $345 | +0.5pp $267 | +1.0pp $188 |
UW: 25.0% down · 7.5% · 30yr · 1.5% tax · 5.0% vac · 8.0% maint · 8.0% mgmt
Financing live
Cash to close
- Down payment
- $74,750
- Closing costs
- $8,970
- Reserves months
- —
- Total cash needed
- —
Loan-product check · same deal, 3 products live
Conventional
25% down · 7.5% · 30yr
- Down + closing
- —
- Monthly P&I
- —
- Monthly cashflow
- —
- DSCR
- —
- Eligible?
- —
Personal DTI + credit; lowest rate.
DSCR
20% down · 8.5% · 30yr
- Down + closing
- —
- Monthly P&I
- —
- Monthly cashflow
- —
- DSCR
- —
- Eligible?
- —
No personal income docs; deal must DSCR.
Hard money
10% down · 12.0% · 12mo
- Down + closing
- —
- Monthly P&I
- —
- Monthly cashflow
- —
- DSCR
- —
- Eligible?
- —
Short-term bridge; refi at stabilization.
Rent comps 40 comps
| Address | Beds | Baths | Sqft | Rent | $/sqft | DOM | Units | Dist |
|---|---|---|---|---|---|---|---|---|
| 5024 9th St NW Washington, DC | 2.0 | 2.0 | 770 | $2,300 | $2.99 | 4d | 1 | 0.10mi |
| 4832 Illinois Ave NW Washington, DC | 2.0 | 2.0 | 750 | $1,950 | $2.60 | 25d | 1 | 0.19mi |
| 4905 Georgia Ave NW Washington, DC | 3.0 | 2.0 | 949 | $4,400 | $4.64 | 25d | 1 | 0.20mi |
| 4905 Georgia Ave NW Unit 403 Washington, DC | 3.0 | 2.0 | 949 | $5,450 | $5.74 | 9d | 1 | 0.20mi |
| 4905 Georgia Ave NW Unit B01 Washington, DC | 2.0 | 2.0 | 1038 | $3,400 | $3.28 | 25d | 1 | 0.20mi |
| 4905 Georgia Ave NW Unit 101 Washington, DC | 3.0 | 2.0 | 896 | $4,650 | $5.19 | 9d | 1 | 0.20mi |
| 4905 Georgia Ave NW Unit 202 Washington, DC | 3.0 | 2.0 | 896 | $4,650 | $5.19 | 25d | 1 | 0.20mi |
| 816 Kennedy St NW Washington, DC | 2.0 | 2.0 | 1050 | $3,795 | $3.61 | 20d | 1 | 0.29mi |
| 710 Kennedy St NW Unit 30 Washington, DC | 2.0 | 2.0 | 830 | $2,750 | $3.31 | 25d | 1 | 0.29mi |
| 4800 Georgia Ave NW Washington, DC | 1.0–2.0 | 1.0–2.0 | 697 | $2,400 | $3.44 | 0d | 1 | 0.30mi |
| 5501 8th St NW Washington, DC | 2.0 | 1.0 | 800 | $3,300 | $4.12 | 16d | 1 | 0.31mi |
| 5413 Georgia Ave NW Washington, DC | 2.0 | 2.0 | 800 | $1,990 | $2.49 | 25d | 1 | 0.32mi |
| 839 Kennedy St NW #204 Washington, DC | 2.0 | 2.0 | 772 | $2,375 | $3.08 | 20d | 1 | 0.32mi |
| 927 Kennedy St NW Washington, DC | 1.0–2.0 | 1.0–2.0 | 728 | $3,100 | $4.26 | 20d | 2 | 0.34mi |
| 927 Kennedy St NW #301 Washington, DC | 2.0 | 2.0 | 928 | $3,100 | $3.34 | 25d | 1 | 0.35mi |
| 413 Ingraham St NW Unit 1 Washington, DC | 4.0 | 3.0 | 1464 | $4,500 | $3.07 | 0d | 1 | 0.35mi |
| 521 Kennedy St NW #4 Washington, DC | 3.0 | 2.0 | 1333 | $3,250 | $2.44 | 25d | 1 | 0.36mi |
| 5551 Illinois Ave NW Washington, DC | 2.0 | 2.0 | 716 | $1,972 | $2.75 | 25d | 2 | 0.40mi |
| 333 Delafield Pl NW Apt 1 Washington, DC | 3.0 | 2.0 | 900 | $3,950 | $4.39 | 9d | 1 | 0.42mi |
| 329 Delafield Pl NW Washington, DC | 3.0 | 1.0 | 800 | $3,750 | $4.69 | 9d | 1 | 0.42mi |
| 922 Madison St NW #301 Washington, DC | 2.0 | 1.5 | 843 | $1,900 | $2.25 | 25d | 1 | 0.45mi |
| 424 Missouri Ave NW #4 Washington, DC | 3.0 | 3.0 | 1500 | $4,500 | $3.00 | 25d | 1 | 0.48mi |
| 5601 13th St NW Washington, DC | 2.0–4.0 | 1.0–2.0 | 862 | $4,060 | $4.71 | 4d | 21 | 0.48mi |
| 4809 3rd St NW #4 Washington, DC | 2.0 | 2.0 | 715 | $2,700 | $3.78 | 20d | 1 | 0.50mi |
| 1214 Madison St NW Unit B1 Washington, DC | 2.0 | 2.0 | 1000 | $2,745 | $2.75 | 25d | 1 | 0.51mi |
| 1307 Longfellow St NW #7 Washington, DC | 2.0 | 3.0 | 899 | $3,500 | $3.89 | 12d | 1 | 0.52mi |
| 220 Hamilton St NW Washington, DC | 2.0 | 1.0–2.0 | 723 | $2,225 | $3.08 | 25d | 1 | 0.54mi |
| 907 Webster St NW #1 Washington, DC | 2.0 | 1.0 | 900 | $2,400 | $2.67 | 25d | 1 | 0.54mi |
| 5119 2nd St NW Unit 4 Washington, DC | 2.0 | 1.0 | 900 | $2,050 | $2.28 | 25d | 1 | 0.58mi |
| 5009 1st St NW Unit 4 Washington, DC | 3.0 | 1.0 | 900 | $2,500 | $2.78 | 25d | 1 | 0.64mi |
| 5009 1st St NW Unit 3 Washington, DC | 3.0 | 1.0 | 900 | $3,000 | $3.33 | 25d | 1 | 0.64mi |
| 5816 Georgia Ave NW Washington, DC | 1.0–3.0 | 1.0 | 600 | $3,200 | $5.33 | 23d | 11 | 0.65mi |
| 5822 9th St NW Unit 4 Washington, DC | 3.0 | 1.0 | 725 | $2,999 | $4.14 | 25d | 1 | 0.65mi |
| 5885 Colorado Ave NW #212 Washington, DC | 2.0 | 2.0 | 938 | $3,200 | $3.41 | 25d | 1 | 0.66mi |
| 811 Upshur St NW #1 Washington, DC | 2.0 | 2.0 | 920 | $2,650 | $2.88 | 25d | 1 | 0.67mi |
| 1424 Buchanan St NW #2 Washington, DC | 2.0 | 2.0 | 1070 | $3,300 | $3.08 | 20d | 1 | 0.68mi |
| 1222 Missouri Ave NW Washington, DC | 2.0 | 2.0 | 950 | $2,395 | $2.52 | 25d | 1 | 0.70mi |
| 1222 Missouri Ave NW Unit 1 Washington, DC | 2.0 | 1.0 | 800 | $1,995 | $2.49 | 25d | 1 | 0.70mi |
| 1340 Nicholson St NW #2 Washington, DC | 2.0 | 2.0 | 827 | $2,600 | $3.14 | 25d | 1 | 0.70mi |
| 4330 3rd St NW Unit 1 Washington, DC | 2.0 | 1.0 | 800 | $2,000 | $2.50 | 25d | 1 | 0.70mi |
Listing history 22 events
-
2026-06-21days on market $299,000 Active 50 DOM
-
2026-06-18days on market $299,000 Active 47 DOM
-
2026-06-17days on market $299,000 Active 46 DOM
-
2026-06-16days on market $299,000 Active 45 DOM
-
2026-06-15days on market $299,000 Active 44 DOM
-
2026-06-13days on market $299,000 Active 42 DOM
-
2026-06-09days on market $299,000 Active 38 DOM
-
2026-06-08days on market $299,000 Active 37 DOM
-
2026-06-07days on market $299,000 Active 36 DOM
-
2026-06-04days on market $299,000 Active 33 DOM
-
2026-06-03days on market $299,000 Active 32 DOM
-
2026-06-02days on market $299,000 Active 31 DOM
-
2026-06-01days on market $299,000 Active 30 DOM
-
2026-05-31days on market $299,000 Active 29 DOM
-
2026-05-02$299,000 Active
-
2024-07-10soldstatus $540,000
-
2024-05-31soldstatus $540,000 Closed
-
2024-04-22historical Active Under Contract
-
2024-04-22status Active
-
2024-02-01historical
-
2024-02-01$575,000 Active
-
2024-01-22historical $575,000
ⓘ Source: listings_history table (triggers on properties + properties_extension) + one-shot
backfill from property_details.listing_events for pre-trigger history.
Tax reassessment forecast DC · Partial reset (capped growth)
- Current annual tax
- $4,895 · $408/mo
- Projected year-2 tax
- $4,895 · $408/mo
- Expected delta
- $0/yr ($0/mo · 0.0%)
ⓘ Screening estimate from a state-policy table — verify with the county assessor before closing.
Climate risk First Street
- Flood 8/10 Severe FEMA zone X (unshaded) · 78% chance over 30 yrs
- Wildfire 1/10 Low
- Heat 7/10 Severe 7 d/yr ≥104°F today · 15 d/yr by 30 yrs out
- Wind 4/10 Moderate 16% chance of damaging wind over 30 yrs
- Air quality 4/10 Moderate 5 unhealthy d/yr today · 6 by 30 yrs out
Nearby sold comps map
Loading sold comps map…
Walkable amenities ~0.75 mi
Loading nearby amenities…
Taxation est. · year 1
- Rental income
- $37,986
- − Mortgage interest
- −$16,749
- − Property taxes
- −$4,895
- − Insurance
- −$2,162
- − Repairs & maintenance
- −$3,039
- − Management
- −$3,039
- − Depreciation
- −$8,698
- Taxable loss
- −$595
- Est. tax savings @ 24.0%
- +$143
- After-tax cash flow
- $4,279/yr
For passive investors: Depreciation is non-cash, so a rental often shows a tax loss while cash-flowing — sheltering income. Rental losses are passive: they offset passive income freely, and up to $25,000/yr can offset ordinary (W-2) income if you actively participate and your MAGI is under $100k (phasing out to $0 by $150k); unused losses carry forward. On sale, claimed depreciation is recaptured at up to 25%, and gains may owe capital-gains tax (a 1031 exchange can defer both). Figures are a year-1 estimate at your 24.0% rate — not tax advice; consult a CPA.
Schools (NCES district)
- District
- District Of Columbia Public Schools
- NCES district ID
- 1100030
- Math proficiency
- 33% ▲ 3.00%
- Reading proficiency
- 40% ▲ 5.00%
- Median HH income
- $67,671
- Composite
- 35.84/100
- National rank
- #9606
- State rank
- #8 of 32 in DC
Livability — Washington
- Score
- 73/100
- State rank
- #1
- US rank
- #5327
Category grades
Schools grade is shown separately in the Schools card above.
Census & demographics
- Census place
- Washington, DC
- County
- District of Columbia · 671,873 people
- City population
- 671,873
- Metro
- Washington-Arlington-Alexandria, DC-VA-MD-WV
- Population (ZIP)
- 67,434
- Household income
- $110,309
- Rent vs Own
- Severe rent burden
- 3020.0
Population outlook (District of Columbia County) Hauer SSP2
- Today (2025)
- 821,926 people
- By 2030
- 899,517 · +9.4%
- By 2040
- 1,061,162 · +29.1%
- By 2050
- 1,231,493 · +49.8%
- By 2075
- 1,603,312 · +95.1%
- By 2100
- 1,847,141 · +124.7%
Race, ethnicity, and origin ACS 2023
- Neighborhood character
- Diverse neighborhood (Simpson 0.66)
- Race & ethnicity
- Black 50% Hispanic / Latino 23% White 20% Two or more races 10% Asian 2%
- Hispanic origin (detail)
- Mexican 2% Dominican 1%
- Common ancestry
- Lithuanian 1% Romanian 1% Slovak 1%
- Foreign-born
- 21% · Canada
- Languages at home
- 70% English-only · Spanish 20% French/Haitian/Cajun 2% Other Indo-European 1%
Political lean MEDSL · District of Columbia
- 2024 margin
- Solid D (+86.1) · D 91.2% · R 5.1% · Other 3.8%
- 2008→2024 swing
- +0.1pp no change · 2008: 85.9pp · 2024: 86.1pp
- All cycles
- 2024: D+86.1 2020: D+86.8 2016: D+88.7 2012: D+84.2 2008: D+85.9
Not yet ingested
- Civics
- —
Market trends
- HPI YoY
- ▼ -755.96%
- Current HPI
- 378.1083
- Rent YoY
- ▲ 1.45%
- Metro
- Washington-Arlington-Alexandria, DC-VA-MD-WV
- State GDP YoY
- ▲ 1.33%
- F500 in state
- 6
Industry mix (Fortune 500 HQ in DC)
| Industry | F500 HQs | Revenue |
|---|---|---|
| Financial Services | 1 | $153B |
|
||
| Life Sciences / Industrials | 1 | $25B |
|
||
| Industrial Machinery | 1 | $8B |
|
||
Price history
-48.0% since first listed8 events — show timeline
- 2026-05-02 Listed $299,000 BRIGHT MLS
- 2024-07-10 Sold (Public Records) $540,000 Public Records
- 2024-05-31 Sold (MLS) $540,000 BRIGHT MLS
- 2024-04-22 Contingent — BRIGHT MLS
- 2024-04-22 Relisted — BRIGHT MLS
- 2024-02-01 Listing Removed — BRIGHT MLS
- 2024-02-01 Listed $575,000 BRIGHT MLS
- 2024-01-22 Coming Soon $575,000 BRIGHT MLS
Property tax history
+13.6%/yrLatest (2025): $4,895 · +308.3% YoY. Source: county tax records.
Cash-flow waterfall
monthlySold comps — $/sqft
last 12 mo · ≤1 miLoading sold comps…