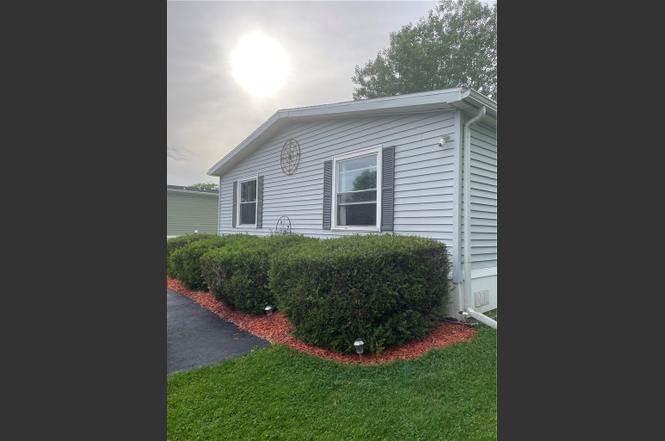
113 Trinity Dr · Holley, NY
Flood risk 1/10 · Minimal
- FEMA flood zone
- —
- Chance of flooding over 30 yrs
- 0.0%
- Est. flood insurance / yr
- —
Fire risk 3/10 · Minor
- Est. fire insurance / yr
- $691 – $1,283
Heat risk 2/10 · Minimal
- Hot days now (above 94°F)
- 7 days/yr
- Hot days in 30 yrs
- 16 days/yr
Wind risk 1/10 · Minimal
- Chance of severe wind over 30 yrs
- —
Air-quality risk 2/10 · Minimal
- Unhealthy air days now
- 1 days/yr
- Unhealthy air days in 30 yrs
- 2 days/yr
Risk factors via First Street. Map © Google.
Why this score? — see what drove the C grade
The composite is a weighted blend of 9 inputs, each scored 0–100. Each bar is that input's sub-score; the figure is the points it added to the 100-point composite (weight × sub-score).
- Cash flow +30.0/30.0
- DSCR +10.0/10.0
- 1% rule +8.1/10.0
- Schools +3.5/10.0
- Livability +3.2/5.0
- Rent growth +2.5/5.0
- Condition / age +2.5/5.0
- ARV discount +0.0/15.0
- Appreciation +0.0/10.0
$99,900
🖨 Deal sheet (PDF) 📄 Offer letter ✓ Due diligence
Listing remarks
Immaculate home with many updates , including NEW 95% efficient furnace and central air, other updates include new stove, 5 year old roof and flooring. Property features three bedrooms, 2.5 baths, living room and family room, kitchen plus formal dining, separate laundry room and a bonus storage room, cathedral ceilings, three car wide driveway and the lot is nicely landscaped. All appliances are included and furnishings are all negotiable. Property will show by appointment only, after 4pm on weekdays and anytime on weekends.
Key facts
- 5 year old roof
- New stove
- Bonus storage room
Tags
Property features AI
Finance
- Other: Land lease amount applies
- Financial info: Land lease applies
Exterior
- Parking: No garage; Driveway
- Utilities: High-speed internet available; Public water connected; Sewer connected; Circuit breaker electrical panel
- Home design: Single-story (1 story); Double-wide mobile home (Titan); Pillar/post/pier foundation; Architectural shingle roof; Vinyl siding; Rectangular residential lot on a city street (40 x 75)
- Construction: Vinyl siding construction; Architectural shingle roof; Pillar/post/pier foundation; Existing (resale) condition
- Exterior features: Blacktop driveway; Covered porch; Deck; Shed(s) / additional storage; Leased propane tank
Interior
- Kitchen: Gas oven; Gas range; Range hood; Refrigerator; Exhaust fan
- Bedrooms: Three main-level bedrooms
- Flooring: Carpet; Luxury vinyl; Varies
- Bathrooms: Two full bathrooms; One half bathroom; Three main-level bathrooms
- Heating & cooling: Propane heating with forced air; Central air conditioning
- Interior features: Ceiling fans; Cathedral ceilings; Separate/formal dining room; Separate/formal living room; Storage; Window treatments; Drapes; Thermal windows; Accessible bedroom; Low-threshold shower; Primary suite with bath in primary bedroom; Bedroom on main level; Main level primary
- Laundry & utility: Washer; Dryer; Main-level laundry with accessible utilities
Neighborhood map
What this means for you Summary
Snapshot
- This is a 3-bed/1.0-bath manufactured listed at $100k.
Deal economics
- At list price, monthly cash flow is $406 ($5k/yr) — positive.
- The deal already cash-flows at list — no discount required.
- Meets the 1% rule at list price ($1k rent vs $100k).
- Cap rate 11.2% vs local median 4.4% in Holley — top-decile yield for the area; either an underpriced asset or a hidden risk that comps aren't pricing in. Stress-test before assuming the spread holds.
Location & tenants
- Location reads 65/100 on livability (#705 in NY) — a middle-class / working-renter tenant base. Strengths: cost of living A+, housing A+, crime A-; Watch: schools D, amenities F, commute F.
- Holley Central School District (town): math 38% / reading 44% proficiency, ranked #505 of 590 in NY (top 86%) — families likely to look elsewhere, expect single-tenant / working-renter base with shorter leases.
- Market conditions: 43 active listings in the ZIP; 28 units permitted in Orleans County in 2024 (0 in 5+ unit buildings).
Forward outlook
- Local home prices are declining (-3.0%/yr); year-one equity from $691 of loan paydown is wiped out by about $3k of value loss. Plan a longer hold.
- Orleans County population projected at -20% by 2050 — secular population decline; favor cash flow + early exit over multi-decade hold.
- At projected returns (-3.0% appreciation + 3.0% rent growth), your $28k cash investment doubles in ~7 years — after that, you're playing with house money.
Negotiation context
- Only 1 days on market — expect competitive offers; lowballing is unlikely to land.
- 2 sale attempts since 12y ago with the ask held roughly flat each time — persistent listings suggest the price (not the market) is what's stuck; bring a comps-based counter.
- Current owner paid $28k; list at $100k implies a 251% gain — meaningful room to come down on a strong offer.
Questions for the listing agent
- Is there a deadline driving the sale (1031 exchange, divorce, estate, relocation)? That informs how much negotiation room exists.
- Schools are D-rated, which usually means shorter tenancies and higher turnover. Who's the typical renter profile here, and what's been the actual vacancy rate?
- What's the average days-on-market for RENTAL listings here right now (not sales)? A rising rental-DOM trend means longer vacancies and softer asking-rent achievability than the comps imply.
- What's the recent tenant-quality profile in this submarket — average credit score on applications, eviction rate, late-payment / NSF rate, and stable-employment percentage? A property-management company in the area should have these aggregated.
- How much new for-sale + rental construction is in the pipeline within 1–3 miles? Heavy new supply typically softens prices + rents 12–24 months out; constrained supply supports both.
Investment metrics
- 1% rule
- 1.31% ✓
- Cap rate
- 11.17%
- Cash-on-cash
- 17.42%
- DSCR
- 1.78
- GRM
- 6.3
CMA / ARV
- ARV (on-the-fly)
- $68,880
- Comps found
- 12
Show comp detail 12 sales within ~0.75 mi
| Address | Dist | Beds/Ba | Sqft | Sold | Price | $/sf | Match |
|---|---|---|---|---|---|---|---|
| 128 Trinity Drive Dr | 0.11mi | 3/2.0 | 1,680 (0%) | 1mo | $82,500 | $49 | 90 |
| 225 Sunset Dr | 0.09mi | 3/2.0 | 1,680 (0%) | 8mo | $103,000 | $61 | 86 |
| 211 Sunset Dr | 0.06mi | 2/2.0 (-1) | 1,568 (-7%) | 1mo | $45,000 | $29 | 77 |
| 537 Rockview Dr | 0.27mi | 3/2.0 | 1,624 (-3%) | 7mo | $94,000 | $58 | 72 |
| 127 Trinity Dr | 0.08mi | 3/2.5 | 1,792 (+7%) | 12mo | $62,000 | $35 | 70 |
| 299 Sunset Dr | 0.25mi | 3/2.0 | 1,568 (-7%) | 10mo | $50,100 | $32 | 65 |
| 525 Rockview Dr | 0.24mi | 3/2.0 | 1,612 (-4%) | 19mo | $66,000 | $41 | 62 |
| 155 Trinity Dr | 0.17mi | 3/2.0 | 1,512 (-10%) | 13mo | $55,000 | $36 | 61 |
| 283 Sunset Dr | 0.21mi | 3/2.0 | 1,456 (-13%) | 11mo | $47,500 | $33 | 55 |
| 903 Cobblestone Ct | 0.25mi | 4/2.0 (+1) | 1,496 (-11%) | 12mo | $117,000 | $78 | 51 |
| 301 Sunset Dr | 0.26mi | 3/2.0 | 1,904 (+13%) | 17mo | $75,000 | $39 | 48 |
| 291 Sunset Dr | 0.23mi | 3/2.0 | 1,440 (-14%) | 18mo | $70,000 | $49 | 46 |
Match score weights: distance 35% · size 25% · config 20% · recency 20%. Top-matched comps best support the ARV.
Projected returns pro-forma
-3.0% appreciation · 3.0% rent growth · sell at horizon
- IRR
- 8.8%
- Equity multiple
- 1.35×
- Total profit
- $9,657
- Equity at exit
- $14,895
- IRR
- 18.0%
- Equity multiple
- 2.49×
- Total profit
- $41,642
- Equity at exit
- $8,638
Cash invested: $27,972 (down + closing). Projections, not guarantees.
Landlord ↔ Tenant lean methodology
- Overall (STATE)
- 15 Strongly Tenant-Friendly
- State New York
- 15 Strongly Tenant-Friendly · D+10
- County
- — inherits STATE
- City
- — inherits STATE
ZIP-level market 14470
- Home prices YoY
- -10.8%
- Active inventory
- 43
- Price-to-rent
- 6.3×
Monthly cashflow live
- Estimated rent
- $1,312 medium interval (Pro) →
- Mortgage (P&I)
- −$524
- Tax from tax record
- −$65 /mo · $781/yr
- Insurance
- −$42
- HOA
- −$0
- Vacancy / Maint / Mgmt
- −$276
- Net cashflow
- $406
Break-even live
Sensitivity live
| Price | -10% $463 | -5% $434 | +0% $406 | +5% $378 | +10% $350 |
|---|---|---|---|---|---|
| Rent | -10% $302 | -5% $354 | +0% $406 | +5% $458 | +10% $510 |
| Rate | -1.0pp $456 | -0.5pp $431 | base $406 | +0.5pp $380 | +1.0pp $354 |
UW: 25.0% down · 7.5% · 30yr · 1.5% tax · 5.0% vac · 8.0% maint · 8.0% mgmt
Financing live
Cash to close
- Down payment
- $24,975
- Closing costs
- $2,997
- Reserves months
- —
- Total cash needed
- —
Loan-product check · same deal, 3 products live
Conventional
25% down · 7.5% · 30yr
- Down + closing
- —
- Monthly P&I
- —
- Monthly cashflow
- —
- DSCR
- —
- Eligible?
- —
Personal DTI + credit; lowest rate.
DSCR
20% down · 8.5% · 30yr
- Down + closing
- —
- Monthly P&I
- —
- Monthly cashflow
- —
- DSCR
- —
- Eligible?
- —
No personal income docs; deal must DSCR.
Hard money
10% down · 12.0% · 12mo
- Down + closing
- —
- Monthly P&I
- —
- Monthly cashflow
- —
- DSCR
- —
- Eligible?
- —
Short-term bridge; refi at stabilization.
Listing history 2 events
-
2026-06-18remarks 530-char remark
-
2026-06-18$99,900 Active 1 DOM
ⓘ Source: listings_history table (triggers on properties + properties_extension) + one-shot
backfill from property_details.listing_events for pre-trigger history.
Tax reassessment forecast NY · Partial reset (capped growth)
- Current annual tax
- $781 · $65/mo
- Projected year-2 tax
- $1,235 · $103/mo
- Expected delta
- +$454/yr (+$38/mo · 58.1%)
ⓘ Screening estimate from a state-policy table — verify with the county assessor before closing.
Climate risk First Street
- Flood 1/10 Low 0% chance over 30 yrs
- Wildfire 3/10 Moderate
- Heat 2/10 Low 7 d/yr ≥94°F today · 16 d/yr by 30 yrs out
- Wind 1/10 Low
- Air quality 2/10 Low 1 unhealthy d/yr today · 2 by 30 yrs out
Nearby sold comps map
Loading sold comps map…
Walkable amenities ~0.75 mi
Loading nearby amenities…
Taxation est. · year 1
- Rental income
- $15,746
- − Mortgage interest
- −$5,596
- − Property taxes
- −$781
- − Insurance
- −$500
- − Repairs & maintenance
- −$1,260
- − Management
- −$1,260
- − Depreciation
- −$2,906
- Taxable income
- $3,445
- Est. tax owed @ 24.0%
- −$827
- After-tax cash flow
- $4,046/yr
For passive investors: Depreciation is non-cash, so a rental often shows a tax loss while cash-flowing — sheltering income. Rental losses are passive: they offset passive income freely, and up to $25,000/yr can offset ordinary (W-2) income if you actively participate and your MAGI is under $100k (phasing out to $0 by $150k); unused losses carry forward. On sale, claimed depreciation is recaptured at up to 25%, and gains may owe capital-gains tax (a 1031 exchange can defer both). Figures are a year-1 estimate at your 24.0% rate — not tax advice; consult a CPA.
Schools (NCES district)
- District
- Holley Central School District
- NCES district ID
- 3614610
- Math proficiency
- 38% ▼ -10.00%
- Reading proficiency
- 44% ▲ 2.00%
- Median HH income
- $48,177
- Composite
- 35.13/100
- National rank
- #5013
- State rank
- #505 of 590 in NY
Livability — Holley
- Score
- 65/100
- State rank
- #705
- US rank
- #13281
Category grades
Schools grade is shown separately in the Schools card above.
Census & demographics
- Population (ZIP)
- 7,765
Population outlook (Orleans County) Hauer SSP2
- Today (2025)
- 39,123 people
- By 2030
- 37,648 · -3.8%
- By 2040
- 34,432 · -12.0%
- By 2050
- 31,487 · -19.5%
- By 2075
- 26,544 · -32.2%
- By 2100
- 22,251 · -43.1%
Race, ethnicity, and origin ACS 2023
- Neighborhood character
- Predominantly White (91%)
- Race & ethnicity
- White 91% Two or more races 4% Hispanic / Latino 3% Black 2%
- Common ancestry
- Romanian 4% Iranian 4% Lithuanian 3%
- Foreign-born
- 3% · Canada
- Languages at home
- 97% English-only · Spanish 1% Tagalog/Filipino 1% German/W. Germanic 1%
Political lean MEDSL · Orleans
- 2024 margin
- Solid R (+40.5) · D 29.8% · R 70.2%
- 2008→2024 swing
- -21.8pp toward R · 2008: -18.7pp · 2024: -40.5pp
- All cycles
- 2024: R+40.5 2020: R+36.0 2016: R+43.4 2012: R+19.4 2008: R+18.7
Not yet ingested
- Civics
- —
Market trends
- HPI YoY
- ▼ -34.80%
- Current HPI
- 287.9167
- Rent YoY
- —
- Metro
- —
- State GDP YoY
- ▲ 2.60%
- F500 in state
- 92
Industry mix (Fortune 500 HQ in NY)
| Industry | F500 HQs | Revenue |
|---|---|---|
| Financial Services | 10 | $950B |
|
||
| Consumer Goods | 9 | $162B |
|
||
| Insurance | 4 | $225B |
|
||
| Telecommunications | 2 | $144B |
|
||
| Pharmaceuticals | 2 | $112B |
|
||
| Media / Entertainment | 2 | $69B |
|
||
Price history
+234.1% since first listed3 events — show timeline
- 2026-06-18 Listed $99,900 UNYREIS
- 2015-02-03 Sold (MLS) $28,500 UNYREIS
- 2014-10-13 Listed $29,900 UNYREIS
Property tax history
+5.5%/yrLatest (2025): $781 · -0.2% YoY. Source: county tax records.
Cash-flow waterfall
monthlySold comps — $/sqft
last 12 mo · ≤1 miLoading sold comps…