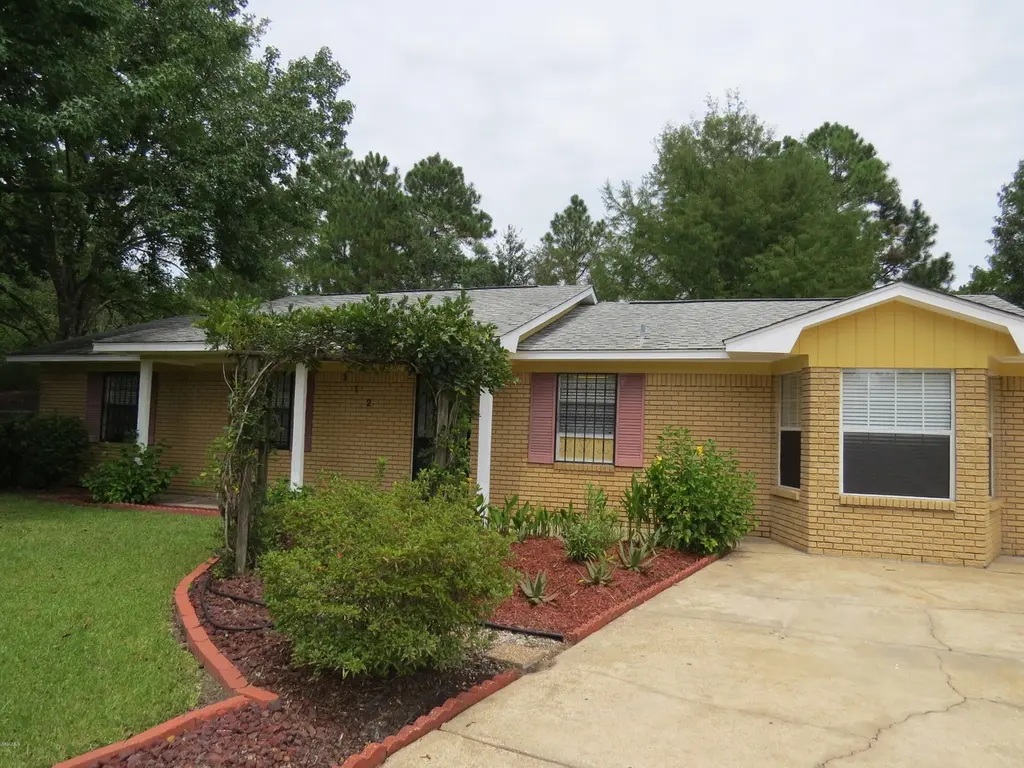
312 Mary Dr · Gulfport, MS
Flood risk 1/10 · Minimal
- FEMA flood zone
- X (unshaded)
- Chance of flooding over 30 yrs
- 0.0%
- Est. flood insurance / yr
- $507 – $1,088
Fire risk 4/10 · Minor
- Est. fire insurance / yr
- $1,241 – $2,305
Heat risk 9/10 · Severe
- Hot days now (above 107°F)
- 7 days/yr
- Hot days in 30 yrs
- 20 days/yr
Wind risk 9/10 · Severe
- Chance of severe wind over 30 yrs
- 99.0%
Air-quality risk 1/10 · Minimal
- Unhealthy air days now
- 0 days/yr
- Unhealthy air days in 30 yrs
- 0 days/yr
Risk factors via First Street. Map © Google.
Why this score? — see what drove the F grade
The composite is a weighted blend of 9 inputs, each scored 0–100. Each bar is that input's sub-score; the figure is the points it added to the 100-point composite (weight × sub-score).
- Cash flow +12.1/30.0
- Rent growth +4.2/5.0
- Schools +4.2/10.0
- Livability +3.7/5.0
- DSCR +3.6/10.0
- 1% rule +3.5/10.0
- Condition / age +2.5/5.0
- ARV discount +0.0/15.0
- Appreciation +0.0/10.0
$189,000
🖨 Deal sheet 📄 Offer letter ✓ Due diligence
Listing remarks MLS
REDUCED! Looking for a brick 4 bedroom house that is affordable? Look no further! Located at the cul de sac this house has lots of charm and space. The house has fresh new paint, new carpeting, great room, wet bar, split floor plan, master bath has large vanity & whirlpool tub, master bedroom has a private porch, deck, single garage, nice flower area with arch trellis, fenced yard, shed, & much more. This house is move-in ready and awaiting new owners!
Key facts
- Built 1980
Tags
Neighborhood map
What this means for you Summary
Snapshot
- This is a 4-bed/1.5-bath single-family listed at $189k.
Deal economics
- At list price, monthly cash flow is $-43 ($-518/yr) — negative.
- To cash-flow at today's rent, offer at most $183k (3.3% below list).
- To meet the 1% rule (rent ≥ 1% of price), the offer needs to be $160k (15.4% below list).
- Recommended offer: $160k (15.4% below list) — sets the bar for 1% rule.
- Cap rate 6.0% vs local median 4.9% in Gulfport — meaningfully above typical; check what's discounted (condition, days-on-market, listing class) to confirm the premium yield is real.
Location & tenants
- Location reads 73/100 on livability (#15 in MS) — a middle-class / working-renter tenant base. Strengths: cost of living A+, housing A+, health & safety A+; Watch: schools D, amenities F, commute F.
- Harrison County School District (rural): math 52% / reading 46% proficiency, ranked #14 of 130 in MS (top 11%) — families likely to look elsewhere, expect single-tenant / working-renter base with shorter leases; 62% free/reduced lunch — lower-income household profile, screen leases tightly.
- Market conditions: Rents rising fast (+7.0%/yr); 763 active listings in the ZIP; 15 comparable units currently listed for rent nearby; rentals lingering (median 44d on market — plan ~5-8 weeks vacancy on turnover, expect pricing pressure); 53% of comp listings sitting > 30 days — soft ceiling on asking rent; 2,194 units permitted in Harrison County in 2024 (0 in 5+ unit buildings).
- This rent runs 31% of the median local income ($63k/yr) — at the standard rent-burdened threshold; future hikes will face affordability resistance.
Forward outlook
- Local home prices are declining (-3.0%/yr); year-one equity from $1k of loan paydown is wiped out by about $6k of value loss. Plan a longer hold.
- Harrison County population projected at +27% by 2050 — long-run rental-demand tailwind backs the buy-and-hold thesis.
Negotiation context
- Only 1 days on market — expect competitive offers; lowballing is unlikely to land.
- 4 sale attempts since 9y ago; this cycle's ask is 9350% above the opening price — seller raised mid-cycle; expect resistance to lowballs.
- Current owner paid $125k; list at $189k implies a 51% gain — meaningful room to come down on a strong offer.
Risks & watch-outs
- Climate carrying-cost: severe wind risk, 99% chance of damaging wind over 30y; extreme-heat days projected 7→20/yr by 2055 (HVAC capex compounding) — expect insurance premiums to compound above CPI over the hold.
Questions for the listing agent
- What do current leases actually rent for vs. the listed asking? Can we see a recent rent roll and the last 12 months of T-12 income?
- Is there a deadline driving the sale (1031 exchange, divorce, estate, relocation)? That informs how much negotiation room exists.
- Schools are D-rated, which usually means shorter tenancies and higher turnover. Who's the typical renter profile here, and what's been the actual vacancy rate?
- The area grade is low — what's the realistic commute time and amenity access for the typical tenant pool here? Any planned neighborhood developments (good or bad) we should know about?
- What's the average days-on-market for RENTAL listings here right now (not sales)? A rising rental-DOM trend means longer vacancies and softer asking-rent achievability than the comps imply.
- What's the recent tenant-quality profile in this submarket — average credit score on applications, eviction rate, late-payment / NSF rate, and stable-employment percentage? A property-management company in the area should have these aggregated.
- How much new for-sale + rental construction is in the pipeline within 1–3 miles? Heavy new supply typically softens prices + rents 12–24 months out; constrained supply supports both.
Investment metrics
- 1% rule
- 0.85% ✗
- Cap rate
- 6.02%
- Cash-on-cash
- -0.98%
- DSCR
- 0.96
- GRM
- 9.9
CMA / ARV
- ARV (on-the-fly)
- $139,650
- Comps found
- 12
Show comp detail 12 sales within ~0.75 mi
| Address | Dist | Beds/Ba | Sqft | Sold | Price | $/sf | Match |
|---|---|---|---|---|---|---|---|
| 305 Lavelle Dr | 0.10mi | 3/2.0 (-1) | 1,050 (0%) | 3mo | $140,000 | $133 | 86 |
| 201 Mary Dr | 0.13mi | 3/1.5 (-1) | 1,053 (+0%) | 10mo | $170,000 | $161 | 81 |
| 201 Tandy Dr | 0.21mi | 3/1.5 (-1) | 1,026 (-2%) | 9mo | $89,900 | $88 | 74 |
| 1008 Debra Dr | 0.48mi | 3/1.5 (-1) | 1,066 (+2%) | 10mo | $139,900 | $131 | 62 |
| 218 Kimberly Dr | 0.25mi | 3/1.0 (-1) | 980 (-7%) | 10mo | $89,900 | $92 | 62 |
| 710 Beverly Dr | 0.51mi | 3/2.0 (-1) | 1,014 (-3%) | 3mo | $140,000 | $138 | 61 |
| 801 Shirley Dr | 0.43mi | 3/1.5 (-1) | 986 (-6%) | 5mo | $80,750 | $82 | 61 |
| 12095 Highland Ave | 0.41mi | 3/1.0 (-1) | 912 (-13%) | 4mo | $79,850 | $88 | 48 |
| 13470 Windsong Dr | 0.49mi | 3/2.0 (-1) | 1,140 (+9%) | 10mo | $160,000 | $140 | 48 |
| 13007 Walnut Ct | 0.70mi | 3/2.0 (-1) | 1,017 (-3%) | 9mo | $169,000 | $166 | 47 |
| 120 Imilda Dr | 0.51mi | 3/2.0 (-1) | 1,200 (+14%) | 3mo | $79,900 | $67 | 43 |
| 122 Clarence Dr | 0.58mi | 3/2.0 (-1) | 1,200 (+14%) | 10mo | $179,500 | $150 | 34 |
Match score weights: distance 35% · size 25% · config 20% · recency 20%. Top-matched comps best support the ARV.
Projected returns pro-forma
-3.0% appreciation · 6.99% rent growth · sell at horizon
- IRR
- -13.5%
- Equity multiple
- 0.50×
- Total profit
- $-26,676
- Equity at exit
- $28,181
- IRR
- 0.7%
- Equity multiple
- 1.06×
- Total profit
- $3,071
- Equity at exit
- $16,341
Cash invested: $52,920 (down + closing). Projections, not guarantees.
Landlord ↔ Tenant lean methodology
- Overall (STATE)
- 90 Strongly Landlord-Friendly
- State Mississippi
- 90 Strongly Landlord-Friendly · R+11
- County
- — inherits STATE
- City
- — inherits STATE
ZIP-level market 39503
- Home prices YoY
- -21.5%
- Rents YoY
- 7.0%
- Active inventory
- 763
- Price-to-rent
- 9.9×
Monthly cashflow live
- Estimated rent
- $1,599 high interval (Pro) →
- Mortgage (P&I)
- −$991
- Tax est. 1.5%
- −$236 /mo · $2,835/yr
- Insurance
- −$79
- HOA
- −$0
- Vacancy / Maint / Mgmt
- −$336
- Net cashflow
- $-43
Break-even live
UW: 25.0% down · 7.5% · 30yr · 1.5% tax · 5.0% vac · 8.0% maint · 8.0% mgmt
Financing live
Cash to close
- Down payment
- $47,250
- Closing costs
- $5,670
- Reserves months
- —
- Total cash needed
- —
Loan-product check · same deal, 3 products live
Conventional
25% down · 7.5% · 30yr
- Down + closing
- —
- Monthly P&I
- —
- Monthly cashflow
- —
- DSCR
- —
- Eligible?
- —
Personal DTI + credit; lowest rate.
DSCR
20% down · 8.5% · 30yr
- Down + closing
- —
- Monthly P&I
- —
- Monthly cashflow
- —
- DSCR
- —
- Eligible?
- —
No personal income docs; deal must DSCR.
Hard money
10% down · 12.0% · 12mo
- Down + closing
- —
- Monthly P&I
- —
- Monthly cashflow
- —
- DSCR
- —
- Eligible?
- —
Short-term bridge; refi at stabilization.
Rent comps 15 comps
| Address | Beds | Baths | Sqft | Rent | $/sqft | DOM | Units | Dist |
|---|---|---|---|---|---|---|---|---|
| 12040 Highland Ave Gulfport, MS | 3.0 | 2.0 | 1019 | $950 | $0.93 | 13d | 1 | 0.49mi |
| 12147 Prudie Cir Gulfport, MS | 3.0 | 2.0 | 1100 | $975 | $0.89 | 43d | 1 | 0.56mi |
| 1009 Michelle Dr Gulfport, MS | 4.0 | 2.0 | 1254 | $1,650 | $1.32 | 43d | 1 | 0.60mi |
| 125 Clarence Dr Gulfport, MS | 3.0 | 2.0 | 1300 | $1,500 | $1.15 | 13d | 1 | 0.61mi |
| 12450 Three Rivers Rd Gulfport, MS | 3.0 | 2.0 | 1098 | $1,295 | $1.18 | 43d | 1 | 0.61mi |
| 13070 Tracewood Dr Gulfport, MS | 3.0 | 2.0 | 1190 | $1,400 | $1.18 | 21d | 1 | 1.04mi |
| 101 Fore St Gulfport, MS | 3.0 | 2.0 | 1215 | $1,700 | $1.40 | 13d | 1 | 1.06mi |
| 11200 Three Rivers Rd Gulfport, MS | 3.0 | 2.0 | 1124 | $1,445 | $1.29 | 13d | 1 | 1.07mi |
| 15251 Parkwood Dr N Gulfport, MS | 3.0 | 2.5 | 1200 | $1,200 | $1.00 | 43d | 1 | 1.27mi |
| 11502 Camden Court Cir Gulfport, MS | 3.0 | 2.0 | 1495 | $1,775 | $1.19 | 21d | 1 | 1.28mi |
| 11425 Camden Court Cir Gulfport, MS | 3.0 | 2.0 | 1495 | $1,775 | $1.19 | 21d | 1 | 1.35mi |
| 11413 Camden Court Cir Gulfport, MS | 3.0 | 2.0 | 1495 | $1,775 | $1.19 | 43d | 1 | 1.35mi |
| 11487 Camden Court Cir Gulfport, MS | 3.0 | 2.0 | 1495 | $1,775 | $1.19 | 43d | 1 | 1.35mi |
| 11405 Camden Court Cir Gulfport, MS | 3.0 | 2.0 | 1495 | $1,775 | $1.19 | 43d | 1 | 1.35mi |
| 15373 Saint Charles St Gulfport, MS | 3.0 | 1.0–3.0 | 1075 | $1,350 | $1.26 | 43d | 2 | 1.47mi |
Listing history 10 events
-
2024-09-25historical $2,000
-
2024-09-21$2,000
-
2024-09-16historical $2,000
-
2024-08-18$2,000
-
2023-12-14historical
-
2023-07-28price $169,500
-
2023-06-13$176,000 Active
-
2018-08-06soldstatus 464-char remark
Show marketing remark (464 chars)
REDUCED! Looking for a brick 4 bedroom house that is affordable? Look no further! Located at the cul de sac this house has lots of charm and space. The house has fresh new paint, new carpeting, great room, wet bar, split floor plan, master bath has large vanity & whirlpool tub, master bedroom has a private porch, deck, single garage, nice flower area with arch trellis, fenced yard, shed, & much more. This house is move-in ready and awaiting new owners!
-
2018-08-03soldstatus $125,000
-
2017-08-30$124,900 464-char remark
Show marketing remark (464 chars)
REDUCED! Looking for a brick 4 bedroom house that is affordable? Look no further! Located at the cul de sac this house has lots of charm and space. The house has fresh new paint, new carpeting, great room, wet bar, split floor plan, master bath has large vanity & whirlpool tub, master bedroom has a private porch, deck, single garage, nice flower area with arch trellis, fenced yard, shed, & much more. This house is move-in ready and awaiting new owners!
ⓘ Source: listings_history table (triggers on properties + properties_extension) + one-shot
backfill from property_details.listing_events for pre-trigger history.
Climate risk First Street
- Flood 1/10 Low FEMA zone X (unshaded) · 0% chance over 30 yrs
- Wildfire 4/10 Moderate
- Heat 9/10 Extreme 7 d/yr ≥107°F today · 20 d/yr by 30 yrs out
- Wind 9/10 Extreme 99% chance of damaging wind over 30 yrs
- Air quality 1/10 Low 0 unhealthy d/yr today · 0 by 30 yrs out
Nearby sold comps map
Loading sold comps map…
Walkable amenities ~0.75 mi
Loading nearby amenities…
Taxation est. · year 1
- Rental income
- $19,184
- − Mortgage interest
- −$10,587
- − Property taxes
- −$2,835
- − Insurance
- −$945
- − Repairs & maintenance
- −$1,535
- − Management
- −$1,535
- − Depreciation
- −$5,498
- Taxable loss
- −$3,750
- Est. tax savings @ 24.0%
- +$900
- After-tax cash flow
- $382/yr
For passive investors: Depreciation is non-cash, so a rental often shows a tax loss while cash-flowing — sheltering income. Rental losses are passive: they offset passive income freely, and up to $25,000/yr can offset ordinary (W-2) income if you actively participate and your MAGI is under $100k (phasing out to $0 by $150k); unused losses carry forward. On sale, claimed depreciation is recaptured at up to 25%, and gains may owe capital-gains tax (a 1031 exchange can defer both). Figures are a year-1 estimate at your 24.0% rate — not tax advice; consult a CPA.
Schools (NCES district)
- District
- Harrison County School District
- NCES district ID
- 2801770
- Math proficiency
- 52% ▼ -4.00%
- Reading proficiency
- 46% ▼ -4.00%
- Median HH income
- $46,504
- Composite
- 41.66/100
- National rank
- #3419
- State rank
- #14 of 130 in MS
Livability — Gulfport
- Score
- 73/100
- State rank
- #15
- US rank
- #5010
Category grades
Schools grade is shown separately in the Schools card above.
Census & demographics
- Census place
- Gulfport, MS
- County
- Harrison County · 178,171 people
- City population
- 96,188
- Metro
- Gulfport-Biloxi, MS
- Population (ZIP)
- 55,059
- Household income
- $62,641
- Rent vs Own
- Severe rent burden
- 1686.0
Population outlook (Harrison County) Hauer SSP2
- Today (2025)
- 228,444 people
- By 2030
- 241,942 · +5.9%
- By 2040
- 267,531 · +17.1%
- By 2050
- 291,062 · +27.4%
- By 2075
- 346,711 · +51.8%
- By 2100
- 378,165 · +65.5%
Race, ethnicity, and origin ACS 2023
- Neighborhood character
- Diverse neighborhood (Simpson 0.58)
- Race & ethnicity
- White 58% Black 27% Two or more races 9% Hispanic / Latino 6% Asian 2%
- Hispanic origin (detail)
- Mexican 2% Puerto Rican 1%
- Common ancestry
- Lithuanian 5% Slovak 1% Portuguese 1%
- Foreign-born
- 3% · Canada
- Languages at home
- 95% English-only · Spanish 3%
Political lean MEDSL · Harrison
- 2024 margin
- Strong R (+28.9) · D 35.0% · R 63.9% · Other 1.1%
- 2008→2024 swing
- -2.9pp toward R · 2008: -26.0pp · 2024: -28.9pp
- All cycles
- 2024: R+28.9 2020: R+25.2 2016: R+30.7 2012: R+26.6 2008: R+26.0
Not yet ingested
- Civics
- —
Market trends
- HPI YoY
- ▼ -51.39%
- Current HPI
- 187.285
- Rent YoY
- ▲ 6.99%
- Metro
- Gulfport-Biloxi, MS
- State GDP YoY
- —
- F500 in state
- 0
Price history
-98.4% since first listed10 events — show timeline
- 2024-09-25 Rental Removed $2,000 SHOWMOJO
- 2024-09-21 Listed for Rent $2,000 SHOWMOJO
- 2024-09-16 Rental Removed $2,000 TURBOTENANT
- 2024-08-18 Listed for Rent $2,000 TURBOTENANT
- 2023-12-14 Listing Removed — MLSU
- 2023-07-28 Price Changed $169,500 MLSU
- 2023-06-13 Listed $176,000 MLSU
- 2018-08-06 Sold (MLS) — MLSU
- 2018-08-03 Sold (Public Records) $125,000 Public Records
- 2017-08-30 Listed $124,900 MLSU
Property tax history
-24.7%/yrLatest (2025): $69 · +0.2% YoY. Source: county tax records.
Cash-flow waterfall
monthlySold comps — $/sqft
last 12 mo · ≤1 miLoading sold comps…