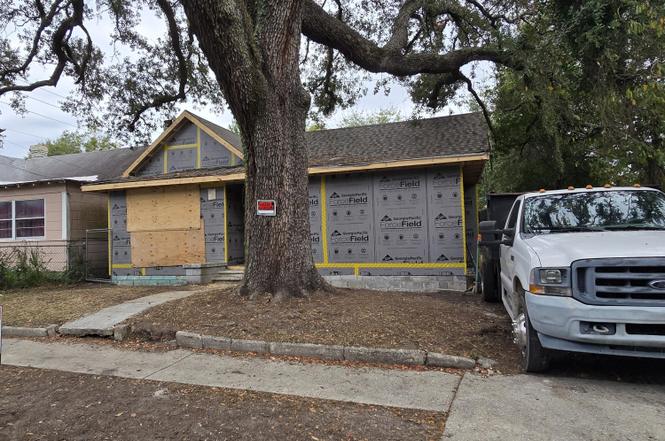
659 Parker St · Jacksonville, FL
Flood risk 5/10 · Moderate
- FEMA flood zone
- X (unshaded)
- Chance of flooding over 30 yrs
- 0.23%
- Est. flood insurance / yr
- $507 – $1,088
Fire risk 1/10 · Minimal
- Est. fire insurance / yr
- $947 – $1,759
Heat risk 9/10 · Severe
- Hot days now (above 106°F)
- 7 days/yr
- Hot days in 30 yrs
- 20 days/yr
Wind risk 9/10 · Severe
- Chance of severe wind over 30 yrs
- 99.0%
Air-quality risk 4/10 · Minor
- Unhealthy air days now
- 6 days/yr
- Unhealthy air days in 30 yrs
- 6 days/yr
Risk factors via First Street. Map © Google.
Why this score? — see what drove the B- grade
The composite is a weighted blend of 9 inputs, each scored 0–100. Each bar is that input's sub-score; the figure is the points it added to the 100-point composite (weight × sub-score).
- Cash flow +22.2/30.0
- ARV discount +15.0/15.0
- DSCR +7.1/10.0
- 1% rule +4.9/10.0
- Appreciation +4.5/10.0
- Livability +4.2/5.0
- Schools +3.9/10.0
- Condition / age +2.5/5.0
- Rent growth +1.7/5.0
$183,900
🖨 Deal sheet 📄 Offer letter ✓ Due diligence
Listing remarks MLS
Almost completely remodeled (remodeling in progress), large 5 bedroom 2 bath home great for investor/landlord. SQ FT is approx. Buyer to verify. Seller financing available. See private remarks for other properties owned by this seller. (possible bulk sale)
Key facts
- Central location
- 4,791 sq ft lot
- Built 1914
Tags
Property features AI
Finance
- Other: Lot approximately 0.11 acres
- HOA & community: Not a senior community
Exterior
- Parking: On-street parking
- Utilities: Public sewer; Electricity available; Sewer available; Water available
- Home design: Single family residence; One level; Entry level: 1; Faces west; Current use includes commercial, mixed use, office, residential, and single family
- Construction: Frame construction; Shingle roof
- Exterior features: City street frontage; Asphalt road surface
Interior
- Kitchen: No kitchen appliances listed
- Bedrooms: 5 bedrooms
- Bathrooms: 2 full bathrooms
- Heating & cooling: No heating; No cooling
- Interior features: Fireplace (other type); No built-in appliances listed
- Laundry & utility: Unfurnished (unit information)
Neighborhood map
What this means for you Summary
Snapshot
- This is a 3-bed/1.0-bath single-family listed at $184k.
Deal economics
- At list price, monthly cash flow is $301 ($4k/yr) — positive.
- The deal already cash-flows at list — no discount required.
- To meet the 1% rule (rent ≥ 1% of price), the offer needs to be $182k (1.2% below list).
- Recommended offer: $162k (12.0% below list) — sets the bar for market timing.
- Cap rate 8.3% vs local median 4.0% in Jacksonville — top-decile yield for the area; either an underpriced asset or a hidden risk that comps aren't pricing in. Stress-test before assuming the spread holds.
Location & tenants
- Location reads 83/100 on livability (#50 in FL, #911 nationally) — a professional / high-income tenant draw. Strengths: amenities A+, commute A+, housing A+.
- Duval (urban): math 46% / reading 45% proficiency, ranked #48 of 73 in FL (top 66%) — families likely to look elsewhere, expect single-tenant / working-renter base with shorter leases.
- Market conditions: Rents falling (-3.0%/yr); 35 active listings in the ZIP; 35 comparable units currently listed for rent nearby; rentals at typical pace (median 15d on market — plan ~3-4 weeks tenant-placement turnaround); lower-income renter base — watch delinquency; 6,503 units permitted in Duval County in 2024 (1,131 in 5+ unit buildings).
- At $1,817/mo this rent would consume 63% of the median local household income ($35k/yr) (locally 461% of renters already pay >50% of income on rent) — very limited rent-growth headroom before tenants either downsize or default.
Forward outlook
- Local home prices are declining (-0.9%/yr); year-one equity from $1k of loan paydown is wiped out by about $2k of value loss. Plan a longer hold.
- Duval County population projected at +19% by 2050 — long-run rental-demand tailwind backs the buy-and-hold thesis.
Negotiation context
- It's been on market 164 days — a 12% lower offer ($162k) is reasonable based on typical stale-listing flexibility.
- 3 sale attempts since 18y ago with the ask held roughly flat each time — persistent listings suggest the price (not the market) is what's stuck; bring a comps-based counter.
- Current owner paid $46k; list at $184k implies a 300% gain — meaningful room to come down on a strong offer.
Risks & watch-outs
- Watch-outs: built in 1914 — expect roof / HVAC / electrical / plumbing capex.
- Climate carrying-cost: moderate flood risk; severe wind risk, 99% chance of damaging wind over 30y; extreme-heat days projected 7→20/yr by 2055 (HVAC capex compounding) — expect insurance premiums to compound above CPI over the hold.
Questions for the listing agent
- It's been on market 164 days. Have you received any prior offers? Is the seller open to a 12% concession, seller financing, or rate buy-down credit?
- Built in 1914 — when were the roof, HVAC, electrical panel, plumbing, and water heater last replaced?
- Why hasn't it sold? Are there any deal-killer items the seller is aware of (foundation, flood, title, zoning, code violations)?
- Is there a deadline driving the sale (1031 exchange, divorce, estate, relocation)? That informs how much negotiation room exists.
- Schools are B-rated — typically a magnet for longer-tenancy family renters. What's the average tenant stay here, and is there a school-zone premium baked into asking?
- What's the average days-on-market for RENTAL listings here right now (not sales)? A rising rental-DOM trend means longer vacancies and softer asking-rent achievability than the comps imply.
- What's the recent tenant-quality profile in this submarket — average credit score on applications, eviction rate, late-payment / NSF rate, and stable-employment percentage? A property-management company in the area should have these aggregated.
- How much new for-sale + rental construction is in the pipeline within 1–3 miles? Heavy new supply typically softens prices + rents 12–24 months out; constrained supply supports both.
Investment metrics
- 1% rule
- 0.99% ✗
- Cap rate
- 8.26%
- Cash-on-cash
- 7.02%
- DSCR
- 1.31
- GRM
- 8.4
CMA / ARV
- ARV (on-the-fly)
- $222,508
- Comps found
- 3
Show comp detail 3 sales within ~0.75 mi
| Address | Dist | Beds/Ba | Sqft | Sold | Price | $/sf | Match |
|---|---|---|---|---|---|---|---|
| 1245 Swift St | 0.29mi | 3/2.0 | 1,436 (-8%) | 6mo | $205,017 | $143 | 64 |
| 1053 E Union St | 0.51mi | 3/2.5 | 1,500 (-4%) | 15mo | $210,000 | $140 | 52 |
| 1219 Milnor St | 0.72mi | 3/2.5 | 1,668 (+7%) | 6mo | $345,000 | $207 | 43 |
Match score weights: distance 35% · size 25% · config 20% · recency 20%. Top-matched comps best support the ARV.
Projected returns pro-forma
-0.95% appreciation · 0.0% rent growth · sell at horizon
- IRR
- 0.1%
- Equity multiple
- 1.01×
- Total profit
- $329
- Equity at exit
- $44,800
- IRR
- 4.3%
- Equity multiple
- 1.38×
- Total profit
- $19,544
- Equity at exit
- $47,392
Cash invested: $51,492 (down + closing). Projections, not guarantees.
Landlord ↔ Tenant lean methodology
- Overall (STATE)
- 87 Strongly Landlord-Friendly
- State Florida
- 87 Strongly Landlord-Friendly · R+3
- County
- — inherits STATE
- City
- — inherits STATE
ZIP-level market 32202
- Home prices YoY
- -1.7%
- Rents YoY
- -3.0%
- Active inventory
- 35
- Price-to-rent
- 8.4×
Monthly cashflow live
- Estimated rent
- $1,817 high interval (Pro) →
- Mortgage (P&I)
- −$964
- Tax from tax record
- −$93 /mo · $1,119/yr
- Insurance
- −$77
- HOA
- −$0
- Vacancy / Maint / Mgmt
- −$382
- Net cashflow
- $301
Break-even live
UW: 25.0% down · 7.5% · 30yr · 1.5% tax · 5.0% vac · 8.0% maint · 8.0% mgmt
Financing live
Cash to close
- Down payment
- $45,975
- Closing costs
- $5,517
- Reserves months
- —
- Total cash needed
- —
Loan-product check · same deal, 3 products live
Conventional
25% down · 7.5% · 30yr
- Down + closing
- —
- Monthly P&I
- —
- Monthly cashflow
- —
- DSCR
- —
- Eligible?
- —
Personal DTI + credit; lowest rate.
DSCR
20% down · 8.5% · 30yr
- Down + closing
- —
- Monthly P&I
- —
- Monthly cashflow
- —
- DSCR
- —
- Eligible?
- —
No personal income docs; deal must DSCR.
Hard money
10% down · 12.0% · 12mo
- Down + closing
- —
- Monthly P&I
- —
- Monthly cashflow
- —
- DSCR
- —
- Eligible?
- —
Short-term bridge; refi at stabilization.
Rent comps 35 comps
| Address | Beds | Baths | Sqft | Rent | $/sqft | DOM | Units | Dist |
|---|---|---|---|---|---|---|---|---|
| 1131 Phelps St Jacksonville, FL | 3.0 | 1.0 | 1120 | $895 | $0.80 | 23d | 1 | 0.57mi |
| 1109 Phelps St Jacksonville, FL | 3.0 | 1.0 | 1120 | $850 | $0.76 | 7d | 1 | 0.60mi |
| 1143 Van Buren St Jacksonville, FL | 3.0 | 2.0 | 1230 | $1,421 | $1.16 | 16d | 1 | 0.75mi |
| 960 E Adams St Jacksonville, FL | 2.0 | 1.0–2.5 | 857 | $3,338 | $3.89 | 2d | 125 | 0.76mi |
| 700 E Union St Jacksonville, FL | 1.0–3.0 | 1.0–2.0 | 1070 | $3,185 | $2.98 | 4d | 63 | 0.84mi |
| 1130 Spearing St Jacksonville, FL | 3.0 | 1.0 | 1320 | $1,400 | $1.06 | 20d | 1 | 0.88mi |
| 720 E 3rd St Jacksonville, FL | 3.0 | 1.0 | 1076 | $1,075 | $1.00 | 23d | 1 | 0.90mi |
| 1115 E 5th St Jacksonville, FL | 3.0 | 2.0 | 1175 | $1,450 | $1.23 | 23d | 1 | 1.02mi |
| 1715 Brackland St Jacksonville, FL | 4.0 | 2.0 | 1175 | $1,425 | $1.21 | 14d | 1 | 1.05mi |
| 1726 Buckman St Jacksonville, FL | 2.0 | 1.0 | 1166 | $1,075 | $0.92 | 7d | 1 | 1.07mi |
| 1153 Walnut St #4 Jacksonville, FL | 3.0 | 1.0 | 1170 | $1,195 | $1.02 | 11d | 1 | 1.08mi |
| 1153 Walnut St #4 Jacksonville, FL | 3.0 | 1.0 | 1170 | $1,195 | $1.02 | 4d | 1 | 1.08mi |
| 706 E 5th St Jacksonville, FL | 3.0 | 2.5 | 1284 | $1,436 | $1.12 | 23d | 1 | 1.09mi |
| 340 E Ashley St Jacksonville, FL | 2.0 | 2.5 | 1530 | $1,695 | $1.11 | 23d | 1 | 1.13mi |
| 343 E Church St Jacksonville, FL | 3.0 | 3.5 | 1530 | $2,195 | $1.43 | 3d | 1 | 1.14mi |
| 1529 Spearing St Jacksonville, FL | 3.0 | 2.0 | 1077 | $1,425 | $1.32 | 4d | 1 | 1.14mi |
| 1445 Ionia St Jacksonville, FL | 4.0 | 2.0 | 1640 | $1,799 | $1.10 | 23d | 1 | 1.15mi |
| 2056 Prudential Dr Jacksonville, FL | 3.0 | 3.5 | 2144 | $6,495 | $3.03 | 14d | 1 | 1.20mi |
| 2054 Prudential Dr Jacksonville, FL | 3.0 | 3.5 | 1990 | $6,000 | $3.02 | 13d | 1 | 1.20mi |
| 440 E 6th St Jacksonville, FL | 3.0 | 2.0 | 1968 | $2,100 | $1.07 | 23d | 1 | 1.24mi |
| 1928 Prudential Dr Jacksonville, FL | 3.0 | 3.5 | 1745 | $3,350 | $1.92 | 23d | 1 | 1.29mi |
| 138 E Duval St Jacksonville, FL | 3.0 | 1.5 | 1450 | $3,200 | $2.21 | 23d | 1 | 1.31mi |
| 122 E Duval St Jacksonville, FL | 2.0 | 2.5 | 1750 | $2,250 | $1.29 | 23d | 1 | 1.33mi |
| 424 Walnut Ct Jacksonville, FL | 3.0 | 2.0 | 1530 | $1,688 | $1.10 | 14d | 1 | 1.36mi |
| 424 Walnut Ct Jacksonville, FL | 3.0 | 2.0 | 1530 | $1,688 | $1.10 | 14d | 1 | 1.36mi |
| 1655 Prudential Dr Jacksonville, FL | 3.0 | 1.0–3.0 | 1113 | $3,314 | $2.98 | 2d | 13 | 1.38mi |
| 1052 E 10th St Jacksonville, FL | 3.0 | 2.0 | 1726 | $1,725 | $1.00 | 23d | 1 | 1.39mi |
| 1438 Magnolia Cir W Jacksonville, FL | 3.0 | 1.0 | 1304 | $1,425 | $1.09 | 23d | 1 | 1.45mi |
| 1148 N Main St Jacksonville, FL | 2.0 | 1.0–2.0 | 931 | $2,195 | $2.36 | 1d | 23 | 1.46mi |
| 1377 Tiber Ave Jacksonville, FL | 3.0 | 2.0 | 1304 | $2,200 | $1.69 | 13d | 1 | 1.46mi |
| 1431 Riverplace Blvd Jacksonville, FL | 2.0 | 2.0–2.5 | 1632 | $3,650 | $2.24 | 17d | 3 | 1.48mi |
| 1431 Riverplace Blvd Jacksonville, FL | 2.0 | 2.0–2.5 | 1632 | $3,725 | $2.28 | 14d | 2 | 1.48mi |
| 944 Broadcast Pl Jacksonville, FL | 1.0–2.0 | 1.0–2.0 | 970 | $2,799 | $2.89 | 2d | 40 | 1.48mi |
| 5350 Arlington Expy Jacksonville, FL | 3.0 | 1.0–2.0 | 1137 | $1,689 | $1.48 | 3d | 43 | 1.50mi |
| 1401 Riverplace Blvd Jacksonville, FL | 1.0–3.0 | 1.0–2.0 | 1401 | $4,424 | $3.16 | 4d | 9 | 1.50mi |
Listing history 9 events
-
2026-05-31days on market $183,900 Active 164 DOM
-
2026-04-14status Active
-
2026-04-04historical
-
2026-01-03price $183,900
-
2025-12-04$179,900 Active
-
2010-01-05historical 257-char remark
Show marketing remark (257 chars)
Almost completely remodeled (remodeling in progress), large 5 bedroom 2 bath home great for investor/landlord. SQ FT is approx. Buyer to verify. Seller financing available. See private remarks for other properties owned by this seller. (possible bulk sale)
-
2008-06-29$35,000 257-char remark
Show marketing remark (257 chars)
Almost completely remodeled (remodeling in progress), large 5 bedroom 2 bath home great for investor/landlord. SQ FT is approx. Buyer to verify. Seller financing available. See private remarks for other properties owned by this seller. (possible bulk sale)
-
2007-05-30soldstatus $46,000
-
1986-10-01soldstatus $27,500
ⓘ Source: listings_history table (triggers on properties + properties_extension) + one-shot
backfill from property_details.listing_events for pre-trigger history.
Tax reassessment forecast FL · Resets to sale price
- Current annual tax
- $1,119 · $93/mo
- Projected year-2 tax
- $1,526 · $127/mo
- Expected delta
- +$407/yr (+$34/mo · 36.4%)
ⓘ Screening estimate from a state-policy table — verify with the county assessor before closing.
Climate risk First Street
- Flood 5/10 Major FEMA zone X (unshaded) · 23% chance over 30 yrs
- Wildfire 1/10 Low
- Heat 9/10 Extreme 7 d/yr ≥106°F today · 20 d/yr by 30 yrs out
- Wind 9/10 Extreme 99% chance of damaging wind over 30 yrs
- Air quality 4/10 Moderate 6 unhealthy d/yr today · 6 by 30 yrs out
Nearby sold comps map
Loading sold comps map…
Walkable amenities ~0.75 mi
Loading nearby amenities…
Taxation est. · year 1
- Rental income
- $21,802
- − Mortgage interest
- −$10,301
- − Property taxes
- −$1,119
- − Insurance
- −$920
- − Repairs & maintenance
- −$1,744
- − Management
- −$1,744
- − Depreciation
- −$5,350
- Taxable income
- $624
- Est. tax owed @ 24.0%
- −$150
- After-tax cash flow
- $3,463/yr
For passive investors: Depreciation is non-cash, so a rental often shows a tax loss while cash-flowing — sheltering income. Rental losses are passive: they offset passive income freely, and up to $25,000/yr can offset ordinary (W-2) income if you actively participate and your MAGI is under $100k (phasing out to $0 by $150k); unused losses carry forward. On sale, claimed depreciation is recaptured at up to 25%, and gains may owe capital-gains tax (a 1031 exchange can defer both). Figures are a year-1 estimate at your 24.0% rate — not tax advice; consult a CPA.
Schools (NCES district)
- District
- Duval
- NCES district ID
- 1200480
- Math proficiency
- 46% ▼ -11.00%
- Reading proficiency
- 45% ▼ -4.00%
- Median HH income
- $48,987
- Composite
- 38.97/100
- National rank
- #4076
- State rank
- #48 of 73 in FL
Livability — Jacksonville
- Score
- 83/100
- State rank
- #50
- US rank
- #911
Category grades
Schools grade is shown separately in the Schools card above.
Census & demographics
- Census place
- Jacksonville, FL
- County
- Duval County · 1,015,274 people
- City population
- 979,034
- Metro
- Jacksonville, FL
- Population (ZIP)
- 6,023
- Household income
- $34,825
- Rent vs Own
- Severe rent burden
- 461.0
Population outlook (Duval County) Hauer SSP2
- Today (2025)
- 1,013,010 people
- By 2030
- 1,059,228 · +4.6%
- By 2040
- 1,141,439 · +12.7%
- By 2050
- 1,205,258 · +19.0%
- By 2075
- 1,324,282 · +30.7%
- By 2100
- 1,319,620 · +30.3%
Race, ethnicity, and origin ACS 2023
- Neighborhood character
- Diverse neighborhood (Simpson 0.59)
- Race & ethnicity
- Black 49% White 41% Two or more races 7% Hispanic / Latino 6%
- Hispanic origin (detail)
- Mexican 1% Puerto Rican 2% Cuban 1%
- Common ancestry
- Lithuanian 2% Italian 1% Iranian 1%
- Foreign-born
- 4% · Canada
- Languages at home
- 93% English-only · Spanish 5% Other Indo-European 1% German/W. Germanic 1%
Political lean MEDSL · Duval
- 2024 margin
- Toss-up / Even · D 48.7% · R 50.1% · Other 1.2%
- 2008→2024 swing
- +0.4pp no change · 2008: -1.9pp · 2024: -1.5pp
- All cycles
- 2024: R+1.5 2020: D+3.8 2016: R+1.5 2012: R+3.6 2008: R+1.9
Not yet ingested
- Civics
- —
Market trends
- HPI YoY
- ▼ -0.95%
- Current HPI
- 55.4429
- Rent YoY
- ▼ -3.04%
- Metro
- Jacksonville, FL
- State GDP YoY
- ▲ 3.28%
- F500 in state
- 36
Industry mix (Fortune 500 HQ in FL)
| Industry | F500 HQs | Revenue |
|---|---|---|
| Industrial Technology | 2 | $29B |
|
||
| Insurance | 2 | $17B |
|
||
| Retail | 1 | $60B |
|
||
| Technology Distribution | 1 | $58B |
|
||
| Homebuilding | 1 | $35B |
|
||
| Technology Manufacturing | 1 | $35B |
|
||
Price history
+568.7% since first listed8 events — show timeline
- 2026-04-14 Relisted — realMLS
- 2026-04-04 Listing Removed — realMLS
- 2026-01-03 Price Changed $183,900 realMLS
- 2025-12-04 Listed $179,900 realMLS
- 2010-01-05 Listing Removed — realMLS
- 2008-06-29 Listed $35,000 realMLS
- 2007-05-30 Sold (Public Records) $46,000 Public Records
- 1986-10-01 Sold (Public Records) $27,500 Public Records
Property tax history
+3.9%/yrLatest (2025): $1,119 · +235.5% YoY. Source: county tax records.
Cash-flow waterfall
monthlySold comps — $/sqft
last 12 mo · ≤1 miLoading sold comps…