 Multi-family
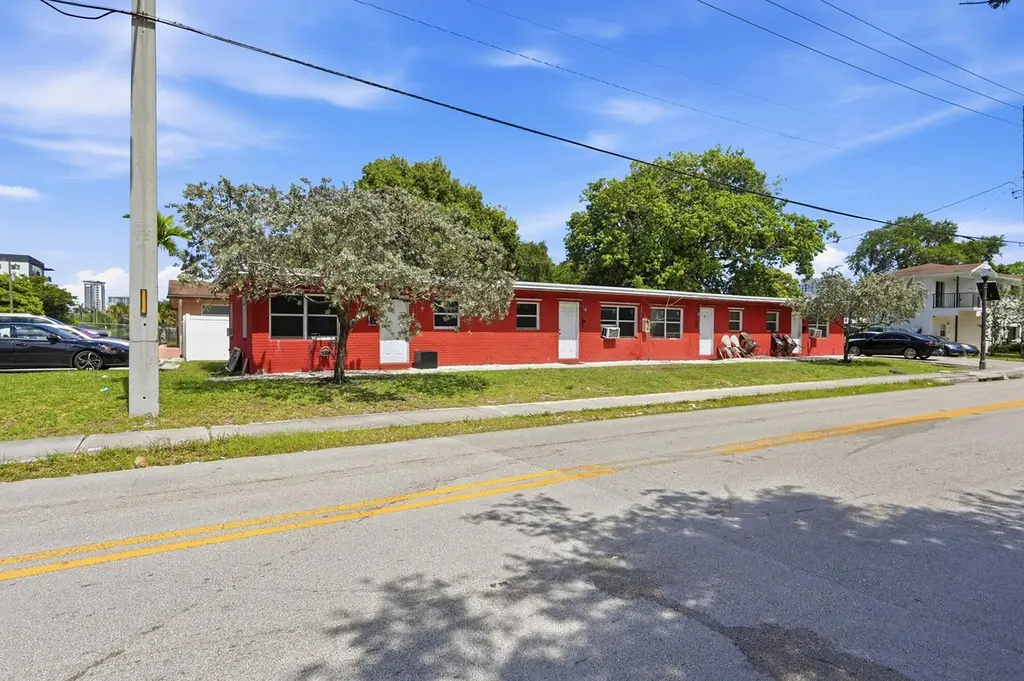
840 NW 3rd St Unit 1-4 · Fort Lauderdale, FL
Flood risk 4/10 · Minor
- FEMA flood zone
- X (shaded)
- Chance of flooding over 30 yrs
- 0.23%
- Est. flood insurance / yr
- $507 – $1,088
Fire risk 1/10 · Minimal
- Est. fire insurance / yr
- $947 – $1,759
Heat risk 10/10 · Severe
- Hot days now (above 105°F)
- 7 days/yr
- Hot days in 30 yrs
- 26 days/yr
Wind risk 10/10 · Severe
- Chance of severe wind over 30 yrs
- 99.0%
Air-quality risk 2/10 · Minimal
- Unhealthy air days now
- 2 days/yr
- Unhealthy air days in 30 yrs
- 2 days/yr
Risk factors via First Street. Map © Google.
Why this score? — see what drove the C grade
The composite is a weighted blend of 9 inputs, each scored 0–100. Each bar is that input's sub-score; the figure is the points it added to the 100-point composite (weight × sub-score).
- Cash flow +23.1/30.0
- ARV discount +7.5/15.0
- DSCR +7.4/10.0
- 1% rule +6.2/10.0
- Schools +4.1/10.0
- Livability +4.1/5.0
- Rent growth +3.2/5.0
- Condition / age +2.5/5.0
- Appreciation +0.0/10.0
$699,000
🖨 Deal sheet (PDF) 📄 Offer letter ✓ Due diligence
Multi-family units
County records classify this as Multi-Family (2-4 Unit). Listing-text estimate: 1 unit. estimate disagrees with records
Listing remarks
Prime multifamily quadraplex investment opportunity in the rapidly growing Progresso Village neighborhood of Fort Lauderdale. This four-unit property features four 2-bedroom, 1-bathroom units in a great location. Minutes from Downtown Fort Lauderdale, FAT Village, Holiday Park, Las Olas Boulevard, Brightline, and Fort Lauderdale Beach, the property is positioned to benefit from the area's continued growth and redevelopment.
Key facts
- 7,500 sq ft lot
- Built 1958
- Listed 20 days
Tags
Property features AI
Finance
- Other: Land is not leased
- Financial info: 4 total units; 4 units in the community; Tenants pay electricity; Pets allowed with no restrictions
Exterior
- Utilities: Public water; Public sewer / Sewer connected; Cable available; Phone available; Water available; Electricity not available; 4 separate electric meters
- Home design: Quadruplex; One story; Entry level: One
- Construction: Brick construction; Shingle roof; Building area approx. 2,090 (source: appraiser); Total stories: 1
- Exterior features: Corner lot; Not waterfront
Interior
- Flooring: Other flooring
- Heating & cooling: Window/wall heating; Wall/window cooling units
- Interior features: Jalousie windows; Other flooring
Neighborhood map
What this means for you Summary
Snapshot
- This is a ?-bed/4.0-bath multifamily listed at $699k.
Deal economics
- At list price, monthly cash flow is $1k ($15k/yr) — positive.
- The deal already cash-flows at list — no discount required.
- Meets the 1% rule at list price ($8k rent vs $699k).
- Recommended offer: $689k (1.5% below list) — sets the bar for market timing.
- Cap rate 8.4% vs local median 2.2% in Fort Lauderdale — top-decile yield for the area; either an underpriced asset or a hidden risk that comps aren't pricing in. Stress-test before assuming the spread holds.
Location & tenants
- Location reads 82/100 on livability (#78 in FL, #1,293 nationally) — a professional / high-income tenant draw. Strengths: crime A+, amenities A+, health & safety A+; Watch: cost of living D-.
- Broward (suburban): math 42% / reading 53% proficiency, ranked #46 of 73 in FL (top 63%) — families likely to look elsewhere, expect single-tenant / working-renter base with shorter leases.
- Zoned schools: Walker Elementary School (math 17% / reading 18%, grade F, #2,117 of 2,144 statewide, top 99%, 539 students, 92% FRL); Parkway Middle School (math 25% / reading 40%, grade F, #443 of 571 statewide, top 78%, 1,198 students, 83% FRL); Stranahan High School (math 18% / reading 36%, grade F, #478 of 667 statewide, top 73%, 1,438 students, 77% FRL) — zoned schools average 84% FRL vs 51% district-wide (33 pts higher); higher-poverty schools than district average — tighter screening recommended.
- Zoned-school proficiency averages 26% at this address vs 48% district-wide (-22 pts) — the specific schools serving this property underperform the Broward average; the district grade overstates school quality for this exact location.
- Market conditions: Rents rising (+2.8%/yr); 585 active listings in the ZIP; 40 comparable units currently listed for rent nearby; rentals at typical pace (median 15d on market — plan ~3-4 weeks tenant-placement turnaround); 2,111 units permitted in Broward County in 2024 (1,265 in 5+ unit buildings).
- At $7,828/mo this rent would consume 174% of the median local household income ($54k/yr) (locally 5068% of renters already pay >50% of income on rent) — very limited rent-growth headroom before tenants either downsize or default.
Forward outlook
- Local home prices are declining (-3.0%/yr); year-one equity from $5k of loan paydown is wiped out by about $21k of value loss. Plan a longer hold.
- Broward County population projected at +34% by 2050 — long-run rental-demand tailwind backs the buy-and-hold thesis.
Negotiation context
- It's been on market 21 days — a 2% lower offer ($689k) is reasonable based on typical stale-listing flexibility.
- Current owner paid $61k; list at $699k implies a 1046% gain — meaningful room to come down on a strong offer.
Risks & watch-outs
- Watch-outs: built in 1958 — expect roof / HVAC / electrical / plumbing capex.
- Climate carrying-cost: severe wind risk, 99% chance of damaging wind over 30y; extreme-heat days projected 7→26/yr by 2055 (HVAC capex compounding) — expect insurance premiums to compound above CPI over the hold.
Questions for the listing agent
- Built in 1958 — when were the roof, HVAC, electrical panel, plumbing, and water heater last replaced?
- Is there a deadline driving the sale (1031 exchange, divorce, estate, relocation)? That informs how much negotiation room exists.
- Schools are B-rated — typically a magnet for longer-tenancy family renters. What's the average tenant stay here, and is there a school-zone premium baked into asking?
- What's the average days-on-market for RENTAL listings here right now (not sales)? A rising rental-DOM trend means longer vacancies and softer asking-rent achievability than the comps imply.
- What's the recent tenant-quality profile in this submarket — average credit score on applications, eviction rate, late-payment / NSF rate, and stable-employment percentage? A property-management company in the area should have these aggregated.
- How much new apartment / multifamily construction is in the pipeline within 1–3 miles? Heavy new supply (>2% of stock underway) typically softens rents 12–24 months out; light construction supports rent growth.
Investment metrics
- 1% rule
- 1.12% ✓
- Cap rate
- 8.44%
- Cash-on-cash
- 7.65%
- DSCR
- 1.34
- GRM
- 7.4
CMA / ARV
No comps found within radius.
Projected returns pro-forma
-3.0% appreciation · 2.78% rent growth · sell at horizon
- IRR
- -4.8%
- Equity multiple
- 0.82×
- Total profit
- $-35,312
- Equity at exit
- $104,223
- IRR
- 4.6%
- Equity multiple
- 1.33×
- Total profit
- $65,302
- Equity at exit
- $60,437
Cash invested: $195,720 (down + closing). Projections, not guarantees.
Landlord ↔ Tenant lean methodology
- Overall (STATE)
- 87 Strongly Landlord-Friendly
- State Florida
- 87 Strongly Landlord-Friendly · R+3
- County
- — inherits STATE
- City
- — inherits STATE
ZIP-level market 33311
- Rents YoY
- 2.8%
- Active inventory
- 585
- Price-to-rent
- 29.8×
Monthly cashflow live
- Estimated rent
- $7,828 high interval (Pro) →
- Mortgage (P&I)
- −$3,666
- Tax from tax record
- −$979 /mo · $11,748/yr
- Insurance
- −$291
- HOA
- −$0
- Vacancy / Maint / Mgmt
- −$1,644
- Net cashflow
- $1,248
Break-even live
Sensitivity live
| Price | -10% $1,644 | -5% $1,446 | +0% $1,248 | +5% $1,050 | +10% $853 |
|---|---|---|---|---|---|
| Rent | -10% $630 | -5% $939 | +0% $1,248 | +5% $1,557 | +10% $1,867 |
| Rate | -1.0pp $1,600 | -0.5pp $1,426 | base $1,248 | +0.5pp $1,067 | +1.0pp $883 |
4-unit breakdown (identical units grouped — click to expand)
| Units | Beds | Baths | Est. rent |
|---|---|---|---|
| 4× units | 2 | 1 | $7,828 |
| #1 | 2 | 1 | $1,957 |
| #2 | 2 | 1 | $1,957 |
| #3 | 2 | 1 | $1,957 |
| #4 | 2 | 1 | $1,957 |
| Total (4 units) | $7,828 | ||
UW: 25.0% down · 7.5% · 30yr · 1.5% tax · 5.0% vac · 8.0% maint · 8.0% mgmt
Financing live
Cash to close
- Down payment
- $174,750
- Closing costs
- $20,970
- Reserves months
- —
- Total cash needed
- —
Loan-product check · same deal, 3 products live
Conventional
25% down · 7.5% · 30yr
- Down + closing
- —
- Monthly P&I
- —
- Monthly cashflow
- —
- DSCR
- —
- Eligible?
- —
Personal DTI + credit; lowest rate.
DSCR
20% down · 8.5% · 30yr
- Down + closing
- —
- Monthly P&I
- —
- Monthly cashflow
- —
- DSCR
- —
- Eligible?
- —
No personal income docs; deal must DSCR.
Hard money
10% down · 12.0% · 12mo
- Down + closing
- —
- Monthly P&I
- —
- Monthly cashflow
- —
- DSCR
- —
- Eligible?
- —
Short-term bridge; refi at stabilization.
Rent comps 40 comps
| Address | Beds | Baths | Sqft | Rent | $/sqft | DOM | Units | Dist |
|---|---|---|---|---|---|---|---|---|
| 932 NW 2nd St Fort Lauderdale, FL | 3.0 | 2.5 | 1850 | $3,500 | $1.89 | 2d | 1 | 0.14mi |
| 1015 W Las Olas Blvd Unit 3 Fort Lauderdale, FL | 1.0 | 1.0 | 2277 | $1,700 | $0.75 | 25d | 1 | 0.44mi |
| 1021 W Las Olas Blvd Unit 3 Fort Lauderdale, FL | 2.0 | 1.0 | 2450 | $2,200 | $0.90 | 25d | 1 | 0.44mi |
| 631 NW 11th Ave Unit B Fort Lauderdale, FL | 2.0 | 1.0 | 2116 | $1,850 | $0.87 | 8d | 1 | 0.45mi |
| 631 NW 11th Ave Unit B Fort Lauderdale, FL | 2.0 | 1.0 | 2116 | $1,850 | $0.87 | 25d | 1 | 0.45mi |
| 1216 NW 6th Ct Unit 2 Fort Lauderdale, FL | 1.0 | 1.0 | 2400 | $1,600 | $0.67 | 5d | 1 | 0.47mi |
| 1213 W Las Olas Blvd Fort Lauderdale, FL | 3.0 | 2.5 | 2400 | $5,000 | $2.08 | 25d | 1 | 0.52mi |
| 411 NW 1st Ave Fort Lauderdale, FL | 2.0 | 2.0 | 1655 | $4,800 | $2.90 | 25d | 2 | 0.52mi |
| 1215 W Las Olas Blvd Unit 1215 Fort Lauderdale, FL | 3.0 | 2.5 | 2400 | $5,000 | $2.08 | 25d | 1 | 0.53mi |
| 623 NW 3rd Ave Unit 1 Fort Lauderdale, FL | 3.0 | 2.0 | 2369 | $2,100 | $0.89 | 11d | 1 | 0.53mi |
| 623 NW 3rd Ave Unit 1 Fort Lauderdale, FL | 3.0 | 2.0 | 2369 | $2,100 | $0.89 | 2d | 1 | 0.53mi |
| 1228 W Las Olas Blvd Unit 1228 Fort Lauderdale, FL | 2.0 | 2.5 | 1615 | $2,900 | $1.80 | 21d | 1 | 0.56mi |
| 647 NW 3rd Ave #1 Fort Lauderdale, FL | 2.0 | 1.0 | 2299 | $1,875 | $0.82 | 11d | 1 | 0.57mi |
| 1406 SW 1st St Unit A Fort Lauderdale, FL | 3.0 | 2.0 | 2080 | $2,595 | $1.25 | 3d | 1 | 0.57mi |
| 1213 Tequesta St Fort Lauderdale, FL | 3.0 | 3.0 | 1694 | $3,550 | $2.10 | 21d | 1 | 0.58mi |
| 445 N Andrews Ave Unit 4 Fort Lauderdale, FL | 2.0 | 2.0 | 1863 | $6,000 | $3.22 | 6d | 1 | 0.59mi |
| 728 NW 4th Ave #4 Fort Lauderdale, FL | 2.0 | 1.0 | 2811 | $1,650 | $0.59 | 25d | 1 | 0.61mi |
| 221 SW 1st Ave Fort Lauderdale, FL | 3.0 | 1.0–4.0 | 922 | $4,114 | $4.46 | 2d | 43 | 0.63mi |
| 1336 SW 3rd Ct #1336 Fort Lauderdale, FL | 2.0 | 2.5 | 1679 | $3,000 | $1.79 | 25d | 1 | 0.64mi |
| 600 SW 8th Ter Fort Lauderdale, FL | 3.0 | 3.0 | 2400 | $12,000 | $5.00 | 25d | 1 | 0.68mi |
| 630 NW 15th Ter Unit 1-2 Fort Lauderdale, FL | 2.0 | 1.0 | 1488 | $2,000 | $1.34 | 25d | 1 | 0.70mi |
| 645 NW 15th Ave Unit 2 Fort Lauderdale, FL | 2.0 | 1.0 | 2252 | $1,900 | $0.84 | 22d | 1 | 0.70mi |
| 645 NW 15th Ave Unit 1 Fort Lauderdale, FL | 2.0 | 1.0 | 2252 | $1,900 | $0.84 | 2d | 1 | 0.70mi |
| 645 NW 15th Ave Unit 2 Fort Lauderdale, FL | 2.0 | 1.0 | 2252 | $1,800 | $0.80 | 2d | 1 | 0.70mi |
| 645 NW 15th Ave Unit 1 Fort Lauderdale, FL | 2.0 | 1.0 | 2252 | $2,000 | $0.89 | 22d | 1 | 0.70mi |
| 401 SW 1st Ave Fort Lauderdale, FL | 1.0–3.0 | 1.0–3.5 | 1311 | $4,332 | $3.30 | 2d | 37 | 0.71mi |
| 120 NE 4th St Fort Lauderdale, FL | 1.0–2.0 | 1.0–2.0 | 1061 | $4,109 | $3.87 | 2d | 44 | 0.72mi |
| 504 SW 4th Ave Fort Lauderdale, FL | 3.0 | 3.5 | 2170 | $4,160 | $1.92 | 25d | 1 | 0.73mi |
| 504 SW 4th Ave Fort Lauderdale, FL | 3.0 | 3.5 | 2170 | $3,960 | $1.82 | 14d | 1 | 0.73mi |
| 477 SW 1st Ave Fort Lauderdale, FL | 3.0 | 1.0–3.0 | 1512 | $10,509 | $6.95 | 3d | 149 | 0.76mi |
| 533 NE 3rd Ave Fort Lauderdale, FL | 1.0–3.0 | 1.0–2.0 | 1053 | $3,525 | $3.35 | 3d | 7 | 0.78mi |
| 533 NE 3rd Ave Fort Lauderdale, FL | 1.0–3.0 | 1.0–2.0 | 1053 | $3,525 | $3.35 | 2d | 7 | 0.78mi |
| 844 NW 3rd Ave Unit B Fort Lauderdale, FL | 3.0 | 2.0 | 2368 | $2,400 | $1.01 | 25d | 1 | 0.78mi |
| 400 SW 1st Ave Fort Lauderdale, FL | 3.0 | 1.0–3.0 | 1336 | $4,463 | $3.34 | 2d | 33 | 0.78mi |
| 836 NW 2nd Ave Unit 1 Fort Lauderdale, FL | 1.0 | 1.0 | 2739 | $1,425 | $0.52 | 25d | 1 | 0.80mi |
| 313 NE 2nd St Fort Lauderdale, FL | 1.0 | 1.0–1.5 | 1083 | $2,750 | $2.54 | 3d | 2 | 0.82mi |
| 400 NE 3rd Ave Fort Lauderdale, FL | 1.0–3.0 | 1.0–3.0 | 1211 | $3,470 | $2.86 | 2d | 28 | 0.83mi |
| 220 SE 2nd St Fort Lauderdale, FL | 3.0 | 1.0–2.0 | 1005 | $4,443 | $4.42 | 2d | 38 | 0.83mi |
| 100 E Las Olas Blvd Fort Lauderdale, FL | 2.0–3.0 | 2.5 | 1899 | $7,500 | $3.95 | 15d | 4 | 0.83mi |
| 333 Las Olas Way #2103 Fort Lauderdale, FL | 2.0 | 2.5 | 1869 | $6,000 | $3.21 | 25d | 1 | 0.84mi |
Listing history 15 events
-
2026-06-18days on market $699,000 Active 21 DOM
-
2026-06-17days on market $699,000 Active 20 DOM
-
2026-06-16days on market $699,000 Active 19 DOM
-
2026-06-15days on market $699,000 Active 18 DOM
-
2026-06-13days on market $699,000 Active 16 DOM
-
2026-06-09days on market $699,000 Active 12 DOM
-
2026-06-08days on market $699,000 Active 11 DOM
-
2026-06-07days on market $699,000 Active 10 DOM
-
2026-06-04days on market $699,000 Active 7 DOM
-
2026-06-03days on market $699,000 Active 6 DOM
-
2026-06-02days on market $699,000 Active 5 DOM
-
2026-06-01days on market $699,000 Active 4 DOM
-
2026-05-31days on market $699,000 Active 3 DOM
-
2026-05-28$699,000 Active
-
1984-05-01soldstatus $61,000
ⓘ Source: listings_history table (triggers on properties + properties_extension) + one-shot
backfill from property_details.listing_events for pre-trigger history.
Tax reassessment forecast FL · Resets to sale price
- Current annual tax
- $11,748 · $979/mo
- Projected year-2 tax
- $11,748 · $979/mo
- Expected delta
- $0/yr ($0/mo · 0.0%)
ⓘ Screening estimate from a state-policy table — verify with the county assessor before closing.
Climate risk First Street
- Flood 4/10 Moderate FEMA zone X (shaded) · 23% chance over 30 yrs
- Wildfire 1/10 Low
- Heat 10/10 Extreme 7 d/yr ≥105°F today · 26 d/yr by 30 yrs out
- Wind 10/10 Extreme 99% chance of damaging wind over 30 yrs
- Air quality 2/10 Low 2 unhealthy d/yr today · 2 by 30 yrs out
Nearby sold comps map
Loading sold comps map…
Walkable amenities ~0.75 mi
Loading nearby amenities…
Taxation est. · year 1
- Rental income
- $93,936
- − Mortgage interest
- −$39,155
- − Property taxes
- −$11,748
- − Insurance
- −$3,495
- − Repairs & maintenance
- −$7,515
- − Management
- −$7,515
- − Depreciation
- −$20,335
- Taxable income
- $4,174
- Est. tax owed @ 24.0%
- −$1,002
- After-tax cash flow
- $13,977/yr
For passive investors: Depreciation is non-cash, so a rental often shows a tax loss while cash-flowing — sheltering income. Rental losses are passive: they offset passive income freely, and up to $25,000/yr can offset ordinary (W-2) income if you actively participate and your MAGI is under $100k (phasing out to $0 by $150k); unused losses carry forward. On sale, claimed depreciation is recaptured at up to 25%, and gains may owe capital-gains tax (a 1031 exchange can defer both). Figures are a year-1 estimate at your 24.0% rate — not tax advice; consult a CPA.
Schools (NCES district)
- District
- Broward
- NCES district ID
- 1200180
- Math proficiency
- 42% ▼ -18.00%
- Reading proficiency
- 53% ▼ -5.00%
- Median HH income
- $52,139
- Composite
- 40.88/100
- National rank
- #3621
- State rank
- #46 of 73 in FL
Livability — Fort Lauderdale
- Score
- 82/100
- State rank
- #78
- US rank
- #1293
Category grades
Schools grade is shown separately in the Schools card above.
Census & demographics
- Census place
- Fort Lauderdale, FL
- County
- Broward County · 1,963,430 people
- Metro
- Miami-Fort Lauderdale-Pompano Beach, FL
- Population (ZIP)
- 74,898
- Household income
- $53,973
- Rent vs Own
- Severe rent burden
- 5068.0
Population outlook (Broward County) Hauer SSP2
- Today (2025)
- 2,207,033 people
- By 2030
- 2,360,704 · +7.0%
- By 2040
- 2,661,208 · +20.6%
- By 2050
- 2,946,698 · +33.5%
- By 2075
- 3,602,273 · +63.2%
- By 2100
- 3,970,984 · +79.9%
Race, ethnicity, and origin ACS 2023
- Neighborhood character
- Predominantly Black (77%)
- Race & ethnicity
- Black 77% Two or more races 9% White 9% Hispanic / Latino 9%
- Hispanic origin (detail)
- Mexican 1% Puerto Rican 2% Cuban 1%
- Common ancestry
- Hispanic 15% Lithuanian 1% Romanian 0%
- Foreign-born
- 24% · Canada, Jamaica
- Languages at home
- 78% English-only · French/Haitian/Cajun 14% Spanish 6% Other Indo-European 1%
Political lean MEDSL · Broward
- 2024 margin
- D (+17.0) · D 58.0% · R 41.0%
- 2008→2024 swing
- -17.8pp toward R · 2008: 34.7pp · 2024: 17.0pp
- All cycles
- 2024: D+17.0 2020: D+29.8 2016: D+35.0 2012: D+34.9 2008: D+34.7
Not yet ingested
- Civics
- —
Market trends
- HPI YoY
- ▼ -300.68%
- Current HPI
- 535.2504
- Rent YoY
- ▲ 2.78%
- Metro
- Miami-Fort Lauderdale-Pompano Beach, FL
- State GDP YoY
- ▲ 3.28%
- F500 in state
- 36
Industry mix (Fortune 500 HQ in FL)
| Industry | F500 HQs | Revenue |
|---|---|---|
| Industrial Technology | 2 | $29B |
|
||
| Insurance | 2 | $17B |
|
||
| Retail | 1 | $60B |
|
||
| Technology Distribution | 1 | $58B |
|
||
| Homebuilding | 1 | $35B |
|
||
| Technology Manufacturing | 1 | $35B |
|
||
Price history
+1045.9% since first listed2 events — show timeline
- 2026-05-28 Listed $699,000 Beaches MLS
- 1984-05-01 Sold (Public Records) $61,000 Public Records
Property tax history
+11.8%/yrLatest (2025): $11,748 · +18.8% YoY. Source: county tax records.
Cash-flow waterfall
monthlySold comps — $/sqft
last 12 mo · ≤1 miLoading sold comps…