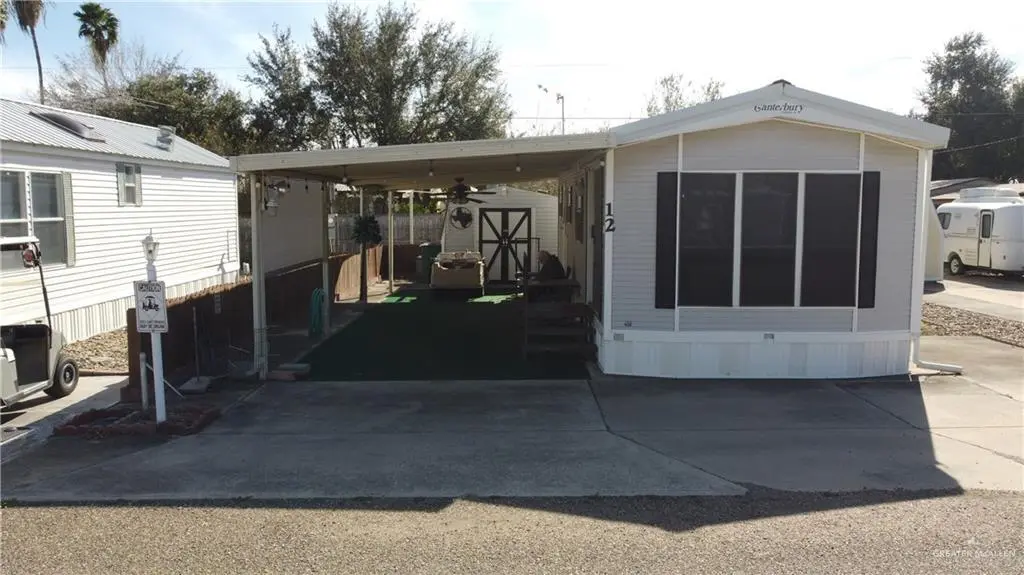
12 London Ave · Palmview, TX
Flood risk No data
- FEMA flood zone
- —
- Chance of flooding over 30 yrs
- —
- Est. flood insurance / yr
- —
Fire risk No data
- Est. fire insurance / yr
- —
Heat risk No data
- Hot days now (above threshold)
- —
- Hot days in 30 yrs
- —
Wind risk No data
- Chance of severe wind over 30 yrs
- —
Air-quality risk No data
- Unhealthy air days now
- —
- Unhealthy air days in 30 yrs
- —
Risk factors via First Street. Map © Google.
Why this score? — see what drove the B grade
The composite is a weighted blend of 9 inputs, each scored 0–100. Each bar is that input's sub-score; the figure is the points it added to the 100-point composite (weight × sub-score).
- Cash flow +30.0/30.0
- ARV discount +15.0/15.0
- 1% rule +10.0/10.0
- DSCR +10.0/10.0
- Livability +2.9/5.0
- Rent growth +2.7/5.0
- Condition / age +2.5/5.0
- Schools +1.9/10.0
- Appreciation +0.0/10.0
$45,000
🖨 Deal sheet 📄 Offer letter ✓ Due diligence
Listing remarks MLS
Move in ready home! Check out this fully furnished recently remodeled property. It is located on the Lamplighter 55+ community in Palmview Texas, it offers 1 bedroom 1 bath sitting on a good size lot with a large attached carport connecting to a workshop-storage room. Don't let this very affordable move in ready property slip by your hands and make it yours today.
Key facts
- Recently remodeled
- 2,029 sq ft lot
- Parking
Tags
Neighborhood map
What this means for you Summary
Snapshot
- This is a 3-bed/1.0-bath manufactured listed at $45k.
Deal economics
- At list price, monthly cash flow is $603 ($7k/yr) — positive.
- The deal already cash-flows at list — no discount required.
- Meets the 1% rule at list price ($1k rent vs $45k).
- Recommended offer: $40k (12.0% below list) — sets the bar for market timing.
- Cap rate 22.4% vs local median 4.2% in Palmview — top-decile yield for the area; either an underpriced asset or a hidden risk that comps aren't pricing in. Stress-test before assuming the spread holds.
Location & tenants
- Location reads 57/100 on livability (#1,267 in TX) — a working-class tenant base; expect higher turnover. Strengths: cost of living A+, housing A; Watch: crime D, schools F, amenities F.
- La Joya ISD (suburban): math 18% / reading 29% proficiency, ranked #759 of 826 in TX (top 92%) — low school quality limits family demand, transient renter base, plan for 1-2y turnover.
- Market conditions: Rents flat; 852 active listings in the ZIP; 7,378 units permitted in Hidalgo County in 2024 (641 in 5+ unit buildings).
Forward outlook
- Local home prices are declining (-3.0%/yr); year-one equity from $311 of loan paydown is wiped out by about $1k of value loss. Plan a longer hold.
- Hidalgo County population projected at +28% by 2050 — long-run rental-demand tailwind backs the buy-and-hold thesis.
- At projected returns (-3.0% appreciation + 0.9% rent growth), your $13k cash investment doubles in ~3 years — after that, you're playing with house money.
Negotiation context
- It's been on market 141 days — a 12% lower offer ($40k) is reasonable based on typical stale-listing flexibility.
Questions for the listing agent
- It's been on market 141 days. Have you received any prior offers? Is the seller open to a 12% concession, seller financing, or rate buy-down credit?
- What does the HOA fee cover, when was the last increase, and are there any pending special assessments or reserve-fund shortfalls?
- Why hasn't it sold? Are there any deal-killer items the seller is aware of (foundation, flood, title, zoning, code violations)?
- Is there a deadline driving the sale (1031 exchange, divorce, estate, relocation)? That informs how much negotiation room exists.
- Schools are F-rated, which usually means shorter tenancies and higher turnover. Who's the typical renter profile here, and what's been the actual vacancy rate?
- Crime grade is D in this area — have there been break-ins, vandalism, or insurance claims at this property in the last 3 years? What carrier currently insures it and at what premium?
- What's the average days-on-market for RENTAL listings here right now (not sales)? A rising rental-DOM trend means longer vacancies and softer asking-rent achievability than the comps imply.
- What's the recent tenant-quality profile in this submarket — average credit score on applications, eviction rate, late-payment / NSF rate, and stable-employment percentage? A property-management company in the area should have these aggregated.
- How much new for-sale + rental construction is in the pipeline within 1–3 miles? Heavy new supply typically softens prices + rents 12–24 months out; constrained supply supports both.
Investment metrics
- 1% rule
- 2.57% ✓
- Cap rate
- 22.38%
- Cash-on-cash
- 57.46%
- DSCR
- 3.56
- GRM
- 3.2
CMA / ARV
- ARV (median comp)
- $69,500
- List price
- $45,000
- Delta
- -35.25%
- Verdict
- UNDERPRICED
- Comps
- 1 within 2.0 mi
Show comp detail 1 sale within ~0.75 mi
| Address | Dist | Beds/Ba | Sqft | Sold | Price | $/sf | Match |
|---|---|---|---|---|---|---|---|
| 149 Lantern Ave | 0.06mi | 2/1.0 (-1) | 432 (+2%) | 23mo | $35,500 | $82 | 70 |
Match score weights: distance 35% · size 25% · config 20% · recency 20%. Top-matched comps best support the ARV.
Projected returns pro-forma
-3.0% appreciation · 0.93% rent growth · sell at horizon
- IRR
- 53.6%
- Equity multiple
- 3.28×
- Total profit
- $28,788
- Equity at exit
- $6,710
- IRR
- 58.0%
- Equity multiple
- 6.18×
- Total profit
- $65,322
- Equity at exit
- $3,891
Cash invested: $12,600 (down + closing). Projections, not guarantees.
Landlord ↔ Tenant lean methodology
- Overall (STATE)
- 87 Strongly Landlord-Friendly
- State Texas
- 87 Strongly Landlord-Friendly · R+5
- County
- — inherits STATE
- City
- — inherits STATE
ZIP-level market 78572
- Home prices YoY
- -22.9%
- Rents YoY
- 0.9%
- Active inventory
- 852
- Price-to-rent
- 3.2×
Monthly cashflow live
- Estimated rent
- $1,157 medium interval (Pro) →
- Mortgage (P&I)
- −$236
- Tax from tax record
- −$29 /mo · $345/yr
- Insurance
- −$19
- HOA
- −$27
- Vacancy / Maint / Mgmt
- −$243
- Net cashflow
- $603
Break-even live
UW: 25.0% down · 7.5% · 30yr · 1.5% tax · 5.0% vac · 8.0% maint · 8.0% mgmt
Financing live
Cash to close
- Down payment
- $11,250
- Closing costs
- $1,350
- Reserves months
- —
- Total cash needed
- —
Loan-product check · same deal, 3 products live
Conventional
25% down · 7.5% · 30yr
- Down + closing
- —
- Monthly P&I
- —
- Monthly cashflow
- —
- DSCR
- —
- Eligible?
- —
Personal DTI + credit; lowest rate.
DSCR
20% down · 8.5% · 30yr
- Down + closing
- —
- Monthly P&I
- —
- Monthly cashflow
- —
- DSCR
- —
- Eligible?
- —
No personal income docs; deal must DSCR.
Hard money
10% down · 12.0% · 12mo
- Down + closing
- —
- Monthly P&I
- —
- Monthly cashflow
- —
- DSCR
- —
- Eligible?
- —
Short-term bridge; refi at stabilization.
HOA detail
- Monthly dues
- $27 · $324/yr
Listing history 21 events
-
2026-06-18days on market $45,000 Active 141 DOM
-
2026-06-17days on market $45,000 Active 140 DOM
-
2026-06-16days on market $45,000 Active 139 DOM
-
2026-06-15days on market $45,000 Active 138 DOM
-
2026-06-14days on market $45,000 Active 136 DOM
-
2026-06-13days on market $45,000 Active 135 DOM
-
2026-06-10days on market $45,000 Active 133 DOM
-
2026-06-09days on market $45,000 Active 132 DOM
-
2026-06-08days on market $45,000 Active 131 DOM
-
2026-06-07days on market $45,000 Active 130 DOM
-
2026-06-05days on market $45,000 Active 127 DOM
-
2026-06-03days on market $45,000 Active 126 DOM
-
2026-06-02days on market $45,000 Active 125 DOM
-
2026-06-01days on market $45,000 Active 124 DOM
-
2026-05-31days on market $45,000 Active 123 DOM
-
2026-05-31days on market $45,000 Active 122 DOM
-
2026-05-17price $45,000 366-char remark
Show marketing remark (366 chars)
Move in ready home! Check out this fully furnished recently remodeled property. It is located on the Lamplighter 55+ community in Palmview Texas, it offers 1 bedroom 1 bath sitting on a good size lot with a large attached carport connecting to a workshop-storage room. Don't let this very affordable move in ready property slip by your hands and make it yours today.
-
2026-01-23$50,000 Active 366-char remark
Show marketing remark (366 chars)
Move in ready home! Check out this fully furnished recently remodeled property. It is located on the Lamplighter 55+ community in Palmview Texas, it offers 1 bedroom 1 bath sitting on a good size lot with a large attached carport connecting to a workshop-storage room. Don't let this very affordable move in ready property slip by your hands and make it yours today.
-
2009-02-03soldstatus
-
2007-02-13soldstatus
-
2001-12-07soldstatus
ⓘ Source: listings_history table (triggers on properties + properties_extension) + one-shot
backfill from property_details.listing_events for pre-trigger history.
Tax reassessment forecast TX · Resets to sale price
- Current annual tax
- $345 · $29/mo
- Projected year-2 tax
- $824 · $69/mo
- Expected delta
- +$478/yr (+$40/mo · 138.4%)
ⓘ Screening estimate from a state-policy table — verify with the county assessor before closing.
Nearby sold comps map
Loading sold comps map…
Walkable amenities ~0.75 mi
Loading nearby amenities…
Taxation est. · year 1
- Rental income
- $13,881
- − Mortgage interest
- −$2,521
- − Property taxes
- −$345
- − Insurance
- −$225
- − Repairs & maintenance
- −$1,110
- − Management
- −$1,110
- − HOA
- −$324
- − Depreciation
- −$1,309
- Taxable income
- $6,935
- Est. tax owed @ 24.0%
- −$1,664
- After-tax cash flow
- $5,575/yr
For passive investors: Depreciation is non-cash, so a rental often shows a tax loss while cash-flowing — sheltering income. Rental losses are passive: they offset passive income freely, and up to $25,000/yr can offset ordinary (W-2) income if you actively participate and your MAGI is under $100k (phasing out to $0 by $150k); unused losses carry forward. On sale, claimed depreciation is recaptured at up to 25%, and gains may owe capital-gains tax (a 1031 exchange can defer both). Figures are a year-1 estimate at your 24.0% rate — not tax advice; consult a CPA.
Schools (NCES district)
- District
- La Joya ISD
- NCES district ID
- 4826130
- Math proficiency
- 18% ▼ -35.00%
- Reading proficiency
- 29% ▼ -10.00%
- Median HH income
- $27,845
- Composite
- 18.65/100
- National rank
- #8891
- State rank
- #759 of 826 in TX
Livability — Palmview
- Score
- 57/100
- State rank
- #1267
- US rank
- #22043
Category grades
Schools grade is shown separately in the Schools card above.
Census & demographics
- Census place
- Palmview, TX
- County
- Hidalgo County · 623,128 people
- Metro
- McAllen-Edinburg-Mission, TX
- Population (ZIP)
- 78,024
- Household income
- $54,298
- Rent vs Own
- Severe rent burden
- 1714.0
Population outlook (Hidalgo County) Hauer SSP2
- Today (2025)
- 955,232 people
- By 2030
- 1,009,774 · +5.7%
- By 2040
- 1,120,332 · +17.3%
- By 2050
- 1,225,036 · +28.2%
- By 2075
- 1,439,189 · +50.7%
- By 2100
- 1,533,429 · +60.5%
Race, ethnicity, and origin ACS 2023
- Neighborhood character
- Predominantly Hispanic (85%)
- Race & ethnicity
- Hispanic / Latino 85% Two or more races 47% White 12% Asian 2%
- Hispanic origin (detail)
- Mexican 80%
- Common ancestry
- Slovak 1% Portuguese 0%
- Foreign-born
- 28% · Canada, South Korea
- Languages at home
- 22% English-only · Spanish 76%
Political lean MEDSL · Hidalgo
- 2024 margin
- Toss-up / Even · D 48.1% · R 51.0%
- 2008→2024 swing
- -41.6pp toward R · 2008: 38.7pp · 2024: -2.9pp
- All cycles
- 2024: R+2.9 2020: D+17.1 2016: D+40.5 2012: D+41.8 2008: D+38.7
Not yet ingested
- Civics
- —
Market trends
- HPI YoY
- ▼ -62.35%
- Current HPI
- 209.3573
- Rent YoY
- ▲ 0.93%
- Metro
- McAllen-Edinburg-Mission, TX
- State GDP YoY
- ▲ 3.95%
- F500 in state
- 110
Industry mix (Fortune 500 HQ in TX)
| Industry | F500 HQs | Revenue |
|---|---|---|
| Energy | 16 | $1,198B |
|
||
| Technology | 5 | $198B |
|
||
| Engineering / Construction | 4 | $72B |
|
||
| Energy Services | 3 | $60B |
|
||
| Utilities | 3 | $41B |
|
||
| Healthcare | 2 | $330B |
|
||
Price history
-10.0% since first listed5 events — show timeline
- 2026-05-17 Price Changed $45,000 MCALLENMLS
- 2026-01-23 Listed $50,000 MCALLENMLS
- 2009-02-03 Sold (Public Records) — Public Records
- 2007-02-13 Sold (Public Records) — Public Records
- 2001-12-07 Sold (Public Records) — Public Records
Property tax history
+6.9%/yrLatest (2025): $345 · +18.4% YoY. Source: county tax records.
Cash-flow waterfall
monthlySold comps — $/sqft
last 12 mo · ≤1 miLoading sold comps…