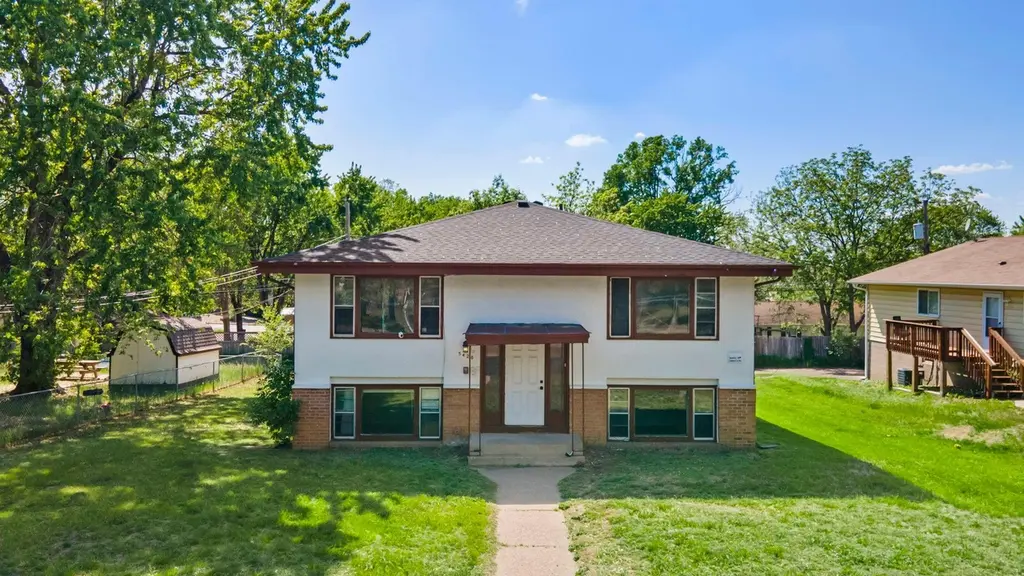
 Fourplex
5428 5th St NE · Fridley, MN
Flood risk 1/10 · Minimal
- FEMA flood zone
- X (unshaded)
- Chance of flooding over 30 yrs
- 0.0%
- Est. flood insurance / yr
- $507 – $1,088
Fire risk 1/10 · Minimal
- Est. fire insurance / yr
- $888 – $1,650
Heat risk 2/10 · Minimal
- Hot days now (above 100°F)
- 7 days/yr
- Hot days in 30 yrs
- 14 days/yr
Wind risk 2/10 · Minimal
- Chance of severe wind over 30 yrs
- —
Air-quality risk 2/10 · Minimal
- Unhealthy air days now
- 2 days/yr
- Unhealthy air days in 30 yrs
- 2 days/yr
Risk factors via First Street. Map © Google.
Why this score? — see what drove the D grade
The composite is a weighted blend of 9 inputs, each scored 0–100. Each bar is that input's sub-score; the figure is the points it added to the 100-point composite (weight × sub-score).
- Cash flow +14.1/30.0
- ARV discount +7.5/15.0
- DSCR +4.3/10.0
- 1% rule +4.1/10.0
- Livability +3.8/5.0
- Rent growth +3.6/5.0
- Schools +2.7/10.0
- Condition / age +2.5/5.0
- Appreciation +0.0/10.0
$575,000
🖨 Deal sheet (PDF) 📄 Offer letter ✓ Due diligence
Multi-family units
County records classify this as Multi-Family (5+ Unit). Listing-text estimate: 4 units. estimate disagrees with records
5+ unit building — per-unit beds/baths from public records are typically unavailable; the breakdown below (if shown) is an estimate from the listing text.
Listing remarks MLS
4 Plex investment or owner occupant opportunity in Fridley with a vacant unit ready for an owner occupant or a renter of your choice! Unit 1 remodeled in 2021: new paint throughout, new kitchen countertops, new SS appliances, full bathroom remodel. All common areas remodeled in 2021 (new paint, carpet, flooring). 3 units are 2 bedrooms, and 1 unit is a 1 bedroom. The roof is less than 8 years old! Brand new water heater too! A financial report can be furnished for more accurate expenses and rents. Measurements are approximate.
Key facts
- Off-street parking
- Dedicated mail area
- 0.24 acre lot
Tags
Property features AI
Finance
- Other: Owner-occupied: No; Above-grade finished area and living area details provided (total living area 2,873)
- Financial info: Rental license: Standard (rental license active)
- HOA & community: Association provides laundry amenity
Exterior
- Parking: Parking lot available
- Utilities: City water connected; City sewer connected; Natural gas
- Home design: Residential income property; 4-unit building
- Construction: Block foundation; Foundation area approximately 1,530 (area value provided)
- Exterior features: Stone and stucco exterior; No fencing; Located within about six blocks of public transit; City street frontage on a public-maintained road; Irregular lot shape
Interior
- Kitchen: Each unit equipped with range, refrigerator, and exhaust fan/hood
- Bedrooms: Total of 7 bedrooms across units (units include main-floor primary bedrooms)
- Bathrooms: Each unit has 1 full bathroom
- Heating & cooling: Baseboard heating; Central cooling in individual units
- Interior features: Split-entry (bi-level) layout; Common-area laundry with utility sink; Has basement (none finished listed)
- Laundry & utility: Shared laundry available; Laundry located in lower level (common area); Laundry includes a sink
Neighborhood map
What this means for you Summary
Snapshot
- This is a 3×2bd/1ba + 1×1bd/1ba units multifamily listed at $575k.
Deal economics
- At list price, monthly cash flow is $89 ($1k/yr) — positive. Per door: $22/mo.
- The deal already cash-flows at list — no discount required.
- To meet the 1% rule (rent ≥ 1% of price), the offer needs to be $526k (8.5% below list).
- Recommended offer: $526k (8.5% below list) — sets the bar for 1% rule.
- Cap rate 6.5% vs local median 3.2% in Fridley — top-decile yield for the area; either an underpriced asset or a hidden risk that comps aren't pricing in. Stress-test before assuming the spread holds.
Location & tenants
- Location reads 75/100 on livability (#185 in MN, #3,977 nationally) — a middle-class / working-renter tenant base. Strengths: commute A+, housing A+, employment B+; Watch: crime C-, amenities F, health & safety F.
- Fridley Public School District (suburban): math 27% / reading 35% proficiency, ranked #265 of 301 in MN (top 88%) — families likely to look elsewhere, expect single-tenant / working-renter base with shorter leases.
- Zoned schools: Stevenson Elementary (math 22% / reading 22%, grade F, #732 of 857 statewide, top 88%, 447 students, 76% FRL); Fridley Middle (math 22% / reading 42%, grade F, #188 of 258 statewide, top 73%, 745 students, 76% FRL); Fridley Senior High (math 27% / reading 47%, grade F, #282 of 471 statewide, top 63%, 854 students, 75% FRL) — zoned schools average 76% FRL vs 50% district-wide (25 pts higher); higher-poverty schools than district average — tighter screening recommended.
- Market conditions: Rents rising fast (+4.5%/yr); 145 active listings in the ZIP; 1,083 units permitted in Anoka County in 2024 (134 in 5+ unit buildings).
- At $5,260/mo this rent would consume 89% of the median local household income ($71k/yr) (locally 1747% of renters already pay >50% of income on rent) — very limited rent-growth headroom before tenants either downsize or default.
Forward outlook
- Local home prices are declining (-3.0%/yr); year-one equity from $4k of loan paydown is wiped out by about $17k of value loss. Plan a longer hold.
- Anoka County population projected at +11% by 2050 — modest demand growth; plan on rents tracking national, not racing it.
Negotiation context
- It's been on market 20 days — a 2% lower offer ($566k) is reasonable based on typical stale-listing flexibility.
- 15 sale attempts since 26y ago with the ask held roughly flat each time — persistent listings suggest the price (not the market) is what's stuck; bring a comps-based counter.
Questions for the listing agent
- Can we see the unit-by-unit rent roll, current vacancy, and any below-market leases? What's the average tenancy length?
- What capital expenditures (roof, boiler, parking lot, exteriors) have been made in the last 5 years, and what's planned in the next 2?
- Built in 1961 — when were the roof, HVAC, electrical panel, plumbing, and water heater last replaced?
- Is there a deadline driving the sale (1031 exchange, divorce, estate, relocation)? That informs how much negotiation room exists.
- The area grade is low — what's the realistic commute time and amenity access for the typical tenant pool here? Any planned neighborhood developments (good or bad) we should know about?
- What's the average days-on-market for RENTAL listings here right now (not sales)? A rising rental-DOM trend means longer vacancies and softer asking-rent achievability than the comps imply.
- What's the recent tenant-quality profile in this submarket — average credit score on applications, eviction rate, late-payment / NSF rate, and stable-employment percentage? A property-management company in the area should have these aggregated.
- How much new apartment / multifamily construction is in the pipeline within 1–3 miles? Heavy new supply (>2% of stock underway) typically softens rents 12–24 months out; light construction supports rent growth.
Investment metrics
- 1% rule
- 0.91% ✗
- Cap rate
- 6.48%
- Cash-on-cash
- 0.66%
- DSCR
- 1.03
- GRM
- 9.1
CMA / ARV
No comps found within radius.
Projected returns pro-forma
-3.0% appreciation · 4.51% rent growth · sell at horizon
- IRR
- -13.5%
- Equity multiple
- 0.51×
- Total profit
- $-79,284
- Equity at exit
- $85,734
- IRR
- -2.3%
- Equity multiple
- 0.83×
- Total profit
- $-26,891
- Equity at exit
- $49,715
Cash invested: $161,000 (down + closing). Projections, not guarantees.
Landlord ↔ Tenant lean methodology
- Overall (STATE)
- 46 Balanced
- State Minnesota
- 46 Balanced · D+2
- County
- — inherits STATE
- City
- — inherits STATE
ZIP-level market 55421
- Rents YoY
- 4.5%
- Active inventory
- 145
- Price-to-rent
- 35.6×
Monthly cashflow live
- Estimated rent
- $5,260 high interval (Pro) →
- Mortgage (P&I)
- −$3,015
- Tax from tax record
- −$812 /mo · $9,742/yr
- Insurance
- −$240
- HOA
- −$0
- Vacancy / Maint / Mgmt
- −$1,105
- Net cashflow
- $89
Break-even live
Sensitivity live
| Price | -10% $414 | -5% $251 | +0% $89 | +5% $-74 | +10% $-237 |
|---|---|---|---|---|---|
| Rent | -10% $-327 | -5% $-119 | +0% $89 | +5% $296 | +10% $504 |
| Rate | -1.0pp $378 | -0.5pp $235 | base $89 | +0.5pp $-60 | +1.0pp $-212 |
4-unit breakdown (identical units grouped — click to expand)
| Units | Beds | Baths | Est. rent |
|---|---|---|---|
| 3× units | 2 | 1 | $4,035 |
| #1 | 2 | 1 | $1,345 |
| #2 | 2 | 1 | $1,345 |
| #3 | 2 | 1 | $1,345 |
| 1× unit | 1 | 1 | $1,224 |
| Total (4 units) | $5,260 | ||
UW: 25.0% down · 7.5% · 30yr · 1.5% tax · 5.0% vac · 8.0% maint · 8.0% mgmt
Financing live
Cash to close
- Down payment
- $143,750
- Closing costs
- $17,250
- Reserves months
- —
- Total cash needed
- —
Loan-product check · same deal, 3 products live
Conventional
25% down · 7.5% · 30yr
- Down + closing
- —
- Monthly P&I
- —
- Monthly cashflow
- —
- DSCR
- —
- Eligible?
- —
Personal DTI + credit; lowest rate.
DSCR
20% down · 8.5% · 30yr
- Down + closing
- —
- Monthly P&I
- —
- Monthly cashflow
- —
- DSCR
- —
- Eligible?
- —
No personal income docs; deal must DSCR.
Hard money
10% down · 12.0% · 12mo
- Down + closing
- —
- Monthly P&I
- —
- Monthly cashflow
- —
- DSCR
- —
- Eligible?
- —
Short-term bridge; refi at stabilization.
Listing history 13 events
-
2026-06-21days on market $575,000 Active 20 DOM
-
2026-06-18days on market $575,000 Active 17 DOM
-
2026-06-17days on market $575,000 Active 16 DOM
-
2026-06-16days on market $575,000 Active 15 DOM
-
2026-06-15days on market $575,000 Active 14 DOM
-
2026-06-13pricedays on market $575,000 Active 12 DOM
-
2026-06-09days on market $600,000 Active 8 DOM
-
2026-06-08days on market $600,000 Active 7 DOM
-
2026-06-07days on market $600,000 Active 6 DOM
-
2026-06-04days on market $600,000 Active 3 DOM
-
2026-06-03days on market $600,000 Active 2 DOM
-
2026-06-02remarks 699-char remark
-
2026-06-02$600,000 Active 1 DOM
ⓘ Source: listings_history table (triggers on properties + properties_extension) + one-shot
backfill from property_details.listing_events for pre-trigger history.
Tax reassessment forecast MN · Partial reset (capped growth)
- Current annual tax
- $9,742 · $812/mo
- Projected year-2 tax
- $9,742 · $812/mo
- Expected delta
- $0/yr ($0/mo · 0.0%)
ⓘ Screening estimate from a state-policy table — verify with the county assessor before closing.
Climate risk First Street
- Flood 1/10 Low FEMA zone X (unshaded) · 0% chance over 30 yrs
- Wildfire 1/10 Low
- Heat 2/10 Low 7 d/yr ≥100°F today · 14 d/yr by 30 yrs out
- Wind 2/10 Low
- Air quality 2/10 Low 2 unhealthy d/yr today · 2 by 30 yrs out
Nearby sold comps map
Loading sold comps map…
Walkable amenities ~0.75 mi
Loading nearby amenities…
Taxation est. · year 1
- Rental income
- $63,120
- − Mortgage interest
- −$32,209
- − Property taxes
- −$9,742
- − Insurance
- −$2,875
- − Repairs & maintenance
- −$5,050
- − Management
- −$5,050
- − Depreciation
- −$16,727
- Taxable loss
- −$8,533
- Est. tax savings @ 24.0%
- +$2,048
- After-tax cash flow
- $3,111/yr
For passive investors: Depreciation is non-cash, so a rental often shows a tax loss while cash-flowing — sheltering income. Rental losses are passive: they offset passive income freely, and up to $25,000/yr can offset ordinary (W-2) income if you actively participate and your MAGI is under $100k (phasing out to $0 by $150k); unused losses carry forward. On sale, claimed depreciation is recaptured at up to 25%, and gains may owe capital-gains tax (a 1031 exchange can defer both). Figures are a year-1 estimate at your 24.0% rate — not tax advice; consult a CPA.
Schools (NCES district)
- District
- Fridley Public School District
- NCES district ID
- 2712420
- Math proficiency
- 27% ▼ -11.00%
- Reading proficiency
- 35% ▼ -9.00%
- Median HH income
- $53,546
- Composite
- 27.35/100
- National rank
- #6983
- State rank
- #265 of 301 in MN
Livability — Fridley
- Score
- 75/100
- State rank
- #185
- US rank
- #3977
Category grades
Schools grade is shown separately in the Schools card above.
Census & demographics
- Census place
- Fridley, MN
- County
- Anoka County · 277,116 people
- City population
- 33,672
- Metro
- Minneapolis-St. Paul-Bloomington, MN-WI
- Population (ZIP)
- 30,843
- Household income
- $70,772
- Rent vs Own
- Severe rent burden
- 1747.0
Population outlook (Anoka County) Hauer SSP2
- Today (2025)
- 375,223 people
- By 2030
- 387,850 · +3.4%
- By 2040
- 407,239 · +8.5%
- By 2050
- 417,541 · +11.3%
- By 2075
- 448,447 · +19.5%
- By 2100
- 464,954 · +23.9%
Race, ethnicity, and origin ACS 2023
- Neighborhood character
- Diverse neighborhood (Simpson 0.66)
- Race & ethnicity
- White 52% Black 24% Hispanic / Latino 14% Two or more races 7% Asian 5%
- Hispanic origin (detail)
- Mexican 4%
- Common ancestry
- Portuguese 7% Romanian 5% Lithuanian 2%
- Foreign-born
- 22% · Canada, Vietnam, China
- Languages at home
- 72% English-only · Spanish 11% Arabic 1% Vietnamese 1%
Political lean MEDSL · Anoka
- 2024 margin
- Toss-up / Even · D 46.6% · R 51.0% · Other 2.4%
- 2008→2024 swing
- -2.0pp toward R · 2008: -2.4pp · 2024: -4.4pp
- All cycles
- 2024: R+4.4 2020: R+1.9 2016: R+9.7 2012: R+2.6 2008: R+2.4
Not yet ingested
- Civics
- —
Market trends
- HPI YoY
- ▼ -140.08%
- Current HPI
- 258.4424
- Rent YoY
- ▲ 4.51%
- Metro
- Minneapolis-St. Paul-Bloomington, MN-WI
- State GDP YoY
- ▲ 2.41%
- F500 in state
- 34
Industry mix (Fortune 500 HQ in MN)
| Industry | F500 HQs | Revenue |
|---|---|---|
| Healthcare | 2 | $407B |
|
||
| Retail | 2 | $150B |
|
||
| Consumer Goods | 2 | $32B |
|
||
| Industrial Machinery | 2 | $6B |
|
||
| Agriculture | 1 | $40B |
|
||
| Healthcare / Medical Devices | 1 | $32B |
|
||
Price history
+233.5% since first listed47 events — show timeline
- 2026-05-29 Listed $600,000 NORTHSTARMLS as Distributed by MLS Grid
- 2023-10-04 Sold (Public Records) $560,000 Public Records
- 2023-09-29 Sold (MLS) $560,000 NORTHSTARMLS as Distributed by MLS Grid
- 2023-07-24 Pending — NORTHSTARMLS as Distributed by MLS Grid
- 2023-07-15 Contingent — NORTHSTARMLS as Distributed by MLS Grid
- 2023-06-12 Listed $549,900 NORTHSTARMLS as Distributed by MLS Grid
- 2022-01-18 Price Changed $1,080 RENT.
- 2021-11-15 Sold (Public Records) $490,000 Public Records
- 2021-11-12 Sold (MLS) $490,000 NORTHSTARMLS as Distributed by MLS Grid
- 2021-08-11 Pending — NORTHSTARMLS as Distributed by MLS Grid
- 2021-07-29 Contingent — NORTHSTARMLS as Distributed by MLS Grid
- 2021-07-12 Price Changed $499,900 NORTHSTARMLS as Distributed by MLS Grid
- 2021-06-18 Listed $519,900 NORTHSTARMLS as Distributed by MLS Grid
- 2021-05-11 Sold (Public Records) $420,000 Public Records
- 2019-11-25 Listing Removed — NORTHSTARMLS as Distributed by MLS Grid
- 2019-11-14 Relisted — NORTHSTARMLS as Distributed by MLS Grid
- 2019-10-30 Pending — NORTHSTARMLS as Distributed by MLS Grid
- 2019-09-20 Listed $419,000 NORTHSTARMLS as Distributed by MLS Grid
- 2019-07-23 Listing Removed — NORTHSTARMLS as Distributed by MLS Grid
- 2019-05-22 Relisted — NORTHSTARMLS as Distributed by MLS Grid
- 2019-04-29 Listing Removed — NORTHSTARMLS as Distributed by MLS Grid
- 2019-04-18 Relisted — NORTHSTARMLS as Distributed by MLS Grid
- 2019-04-08 Listing Removed — NORTHSTARMLS as Distributed by MLS Grid
- 2019-04-03 Listed $419,000 NORTHSTARMLS as Distributed by MLS Grid
- 2018-08-07 Listing Removed — NORTHSTARMLS as Distributed by MLS Grid
- 2018-08-05 Price Changed $405,000 NORTHSTARMLS as Distributed by MLS Grid
- 2018-06-20 Price Changed $409,000 NORTHSTARMLS as Distributed by MLS Grid
- 2018-06-20 Relisted — NORTHSTARMLS as Distributed by MLS Grid
- 2018-06-11 Listing Removed — NORTHSTARMLS as Distributed by MLS Grid
- 2018-05-16 Relisted — NORTHSTARMLS as Distributed by MLS Grid
- 2018-05-13 Listing Removed — NORTHSTARMLS as Distributed by MLS Grid
- 2018-05-10 Listed $419,000 NORTHSTARMLS as Distributed by MLS Grid
- 2016-04-25 Sold (MLS) $255,000 NORTHSTARMLS as Distributed by MLS Grid
- 2016-04-05 Pending — NORTHSTARMLS as Distributed by MLS Grid
- 2016-03-25 Contingent — NORTHSTARMLS as Distributed by MLS Grid
- 2016-03-21 Listed $259,900 NORTHSTARMLS as Distributed by MLS Grid
- 2012-11-02 Listing Removed — NORTHSTARMLS as Distributed by MLS Grid
- 2011-11-02 Listed $239,900 NORTHSTARMLS as Distributed by MLS Grid
- 2007-02-16 Sold (Public Records) $320,000 Public Records
- 2006-08-22 Listing Removed — NORTHSTARMLS as Distributed by MLS Grid
- 2006-05-22 Listed $354,900 NORTHSTARMLS as Distributed by MLS Grid
- 2002-12-12 Sold (Public Records) $285,000 Public Records
- 2002-04-05 Sold (Public Records) $245,000 Public Records
- 2001-04-16 Sold (Public Records) $188,500 Public Records
- 2001-01-08 Sold (MLS) $188,500 NORTHSTARMLS as Distributed by MLS Grid
- 2000-11-07 Listing Removed — NORTHSTARMLS as Distributed by MLS Grid
- 2000-11-01 Listed $179,900 NORTHSTARMLS as Distributed by MLS Grid
Property tax history
+5.6%/yrLatest (2026): $9,742 · -4.9% YoY. Source: county tax records.
Cash-flow waterfall
monthlySold comps — $/sqft
last 12 mo · ≤1 miLoading sold comps…