 5-Plex
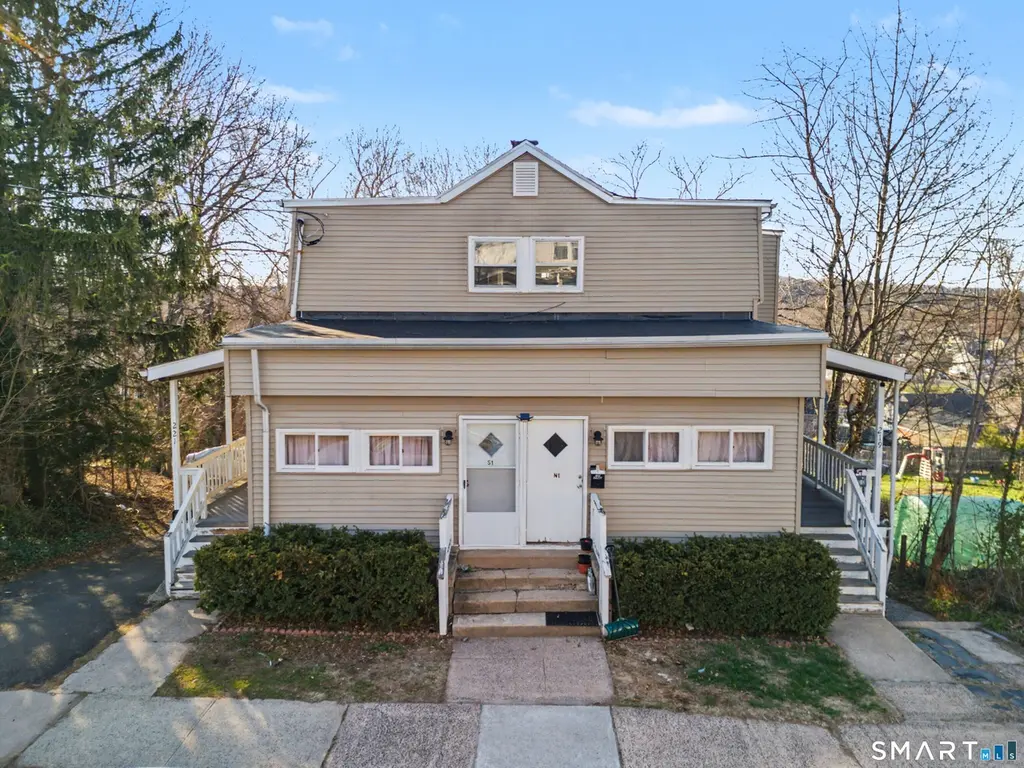
219 S Orchard St · Wallingford, CT
Flood risk 1/10 · Minimal
- FEMA flood zone
- X (unshaded)
- Chance of flooding over 30 yrs
- 0.0%
- Est. flood insurance / yr
- $507 – $1,088
Fire risk 1/10 · Minimal
- Est. fire insurance / yr
- $829 – $1,539
Heat risk 6/10 · Moderate
- Hot days now (above 97°F)
- 7 days/yr
- Hot days in 30 yrs
- 16 days/yr
Wind risk 6/10 · Moderate
- Chance of severe wind over 30 yrs
- 27.0%
Air-quality risk 4/10 · Minor
- Unhealthy air days now
- 3 days/yr
- Unhealthy air days in 30 yrs
- 5 days/yr
Risk factors via First Street. Map © Google.
Why this score? — see what drove the C+ grade
The composite is a weighted blend of 9 inputs, each scored 0–100. Each bar is that input's sub-score; the figure is the points it added to the 100-point composite (weight × sub-score).
- Cash flow +30.0/30.0
- 1% rule +10.0/10.0
- DSCR +10.0/10.0
- Schools +3.8/10.0
- Rent growth +2.5/5.0
- Livability +2.5/5.0
- Condition / age +2.5/5.0
- ARV discount +0.0/15.0
- Appreciation +0.0/10.0
$699,000
🖨 Deal sheet 📄 Offer letter ✓ Due diligence
Multi-family units
County records classify this as Multi-Family (5+ Unit). Listing-text estimate: 5 units. confirmed
5+ unit building — per-unit beds/baths from public records are typically unavailable; the breakdown below (if shown) is an estimate from the listing text.
Listing remarks MLS
5-unit multifamily in the heart of Wallingford, offered at $750,000. Gas heat, wood frame construction, and a proven rental history make this a straightforward addition to any investor's portfolio. Conveniently located near Route 5 and downtown Wallingford amenities. Financials available to qualified buyers upon request
Key facts
- 0.38 acre lot
- Built 1870
- Listed 35 days
Neighborhood map
What this means for you Summary
Snapshot
- This is a 5 × 9-bed/6.0-bath units multifamily listed at $699k.
Deal economics
- At list price, monthly cash flow is $5k ($62k/yr) — positive. Per door: $1k/mo.
- The deal already cash-flows at list — no discount required.
- Meets the 1% rule at list price ($12k rent vs $699k).
- Recommended offer: $678k (3.0% below list) — sets the bar for market timing.
Location & tenants
- Location reads: area grade C — affects rentability + tenant quality, not the cash-flow math above.
- Wallingford School District (suburban): math 34% / reading 49% proficiency, ranked #94 of 153 in CT (top 61%) — families likely to look elsewhere, expect single-tenant / working-renter base with shorter leases; only 16% free/reduced lunch — higher-income household profile.
- Market conditions: 111 active listings in the ZIP; solid renter incomes; 1,059 units permitted in South Central Connecticut Planning Region in 2024 (779 in 5+ unit buildings).
- At $12,219/mo this rent would consume 140% of the median local household income ($105k/yr) (locally 959% of renters already pay >50% of income on rent) — very limited rent-growth headroom before tenants either downsize or default.
Forward outlook
- Local home prices are declining (-3.0%/yr); year-one equity from $5k of loan paydown is wiped out by about $21k of value loss. Plan a longer hold.
- At projected returns (-3.0% appreciation + 3.0% rent growth), your $196k cash investment doubles in ~4 years — after that, you're playing with house money.
Negotiation context
- It's been on market 35 days — a 3% lower offer ($678k) is reasonable based on typical stale-listing flexibility.
- 4 sale attempts since 6y ago; this cycle's ask has dropped $51k (7%) from the opening price — seller is motivated, your offer sets the floor, not the list.
- Current owner paid $340k; list at $699k implies a 106% gain — meaningful room to come down on a strong offer.
Risks & watch-outs
- Watch-outs: built in 1870 — expect roof / HVAC / electrical / plumbing capex.
- Climate carrying-cost: major wind risk, 27% chance of damaging wind over 30y; extreme-heat days projected 7→16/yr by 2055 (HVAC capex compounding) — expect insurance premiums to compound above CPI over the hold.
Questions for the listing agent
- It's been on market 35 days. Have you received any prior offers? Is the seller open to a 3% concession, seller financing, or rate buy-down credit?
- Can we see the unit-by-unit rent roll, current vacancy, and any below-market leases? What's the average tenancy length?
- What capital expenditures (roof, boiler, parking lot, exteriors) have been made in the last 5 years, and what's planned in the next 2?
- Built in 1870 — when were the roof, HVAC, electrical panel, plumbing, and water heater last replaced?
- Is there a deadline driving the sale (1031 exchange, divorce, estate, relocation)? That informs how much negotiation room exists.
- What's the average days-on-market for RENTAL listings here right now (not sales)? A rising rental-DOM trend means longer vacancies and softer asking-rent achievability than the comps imply.
- What's the recent tenant-quality profile in this submarket — average credit score on applications, eviction rate, late-payment / NSF rate, and stable-employment percentage? A property-management company in the area should have these aggregated.
- How much new apartment / multifamily construction is in the pipeline within 1–3 miles? Heavy new supply (>2% of stock underway) typically softens rents 12–24 months out; light construction supports rent growth.
Investment metrics
- 1% rule
- 1.75% ✓
- Cap rate
- 15.20%
- Cash-on-cash
- 31.81%
- DSCR
- 2.42
- GRM
- 4.8
CMA / ARV
- ARV (median comp)
- $559,207
- List price
- $699,000
- Delta
- 25.00%
- Verdict
- OVERPRICED
- Comps
- 20 within 1.0 mi
Show comp detail 4 sales within ~0.75 mi
| Address | Dist | Beds/Ba | Sqft | Sold | Price | $/sf | Match |
|---|---|---|---|---|---|---|---|
| 31 S Whittlesey Ave | 0.40mi | 8/3.0 (+1) | 3,534 (+1%) | 16mo | $537,000 | $152 | 49 |
| 131 Prince St | 0.35mi | 6/3.0 (-1) | 3,583 (+3%) | 17mo | $550,000 | $154 | 48 |
| 245 Quinnipiac St | 0.50mi | 6/3.0 (-1) | 3,242 (-7%) | 19mo | $465,000 | $143 | 32 |
| 261 S Cherry St | 0.29mi | 8/2.0 (+1) | 2,990 (-14%) | 19mo | $485,000 | $162 | 27 |
Match score weights: distance 35% · size 25% · config 20% · recency 20%. Top-matched comps best support the ARV.
Projected returns pro-forma
-3.0% appreciation · 3.0% rent growth · sell at horizon
- IRR
- 26.7%
- Equity multiple
- 2.11×
- Total profit
- $217,105
- Equity at exit
- $104,223
- IRR
- 34.3%
- Equity multiple
- 4.14×
- Total profit
- $614,348
- Equity at exit
- $60,437
Cash invested: $195,720 (down + closing). Projections, not guarantees.
Landlord ↔ Tenant lean methodology
- Overall (STATE)
- 27 Tenant-Leaning
- State Connecticut
- 27 Tenant-Leaning · D+7
- County
- — inherits STATE
- City
- — inherits STATE
ZIP-level market 06492
- Active inventory
- 111
- Price-to-rent
- 23.8×
Monthly cashflow live
- Estimated rent
- $12,219 medium interval (Pro) →
- Mortgage (P&I)
- −$3,666
- Tax from tax record
- −$508 /mo · $6,100/yr
- Insurance
- −$291
- HOA
- −$0
- Vacancy / Maint / Mgmt
- −$2,566
- Net cashflow
- $5,188
Break-even live
5-unit breakdown (identical units grouped — click to expand)
| Units | Beds | Baths | Est. rent |
|---|---|---|---|
| 5× units | 9 | 6 | $12,220 |
| #1 | 9 | 6 | $2,444 |
| #2 | 9 | 6 | $2,444 |
| #3 | 9 | 6 | $2,444 |
| #4 | 9 | 6 | $2,444 |
| #5 | 9 | 6 | $2,444 |
| Total (5 units) | $12,219 | ||
UW: 25.0% down · 7.5% · 30yr · 1.5% tax · 5.0% vac · 8.0% maint · 8.0% mgmt
Financing live
Cash to close
- Down payment
- $174,750
- Closing costs
- $20,970
- Reserves months
- —
- Total cash needed
- —
Loan-product check · same deal, 3 products live
Conventional
25% down · 7.5% · 30yr
- Down + closing
- —
- Monthly P&I
- —
- Monthly cashflow
- —
- DSCR
- —
- Eligible?
- —
Personal DTI + credit; lowest rate.
DSCR
20% down · 8.5% · 30yr
- Down + closing
- —
- Monthly P&I
- —
- Monthly cashflow
- —
- DSCR
- —
- Eligible?
- —
No personal income docs; deal must DSCR.
Hard money
10% down · 12.0% · 12mo
- Down + closing
- —
- Monthly P&I
- —
- Monthly cashflow
- —
- DSCR
- —
- Eligible?
- —
Short-term bridge; refi at stabilization.
Listing history 19 events
-
2026-06-18days on market $699,000 Active 35 DOM
-
2026-06-17days on market $699,000 Active 34 DOM
-
2026-06-16days on market $699,000 Active 33 DOM
-
2026-06-15days on market $699,000 Active 32 DOM
-
2026-06-14pricedays on market $699,000 Active 30 DOM
-
2026-06-03days on market $750,000 Active 28 DOM
-
2026-06-03days on market $750,000 Active 27 DOM
-
2026-06-01days on market $750,000 Active 26 DOM
-
2026-05-31days on market $750,000 Active 25 DOM
-
2026-05-05$750,000 Active 321-char remark
Show marketing remark (321 chars)
5-unit multifamily in the heart of Wallingford, offered at $750,000. Gas heat, wood frame construction, and a proven rental history make this a straightforward addition to any investor's portfolio. Conveniently located near Route 5 and downtown Wallingford amenities. Financials available to qualified buyers upon request
-
2022-08-21price $1,200
-
2021-07-30soldstatus $340,000
-
2021-07-29soldstatus $340,000 Closed 600-char remark
Show marketing remark (600 chars)
This property is listed as a 4 unit, but can be a 5 unit (*owner occupies 2 units) With some TLC the units can be easily rented out or better yet bring your extended family! Everyone has their own space. Large lot, it is 2 parcels on 1 deed. Lots (#58 & #60) Updated porches and off street parking. Upper level has new carpets and beautiful exposed beams. Backyard has the potential to be amazing; a tiered yard with endless possibilities! Total 7 bedrooms, 6 baths. Wallingford Electric! All water heaters are electric; 2 just replaced. Area is central to major highways, shopping and much more!
-
2021-06-27historical Under Contract - Continue to Show 600-char remark
Show marketing remark (600 chars)
This property is listed as a 4 unit, but can be a 5 unit (*owner occupies 2 units) With some TLC the units can be easily rented out or better yet bring your extended family! Everyone has their own space. Large lot, it is 2 parcels on 1 deed. Lots (#58 & #60) Updated porches and off street parking. Upper level has new carpets and beautiful exposed beams. Backyard has the potential to be amazing; a tiered yard with endless possibilities! Total 7 bedrooms, 6 baths. Wallingford Electric! All water heaters are electric; 2 just replaced. Area is central to major highways, shopping and much more!
-
2021-06-09status Active 600-char remark
Show marketing remark (600 chars)
This property is listed as a 4 unit, but can be a 5 unit (*owner occupies 2 units) With some TLC the units can be easily rented out or better yet bring your extended family! Everyone has their own space. Large lot, it is 2 parcels on 1 deed. Lots (#58 & #60) Updated porches and off street parking. Upper level has new carpets and beautiful exposed beams. Backyard has the potential to be amazing; a tiered yard with endless possibilities! Total 7 bedrooms, 6 baths. Wallingford Electric! All water heaters are electric; 2 just replaced. Area is central to major highways, shopping and much more!
-
2021-04-20$369,000 Active 600-char remark
Show marketing remark (600 chars)
This property is listed as a 4 unit, but can be a 5 unit (*owner occupies 2 units) With some TLC the units can be easily rented out or better yet bring your extended family! Everyone has their own space. Large lot, it is 2 parcels on 1 deed. Lots (#58 & #60) Updated porches and off street parking. Upper level has new carpets and beautiful exposed beams. Backyard has the potential to be amazing; a tiered yard with endless possibilities! Total 7 bedrooms, 6 baths. Wallingford Electric! All water heaters are electric; 2 just replaced. Area is central to major highways, shopping and much more!
-
2020-11-20historical
-
2020-10-29price $365,000
-
2020-06-29$375,000 Active
ⓘ Source: listings_history table (triggers on properties + properties_extension) + one-shot
backfill from property_details.listing_events for pre-trigger history.
Tax reassessment forecast CT · Partial reset (capped growth)
- Current annual tax
- $6,100 · $508/mo
- Projected year-2 tax
- $10,529 · $877/mo
- Expected delta
- +$4,429/yr (+$369/mo · 72.6%)
ⓘ Screening estimate from a state-policy table — verify with the county assessor before closing.
Climate risk First Street
- Flood 1/10 Low FEMA zone X (unshaded) · 0% chance over 30 yrs
- Wildfire 1/10 Low
- Heat 6/10 Major 7 d/yr ≥97°F today · 16 d/yr by 30 yrs out
- Wind 6/10 Major 27% chance of damaging wind over 30 yrs
- Air quality 4/10 Moderate 3 unhealthy d/yr today · 5 by 30 yrs out
Nearby sold comps map
Loading sold comps map…
Walkable amenities ~0.75 mi
Loading nearby amenities…
Taxation est. · year 1
- Rental income
- $146,628
- − Mortgage interest
- −$39,155
- − Property taxes
- −$6,100
- − Insurance
- −$3,495
- − Repairs & maintenance
- −$11,730
- − Management
- −$11,730
- − Depreciation
- −$20,335
- Taxable income
- $54,083
- Est. tax owed @ 24.0%
- −$12,980
- After-tax cash flow
- $49,274/yr
For passive investors: Depreciation is non-cash, so a rental often shows a tax loss while cash-flowing — sheltering income. Rental losses are passive: they offset passive income freely, and up to $25,000/yr can offset ordinary (W-2) income if you actively participate and your MAGI is under $100k (phasing out to $0 by $150k); unused losses carry forward. On sale, claimed depreciation is recaptured at up to 25%, and gains may owe capital-gains tax (a 1031 exchange can defer both). Figures are a year-1 estimate at your 24.0% rate — not tax advice; consult a CPA.
Schools (NCES district)
- District
- Wallingford School District
- NCES district ID
- 0904740
- Math proficiency
- 34% ▼ -9.00%
- Reading proficiency
- 49% ▼ -7.00%
- Median HH income
- $73,423
- Composite
- 37.92/100
- National rank
- #4310
- State rank
- #94 of 153 in CT
Livability — Wallingford
No livability data for this city. (Only ~50 U.S. cities are tracked.)
Census & demographics
- Census place
- Wallingford Center, CT
- County
- New Haven County · 688,236 people
- City population
- 44,498
- Metro
- New Haven-Milford, CT
- Population (ZIP)
- 44,498
- Household income
- $105,061
- Rent vs Own
- Severe rent burden
- 959.0
Population outlook (South Central Connecticut County) Hauer SSP2
- By 2040
- 608,362
Race, ethnicity, and origin ACS 2023
- Neighborhood character
- Predominantly White (80%)
- Race & ethnicity
- White 80% Hispanic / Latino 11% Two or more races 6% Asian 4% Black 2%
- Hispanic origin (detail)
- Mexican 5% Puerto Rican 3%
- Common ancestry
- Romanian 11% Lithuanian 5% Russian 2%
- Foreign-born
- 11% · Canada, China
- Languages at home
- 85% English-only · Spanish 8% Other Indo-European 4% Russian/Polish/Slavic 1%
Political lean MEDSL · South Central Connecticut
- 2024 margin
- Strong D (+20.1) · D 59.0% · R 38.9% · Other 2.1%
- All cycles
- 2024: D+20.1
Not yet ingested
- Civics
- —
Market trends
- HPI YoY
- ▼ -259.08%
- Current HPI
- 248.4652
- Rent YoY
- —
- Metro
- New Haven-Milford, CT
- State GDP YoY
- ▲ 1.06%
- F500 in state
- 38
Industry mix (Fortune 500 HQ in CT)
| Industry | F500 HQs | Revenue |
|---|---|---|
| Industrial Machinery | 4 | $38B |
|
||
| Insurance | 3 | $71B |
|
||
| Financial Services | 2 | $25B |
|
||
| Transportation / Logistics | 2 | $18B |
|
||
| Healthcare | 1 | $247B |
|
||
| Telecommunications | 1 | $55B |
|
||
Price history
+100.0% since first listed10 events — show timeline
- 2026-05-05 Listed $750,000 Smart MLS
- 2022-08-21 Price Changed $1,200 RENT.
- 2021-07-30 Sold (Public Records) $340,000 Public Records
- 2021-07-29 Sold (MLS) $340,000 Smart MLS
- 2021-06-27 Contingent — Smart MLS
- 2021-06-09 Relisted — Smart MLS
- 2021-04-20 Listed $369,000 Smart MLS
- 2020-11-20 Listing Removed — Smart MLS
- 2020-10-29 Price Changed $365,000 Smart MLS
- 2020-06-29 Listed $375,000 Smart MLS
Property tax history
+2.7%/yrLatest (2023): $6,100 · +1.0% YoY. Source: county tax records.
Cash-flow waterfall
monthlySold comps — $/sqft
last 12 mo · ≤1 miLoading sold comps…